The 2021 Milliman Long Term Care Insurance Survey is the 23rd consecutive annual review of stand-alone long-term care insurance (LTCI) published by Broker World magazine. It analyzes the marketplace, reports sales distributions, and describes available products.
More discussion of worksite sales, including a comparison of worksite sales distributions vs. non-worksite sales distributions will be in Broker World magazine’s August issue.
Unless otherwise indicated, references are solely to U.S. stand-alone LTCI sales, excluding exercised future purchase options (FPOs) or other changes to existing coverage. “Stand-alone” refers to LTCI policies that do not include death benefits (other than returning premiums upon death or waiving a surviving spouse’s premiums) or annuity or disability income benefits. Where referenced, “combo” products provide LTCI combined with life insurance or annuity coverage. “Linked benefit” policies are combo policies which can allow more than the death benefit or annuity account value to be used as LTCI.
Highlights from this year’s survey
Participants
Eight carriers participated broadly in this survey. Four others provided sales information so we could report more accurate aggregate industry individual and multi-life sales.
We estimate our statistical distributions reflect about 75 percent of total industry policies sold (85 percent of premium) and about 15 percent of worksite policies sold (30 percent of premium). Total industry sales and total worksite sales (the denominators) include authors’ estimates of sales for three companies.
Our worksite statistical distributions can vary significantly from year-to-year because insurers focusing on particular worksite markets may be over- or under-represented. Our worksite statistical analysis is overly weighted toward executive carve-out programs. The carriers which provided 2020 statistical data had an average worksite annual premium of $4,218 whereas the insurers which did not provide statistical data had an average worksite premium of $1,634.
CalPERS, Northwestern and the six insurers displayed in the Product Exhibit provided broad statistical information. Auto-Owners, Country, LifeSecure, and Transamerica contributed total and worksite sales (new premium and lives insured) but did not provide other information. However, in a few places we were able to reflect some of their product designs in our statistical distributions. We estimate approximately $10 million of sales for those insurers which did not contribute their sales data.
Country Life, Genworth and CalPERS stopped selling stand-alone LTCI in 2020; however, Genworth has since resumed sales and CalPERS intends to resume sales. MassMutual and Transamerica discontinued selling stand-alone LTCI early in 2021 but Transamerica continued to accept new worksite applications until mid-year and may be experiencing last minute sales as a result.
Sales Summary
- After having reported an increase in new premiums in 2019 (for the first time since 2012), twelve insurers reported $139,562,096* in 2020 annualized new premium sales (including exercised FPOs) and 41,440 new policies, 9.7 percent less premium and 11.9 percent fewer policies than the same insurers sold in 2019. However, some insurers with limited 2020 activity did not report 2020 sales to us. Including estimated sales for those insurers we peg total stand-alone LTCI industry sales at about $150 million*, which is nearly 13 percent less than the 2019 sales of $171,634,536 (restated upward by nearly $900,000 from our report last year). As noted in the Market Perspective section, sales of policies combining life insurance with LTCI or Chronic Illness benefits dropped eight percent in the first half of 2020 and corresponding premium dropped 19 percent. *Single premium sales are counted at ten percent for the annualized premium calculations herein.
- Although we are not able to quantify the magnitude, the COVID-19 pandemic could have had a material impact on sales.
- Three insurers sold more new premium than in 2019.
- The pandemic may have had a greater impact on worksite sales. We estimate worksite new annualized LTCI premium dropped 15 percent in 2020 (18 percent fewer new sales).
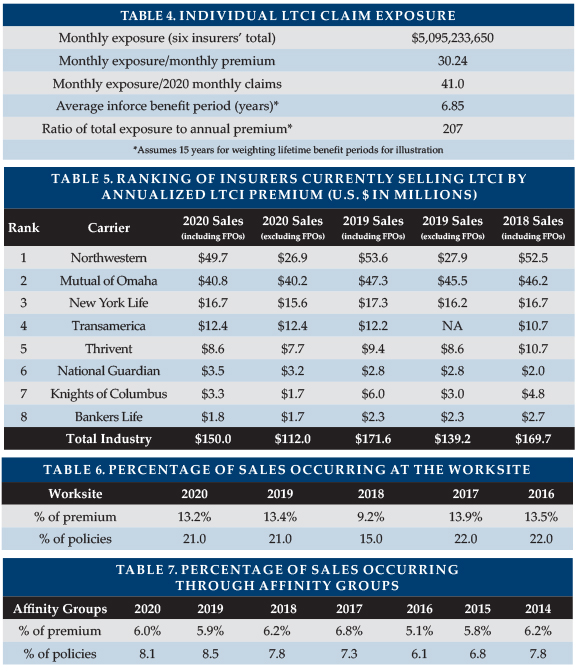
- With FPO elections included in new premium, Northwestern retained the number one spot in sales. Mutual of Omaha was a strong second and again had a large lead in annualized premium from new policies sold. Together, these two insurers combined for 60 percent of new premium including FPOs, compared to 59 percent last year.
The number of policies inforce increased each year through 2014 but has decreased each year since, decreasing 0.9 percent in 2020. However, inforce premium continued to increase (1.9 percent) despite fewer policies inforce and more policies in paid-up status. Inforce premium rises due to sales, price increases, and benefit increases (including FPOs), and reduces from lapses, reductions in coverage, deaths, and shifts to paid-up status for various reasons. A major carrier did not report inforce data, likely suppressing the percentage of inforce premium increase.
Collectively, the seven participants which reported claims saw claims increase only 1.6 percent in 2020, partly because two insurers reported a reduction in claims. The other five insurers experienced a 5.2 percent increase in claims in 2020. Overall, the stand-alone LTCI industry incurred $12.9 billion in claims in 2019 based on companies’ statutory annual filings, raising total incurred claims from 1991 through 2019 to $154.4 billion. (Note: 2019 was the most recent year available when this article was written.) Most of these claims were incurred by insurers that no longer sell LTCI. The reported 2019 incurred claims are 11.2 percent higher than the $11.6 billion of incurred claims reported in 2018.
The placement rate dropped from 59.2 percent in 2019 to 57.8 percent in 2020, which is also lower than the 59.0 percent and 58.8 percent placement rates in 2017 and 2018, respectively. Difficulty in collecting underwriting information during the pandemic may have contributed to lower placement rates. Table 23 shows that three-fourths of the reduction in placement rate can be attributed to suspended and withdrawn applications and Table 26 shows that underwriting averaged about 3 days longer. The longer average underwriting time was also likely caused by the pandemic. However, due to 2020 pending applications that will be reported in 2021, as well as the 2019 applications that were pending at the end of that year, some of our statistics such as underwriting processing time do not fully reflect the impact of the pandemic.
About the Survey
This article is arranged in the following sections:
Highlights provides a high-level view of results.
Market Perspective provides insights into the LTCI market.
Claims presents industry-level claims data.
Sales Statistical Analysis presents industry-level sales distributions reflecting data from 8 insurers.
Partnership Programs discusses the impact of the state partnerships for LTCI.
Available here at www.BrokerWorldMag.com:
- Product Exhibit shows, for 6 insurers: financial ratings, LTCI sales and inforce, and product details.
- Product Details, a row-by-row definition of the product exhibit entries, with some commentary.
- Premium Exhibit shows lifetime annual premiums for each insurer’s most common underwriting class, for issue ages 40, 50, 60, and 70 for single females, single males, and heterosexual couples (assuming both buy at the same age), based on $100 per day (or closest equivalent weekly or monthly) benefit, 90-day facility and most common home care elimination period, three-year and five-year benefit periods or $100,000 and $200,000 maximum lifetime buckets, with and without Shared Care and with flat benefits or automatic three or five percent annual compound benefit increases for life. Worksite premiums do not reflect any worksite-specific discount, though some carriers offer this.
- Premium Adjustments (from our Premium Exhibit prices) by underwriting class for each participant.
- Distribution by underwriting class for each participant
- State-by-state results: percentage of sales by state, average premium by state and percentage of policies qualifying for Partnership by state.
MARKET PERSPECTIVE (more detail in subsequent parts of the article)
“Both buy” and married discounts are reaching stable points. In the past year, some insurers lowered couples’ discounts significantly, to the 15 to 20 percent range. One-of-a-couple discounts are also dropping, to the zero to five percent range. The histories of these discounts are related.
When all LTCI had unisex prices, insurers’ single-person prices reflected that single buyers were predominantly female. Couples who bought policies were nearly 50 percent male; insurers did not have to charge them two prices weighted toward females, so they raised the couples’ discount. When the industry converted to gender-distinct pricing, the justification for couples’ discounts decreased substantially; however, large couples’ discounts continued to be common until now.
As an example, a single person price of $1,500 led to a couples’ combined price of $1,800 when couples’ discounts were 40 percent. If insurers took away the couples’ discount when one spouse was declined, consumers would be disappointed that the spouse about whom they were most concerned was declined, and the price for the healthy insured would be 5/6 of their combined price (5/7 if the discount was 30 percent). Fearing that the healthy spouse would refuse the policy, insurers typically cut the discount in half, rather than removing it completely. In the above example, the healthy spouse would have been charged $1,200 to $1,275, depending on whether the couples’ discount was 40 or 30 percent, respectively.
In the 2019 article “Is Your Spouse Contagious?,” Milliman analyzed the additional cost of LTC incurred by people whose spouses already had LTCI claims. As people who are LTC caregivers are likely to have worse LTCI claims experience than single people, a discount is inappropriate if the spouse is uninsurable. Of course, sometimes only one spouse buys even though both are healthy; for example, perhaps one spouse already has coverage. Nonetheless, their results make it hard to justify an across-the-board one-of-a-couple discount.
We summarized the “Is Your Spouse Contagious?” findings in our survey questionnaire, asking what the industry can do to lower claim costs after the claim or death of a spouse. The same five insurers responded to each question and their recommendations mostly cut across both situations. They cited proactive outreach to provide supportive services to help clients age in place, including preventive measures and care management, examples being home safety assessments and technology to monitor an insured’s health if they live alone. Following the death of a spouse, one carrier suggested informal care options with low daily limits which would permit relatives to be paid caregivers and another suggested a new plan of care, answers that seemed to anticipate that the survivor was already on claim. There were some concerns, however, with one insurer indicating that “cost will be a barrier” and another commenting “if appropriate”.
When one spouse is on claim, two insurers suggested offering respite care options to support the non-claim spouse.
Some specific steps the respondents may have had in mind in their general comments include brain fitness training; helping the healthy spouse marshal and manage resources to help the care recipient; access to cognitive tests that provide early detection of cognitive slippage; lifestyle suggestions including diet and sources of prepared meals; home modification projects; document organization; end-of-life planning; tele-medicine; information to access available government benefits and local services; help in finding and evaluating potential commercial caregivers; products and information about reducing risk and/or facilitating improved caregiving; etc.
We noted that the 10-year Treasury yield as of January 1, 2021 was 0.93 percent and asked what insurers projected it would be in 5 and 10 years. The range in five years was scattered between 1.5 to 3.0 percent and in ten years was two to three percent, with four of the five answers being 2.9 to 3.0 percent. Although all envisioned rising interest rates, only two mentioned that it would ease pressure on profit margins.
The June issue of Broker World magazine had an article about the impact of the pandemic which included data from this survey. Rather than repeat that data here, we refer readers to the June issue.
Government-provided LTCI programs continue to be a topic of discussion.
The Affordable Care Act (2010) included a LTCI program (the “CLASS” Act). Criticisms of the design were validated when, after passage of the ACA, the government dropped the LTCI program because it could not find a way to make it work.
Since then, there have been state efforts to create LTCI programs. On January 1, 2022, the Washington Long-Term Care Trust (WLTCT) will begin collecting 0.58 percent payroll tax to fund a $36,500 lifetime pool of money starting in 2025 (the pool of money is intended to inflate according to the Washington consumer price index). The program provides coverage for vested individuals receiving care in the state of WA. Government-provided LTCI programs will be watched closely for their potential impact on LTCI sales.
Since 2009 (varies by jurisdiction), if an insurer concludes that a claimant is not chronically ill, the insurer must inform the claimant of his/her right to appeal the decision to independent third-party review (IR), which is binding on insurers. As shown in our Product Exhibit, most participants have extended IR beyond statutory requirements, most commonly to policies issued prior to the effective date of IR. It is hard to get data relative to IR. Regulators in some states have not set up the required panel of independent reviewers and regulators do not collect IR statistics. Insurers often do not track IR. It is complimentary of the industry’s claims processing that there has not been a clamor for IR; that there have been significantly fewer requests in the past two years; and that insurers have consistently been completely upheld 70 percent or more of the time based on data we have received over the years from insurers and from Steve LaPierre, President of LTCI Independent Eligibility Review Specialists, LLC (LTCIIERS). In other cases, the reviewer might agree with the insurer partly (e.g., that the claimant did not satisfy the triggers initially, while concluding that the claimant satisfied the triggers later).
Current prices are more stable than past prices, partly because today’s prices reflect much more conservative assumptions based on far more credible data and lower assumed investment yields. Three participants have never increased premiums on policies issued under “rate stabilization” laws. The others reported no increases on policies issued since 2015, 2014 (2 insurers), and 2013 (2 insurers). Nonetheless, many financial advisors presume new policies will face steep price increases, and hence may be reluctant to encourage clients to consider LTCI.
As shown in Table 23, the placement rate for the past 8 years has remained at about 60 percent. Improving the placement rate is critical to encourage financial advisors to mention LTCI to clients. The industry may be able to improve placement rates as follows.
- Utilize E-applications for faster submission and reduced processing time, thereby increasing placement.
- Pre-qualify an applicant’s health. Effectively and efficiently increasing the percentage of applicants who are pre-qualified will decrease declines.
- More effective education of distributors by insurers, such as drill-down questions in on-line underwriting guides and eApps.
- Require cash with the application (CWA). CWA led to about five percent more of the apps being placed according to our 2019 survey.
- Continue to improve messaging regarding the value of LTCI and of buying now (rather than in the future). Such messaging would increase the number of applications and improve the placement rate by attracting younger and healthier applicants.
Once again, more than 80 percent of our participants’ policyholders exercised their FPOs (future purchase option, a guarantee that, under specified conditions, a policyholder can purchase additional coverage without demonstrating good health). As both the additional coverage and unit price increase over time, FPOs become increasingly expensive, even more so with the price increases that the industry has experienced. The high election rate demonstrates the importance of LTCI to policyholders and the effectiveness of annual (as opposed to triennial) negative-election FPOs. (Negative-election FPOs activate automatically unless the client rejects them, as opposed to positive-election FPOs which activate only if the client makes a request.) At least in some markets and with some designs, policyholders reliably exercise FPOs when they must do so to continue to receive future offers. Considering such FPOs and other provisions, we project a maximum benefit at age 80 of $305/day for an average 58-year-old purchaser in 2020, which is equivalent to an average 2.9 percent compounded benefit increase between 2020 and 2042. Purchasers may be disappointed if the purchasing power of their LTCI policies deteriorates over time.
Linked benefit products are attractive because even if the insured has no LTC claim, their family will receive benefits and because they often have guaranteed premiums and benefits. According to LIMRA, 516,809 stand-alone LTCI and combination (life and LTCI and life and Chronic Illness) policies were sold in 2019 and were distributed as follows, with stand-alone LTCI’s 11 percent market share the same as 2018. (ADB= “Accelerated Death Benefit)
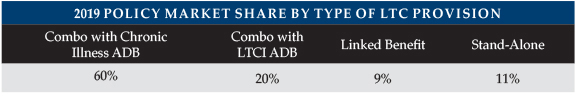
The stand-alone column and the linked-benefit column are both much more significant in terms of LTC protection than indicated above, for the following reasons:
- The Accelerated Death Benefit (ADB) provisions do not increase over time. By the time the average claim payment is made, the stand-alone policies’ maximum monthly benefit (on plans with benefit increase features) will have risen significantly. The linked-benefit portion would also have increased significantly.
- The stand-alone and linked-benefit policies have significantly lower lapse rates than the policies with ADB. Thus, they are much more likely to be around when care is needed.
- The stand-alone and linked-benefit policies may have lower mortality rates because of their better persistency and because they are purchased with LTCI in mind whereas the ADB policies are generally purchased for their life insurance and the ADB benefit may be incidental in the minds of the buyers.
- The ADB policies are less likely to be used to pay for care, as it may be preferable to have the death benefit be paid to the beneficiary.
A small offset is that the stand-alone policies are more likely to be reimbursement-based benefits, which are less likely to result in the full benefit being paid each month.
According to LIMRA, in the first half of 2019, combination life sales dropped slightly, but then rebounded strongly in the latter half of the year to finish ten percent higher than 2018 in terms of premium (although, one percent lower in terms of the numbers of policies). However, in the first half of 2020 (the most recent data available as this article was being written), premiums were 19 percent lower and new policies eight percent lower than the weak first half of 2019. In addition to the pandemic, LIMRA noted that the new 2017 CSO Mortality Table and low interest rates led to higher premiums which depressed sales. The policies with the most significant LTCI benefits (linked benefits) dropped the most (27 percent in premium; 21 percent in policy count).
Only four participants offer coverage in all U.S. jurisdictions; no worksite insurer does so. Insurers are reluctant to sell in jurisdictions which have unfavorable legislation or regulations, restrict rate increases, or are slow to approve new products.
All but one of our participants use third party administrators (TPAs) and five of the eight participants use reinsurers. The number of insurers using TPAs for the following functions is shown in parentheses: Underwriting (6), Issue (5), Billing (5), Commissions (3), and Claims (6). Two insurers noted they use their underwriting and claims TPAs for only some functions and another, which responded that it does not use TPAs for underwriting and claims, noted that it sometimes receives help from its TPA, but the TPA never makes the decision. We thank CHCS, DMS, LifeCare Assurance, Long-Term Care Group, RGA, and Wilton Re for their contributions to the LTCI industry. Other reinsurers and TPAs may support insurers not in our survey. In some cases, affiliated companies provide reinsurance or guarantees.
CLAIMS
- Seven participants reported 2020 claims. As some companies are not able to provide detailed data, some statistics are more robust than others.
- The insurers’ combined claim payments on individual policies rose 1.6 percent in 2020 over 2019. Two insurers reported a decrease in claims, while the other five insurers reported a 5.2 percent increase.
- The LTCI industry has had a much bigger impact than indicated above, because a lot of claims are paid by insurers that do not currently sell LTCI or did not submit claims data to us.
LTCI claims paid by insurers no longer selling LTCI may differ significantly from the following statistics as their claimants are more likely to have facility-only coverage, be older, etc.
Table 1 shows the total dollar and number of reported individual and multi-life (not group) LTCI claims. It reflects the same carriers for both years. As noted above, total claims rose only 1.6 percent. The impact of the pandemic is not clear in the data, but some claimants likely died prematurely and/or spurned facility care, particularly nursing home care. Some claimants likely abandoned facilities, thereby losing coverage either because they did not hire commercial home caregivers or because they had a facility-only policy and did not qualify for exemptions that some insurers provided. Claimants and commercial caregivers potentially were hesitant to meet during a large part of the year, likely dampening home care claims.
Table 2 shows the distribution of those claims by venue, which have shifted away from nursing homes over the years (except in 2019) due to consumer preferences and more claims coming from comprehensive policies. The distribution reflects different insurers from year-to-year; 2019’s aberration was caused by the absence of data from an insurer which resumed providing data this year.
The inception-to-date number of claims is surprisingly more weighted to Nursing Home than the dollar of claims. It seems that nursing home claims come from older policies with lower maximum daily benefits.
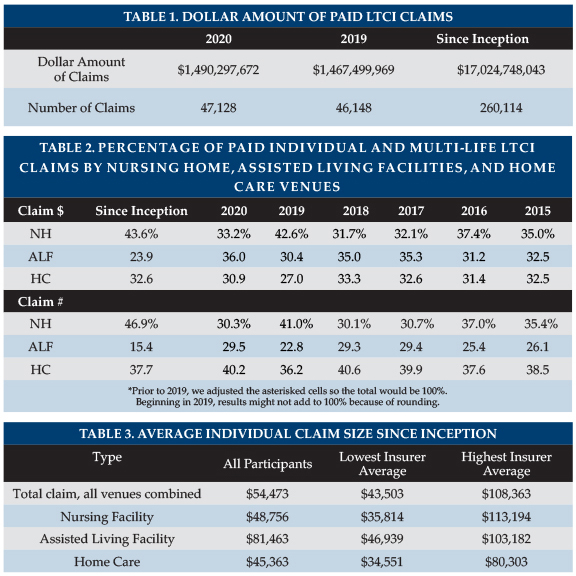
In the distribution based on number of claims, a person who received care in more than one venue is counted once for each venue, but not double-counted in the total line.
Six carriers reported their number of open individual claims at year-end, ranging between 51 and 81 percent of the number of claims paid during the year, averaging 64 percent overall.
Table 3 shows average size individual claims since inception. Because 41 percent of claimants since inception have submitted claims from more than one type of venue, the average total claim might be expected to exceed the average claim paid for any particular venue. However, individual Assisted Living Facility (ALF) claims stand out as high each year, probably because:
- ALF claims appear to have a longer duration compared with other venues.
- Nursing home costs are most likely to exceed the policy daily/monthly maximum, hence nursing home claims are most likely to understate the cost of care.
- People who maximize the use of their maximum monthly benefits can generally spend as much in an ALF as in a nursing home.
- Although some surveys report that ALFs cost about half as much as nursing homes on average, ALFs often charge more for a memory unit or for levels of assistance that align more closely with nursing home care. Upscale ALFs seem to cost a higher percentage of upscale nursing home costs than the average ALF/nursing home ratio.
Several insurers extend ALF coverage to policies which originally did not include ALF coverage, providing policyholders with significant flexibility at time of claim, but contributing to the insurers’ need for rate increases.
The following factors contribute to a large range of average claim results by insurer (see Table 3), which results in significant year-to-year differences in Table 3 because different insurers contribute data:
- Different markets (by affluence; worksite vs. individual; geography; etc.)
- Demographic differences (distribution by gender and age)
- Distribution by benefit period, benefit increase feature, shared care and elimination period.
- Distribution by facility-only policies vs. 50 percent home care vs. 100 percent home care vs. home care only, etc.
- Different lengths of time in the business.
The following factors cause our average claim sizes to be understated.
- For insurers reporting claims this year, nine percent of inception-to-date individual claims are still open. Our data does not include reserve estimates for future payments on open claims.
- People who recover, then claim again, are counted as multiple insureds, rather than adding their various claims together.
Besides being understated, average claim data does not reflect the value of LTCI from some purchasers’ perspectives, because the many small claims drive down the average claim. LTCI can provide significant financial return for people who need care one year or longer. A primary purpose of insurance is to protect against adverse results, so the amount of protection, as well as average claim, is important.
Five insurers provided their current individual (excludes group) monthly LTCI claim exposure, which exceeds $5 billion (note: reflects only initial monthly maximum for one insurer). As shown in Table 4, this figure is thirty times their corresponding monthly LTCI premium income and more than 41 times their 2020 LTCI monthly paid claims. Eight insurers contributed data regarding their inforce distribution by benefit period. Treating endless (lifetime benefit periods) as a 15-year benefit period, we found that their average inforce benefit period is 6.85 years. Changing the assigned value of the endless benefit period by one year has an impact of approximately 0.25 years on the average inforce benefit period. With annual exposure thirty times annual premium and assuming an average benefit period of about 6.85 years, we estimate that total exposure is 207 times annual premium.
Three insurers reported their current average individual maximum monthly maximum benefit for claimants, with results ranging from $4,121 to $6,729.
Nursing home (NH) claims are more likely to use the policy’s maximum daily/monthly benefit than ALF claims, because ALF daily/monthly costs are generally lower and because policies sometimes have lower maximums for ALFs. ALF claims correspondingly are more likely to use the policy maximum than are adult day care and home care claims.
STATISTICAL ANALYSIS
Bankers Life, CalPERS, Knights of Columbus, Mutual of Omaha, National Guardian, New York Life, Northwestern and Thrivent contributed significant background data, but some were unable to contribute some data. Four other insurers (Auto-Owners, Country, LifeSecure and Transamerica) contributed their number of policies sold and new annualized premium, distinguishing worksite from other sales, but not clarifying whether FPOs were included in the premium.
Sales characteristics vary significantly among insurers based on market differences (individual vs. worksite, affluence, gender distribution, etc.). Year-to-year variations in policy feature distributions may reflect industry trends but may also reflect changes in participants, participant practices and designs, participant or worksite market shares, etc. The statistical differences between the worksite and non-worksite sales will be reported in the August issue of Broker World.
Market Share
Because new coverage is being issued, we include purchased increases on existing policies in new premium (we call them FPOs and include board-approved increase offers). FPOs increased in 2020, cushioning the reduction in premium from new sales. Removing FPOs spotlights insurers with more new policy sales. Table 5 lists the top 8 participants in 2020 new premium including FPOs and without FPOs. Northwestern ranks #1 including FPOs, with Northwestern and Mutual of Omaha accounting for 60 percent of the market. Ignoring FPOs, Mutual of Omaha is #1. The premium includes 100 percent of recurring premiums plus ten percent of single premiums.
Worksite Market Share
After a strong 2019, worksite premium dropped about 15 percent in 2020, accounting for a lower percentage of total sales than in 2019. It is possible that the worksite market could have produced a bigger percentage of total sales than in 2019 had the pandemic not occurred. However, with Transamerica leaving the market and other changes, the future of the worksite LTCI market (except executive carveout) is unpredictable. LifeSecure, Mutual of Omaha, and National Guardian may pick up market share; linked-benefit worksite products might pick up market share; and/or LTC risk covered in the worksite might drop.
Worksite sales consist of three different markets, the first two of which produce a higher percentage of new insureds than of new premiums:
- Voluntary group coverage generally is less robust than individual coverage.
- Core/Buy-Up programs have particularly young age distributions and modest coverage because a lot of people do not buy-up and are less likely to insure spouses.
- Executive carve-out programs generally provide the most robust coverage. One- or two-couple executive carve-out sales may not qualify for a multi-life discount with some insurers, hence may not be labeled as worksite sales in submissions to our survey.
The amount of worksite sales reported and its distribution among the three sub-markets significantly impact product feature sales distributions. Table 6 is indicative of the full market (including our estimates for two insurers which did not report sales), but this year’s policy feature distributions significantly underweight the voluntary and core/buy-up markets, as most of those markets are not reflected in our statistical data. More information about worksite sales will appear in the August issue of Broker World magazine.
Affinity Market Share
Affinity groups (non-employers such as associations) produced 8.1 percent of new insureds (see Table 7), and 6.0 percent of new business premium. Less than 20 percent of the lower affinity average premium is attributable to the affinity discount. The balance may be due to younger issue age or less robust coverage. It would seem that, over time, an increasing number of associations would have discounts, which might cause the affinity group percentage to increase over time, but our data does not demonstrate such a pattern.
Characteristics of Policies Sold
Average Premium Per Sale
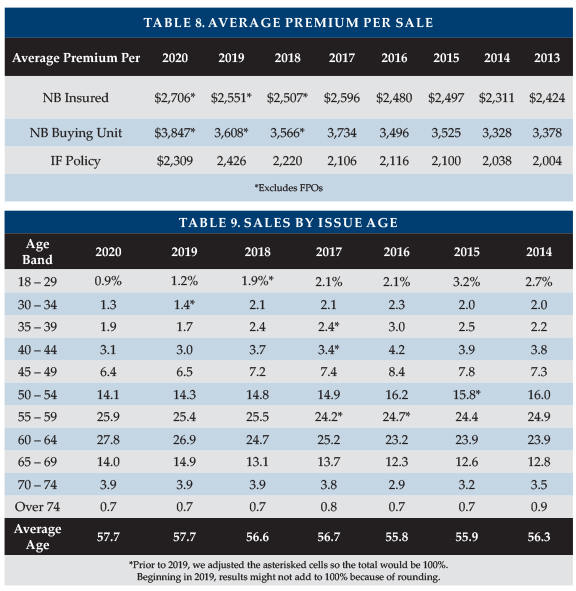
The average new business (NB) premium per insured (Table 8), subtracting FPOs for the insurers that reported statistics, and the average premium per buying unit (a couple comprise a single buying unit) increased six to seven percent each to $2,706 and $3,847, respectively.
Data for 2018 and earlier years included FPOs in these calculations, overstating the average premium per new insured and buying unit.
Average premium per new policy ranged from $1,029 to $3,792 among the 12 insurers.
The lowest average new premium (including FPOs) was in Puerto Rico ($2,511), followed by Indiana ($2,642) and Kansas ($2,915), while the highest was in the District of Columbia ($5,336), followed by Connecticut ($4,820), and New York ($4,656).
For those insurers which reported results for 2019 and 2020, the average inforce premium (reflecting rate increases, FPO elections and termination of older policies) increased from $2,246 to $2,309, a 2.8 percent increase. However, Table 8 shows a decrease due to a change in insurers reporting inforce premium.
Issue Age
Table 9 summarizes the distribution of sales by issue age band based on insured count. The average issue age remained 57.7. All insurers reported an average issue age between 55 and 60. The age distributions for 2016 and earlier had more worksite participants than recent years. Note: one survey participant has a minimum issue age of 40, one will not issue below 30, and one will not issue below 25.
Benefit Period
Table 10 summarizes the distribution of sales by benefit period. For the first time since 2014, endless benefit periods registered a measurable percentage, albeit only 0.2 percent. The average benefit period for limited benefit period policies dropped back to 3.75, but if we treat endless benefit periods as 15 years, the average benefit period was 3.82. Because of Shared Care benefits, total coverage was higher than the 3.75 average suggests. Three-year benefit periods accounted for 52.9 percent of the sales.
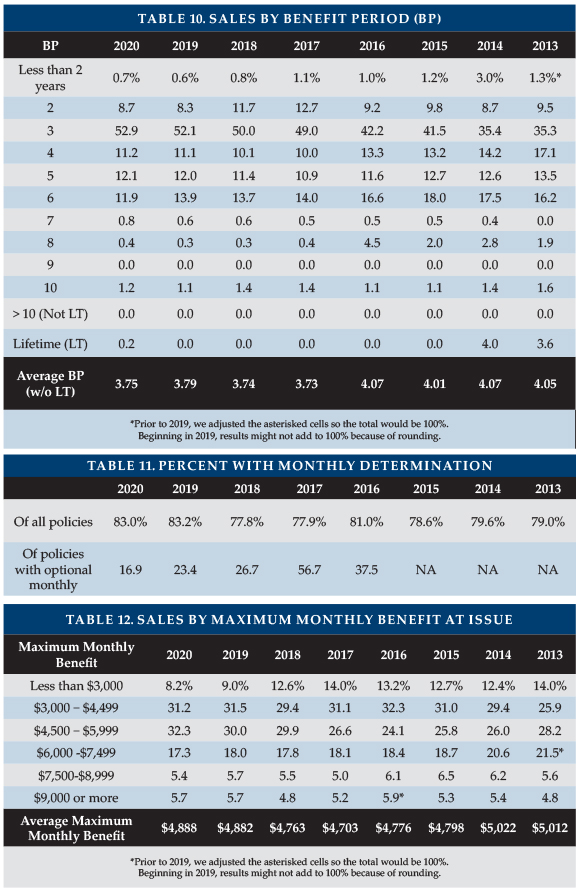
Monthly Benefit
Monthly determination applied to a record 83.0 percent of 2020 policies (Table 11). With monthly determination, low-expense days leave more benefits to cover high-expense days. One insurer offers only daily determination; one insurer offers a choice; and the other insurers automatically have monthly determination.
Table 12 shows the largest concentration ever in the $4,500-$5,999 initial monthly maximum range (32.3 percent). The average maximum monthly benefit increased slightly to $4,888.
Benefit Increase Features
Table 13 summarizes the distribution of sales by benefit increase feature. Most notably, only 14.6 percent of the policies were sold without a benefit increase feature.
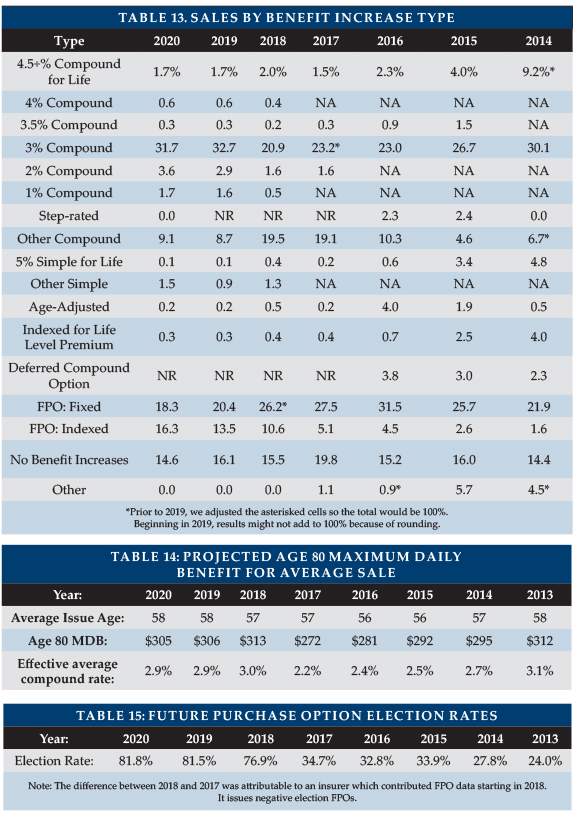
“Indexed Level Premium” policies are priced to have a level premium, but the benefit increase is tied to an index such as the consumer price index (CPI).
As shown in Table 14, we project the age 80 maximum daily benefit by increasing the average initial daily benefit from the average issue age to age 80, according to the distribution of benefit increase features, using current future purchase option (FPO) election rates and a five percent/year offer for fixed FPOs. The maximum benefit at age 80 (in 2042) for our 2020 average 58-year-old purchaser projects to $305/day (equivalent to 2.9 percent compounding). Had our average buyer bought an average 2019 policy a year ago at age 57, her/his age 80 benefit would be $316/day (equivalent to 2.9 percent compounding). Most policyholders seem likely to experience eroding purchasing power over time if cost of care trends exceed three percent.
FPOs are important to insureds in order to maintain purchasing power, and 82 percent of our participants’ 2019 to 2020 FPOs were exercised. The high election rate is noteworthy, considering that the cost increases each year due to larger coverage increases each year, increasing unit prices due to age, and additional price increases due to rate increases.
One insurer had an election rate of 91 percent, two insurers had 68 to 70 percent, two insurers had 43 to 45 percent, and one insurer had 19 percent. It seems clear that higher election rates occur if FPOs are more frequent (every year vs. every 3 years) and are “negative-election” (activate automatically unless the client rejects them) as opposed to “positive-election” (which activate only if the client makes a request). At least some blocks of business demonstrate that policyholders will exercise FPOs if they must do so to continue to receive future offers.
FPOs are also important to insurers, accounting for at least 22 percent of new premium in 2020. Two insurers had nearly half their new premium come from FPOs.
Elimination Period
Table 16 summarizes the distribution of sales by facility elimination period (EP). Ninety-two percent (92 percent) of buyers opt for elimination periods between 84 and 100 days. The percentage of EPs of 100 days or more was 5.2 percent, lower than any other year in the table.

Table 17 shows the percentage of policies with zero-day home care elimination period (but a longer facility elimination period). For insurers offering an additional-cost zero-day home care EP option, the purchase rate is sensitive to the cost.
Table 17 also shows the percentage of policies with a calendar-day EP. It is important to understand that most calendar-day EP provisions do not start counting until a paid-service day has occurred.
Sales to Couples and Gender Distribution
Table 18 summarizes the distribution of sales by gender and single/couple status.
In 2012, the last year in which all sales were unisex, 54.9 percent of buyers were female. In 2013, the female percentage spiked to 57.2 percent as females purchased unisex pricing that was still available. Since unisex pricing has disappeared entirely except in the worksite, the female percentage has plateaued at slightly above 54 percent. The percentage of females varies significantly based on an insurer’s markets. This year, the percentage of females varied from 45 to 63.9 percent among insurers.
The percentage of accepted applicants who purchase coverage when their partners are declined also varies significantly by insurer based on their couples’ pricing and their distribution system. Few insurers are able to report this data.
Shared Care and Other Couples’ Features
Table 19 summarizes sales of Shared Care and other couples’ features.
- Shared care allows one spouse/partner to use the other’s available benefits if their own coverage has been depleted or offers a third independent pool that the couple can share.
- Survivorship waives a survivor’s premium after the first death if specified conditions are met.
- Joint waiver of premium (WP) waives both insureds’ premiums if either qualifies for benefits.
Changes in distribution between carriers can greatly impact year-to-year comparisons in Table 19, because some insurers embed survivorship or joint waiver automatically (sometimes only in some circumstances) while others offer it for an extra premium or do not offer the feature.
In the top half of Table 19, percentages are based on the number of policies sold to couples who both buy (only limited benefit, for Shared Care). The bottom half of Table 19 shows the (higher) percentage that results from dividing by sales of insurers that offer the feature. For insurers reporting Shared Care sales, the percentage of both-buying couples who opted for Shared Care varied from 8 to 89.7 percent. The corresponding percentage of couples with Joint WP varied from 10 to 100 percent and for Survivorship ranged from 2.1 to 14.1 percent.
Table 20 provides additional breakdown on the characteristics of Shared Care sales. As shown on the right-hand side of Table 20, two- to four-year benefit period policies are most likely (26 to 31 percent) to add Shared Care. Partly because three-year benefit periods comprise 53 percent of sales, most policies with Shared Care (61 percent) have three-year benefit periods, as shown on the left side of Table 20.
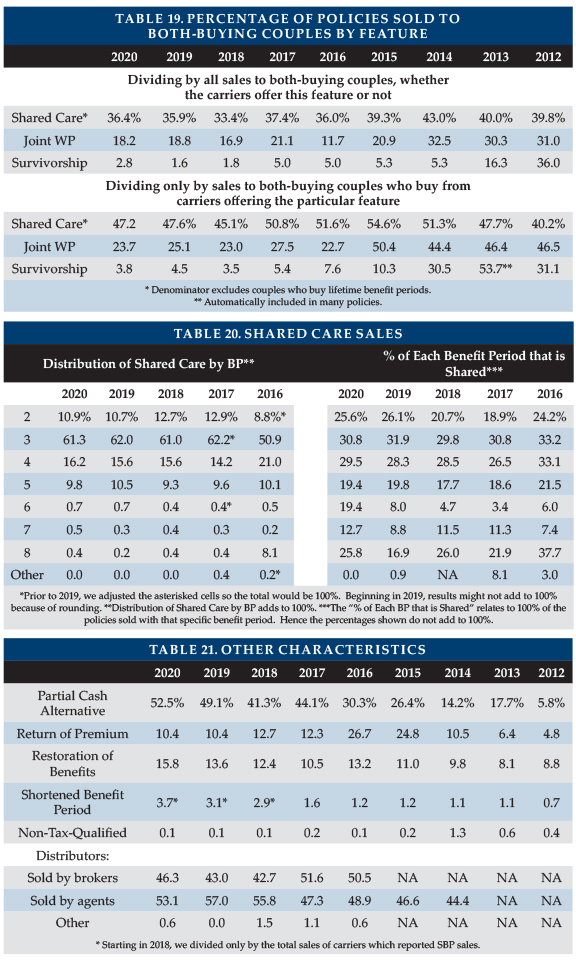
Above, we stated that Shared Care is selected by 36.4 percent of couples who both buy limited benefit period policies. However, Table 20 shows Shared Care comprised no more than 31 percent of any benefit period. Table 20 has lower percentages because Table 19 denominators are limited to people who buy with their spouse/partner whereas Table 20 denominators include all buyers.
Shared Care is more concentrated in two- to four-year benefit periods (88.4 percent of shared sales) than are all sales (73.0 percent). Couples are more likely to buy short benefit periods because couples plan to help provide care to each other and Shared Care makes shorter benefit periods more acceptable. Single buyers are more likely to be female, hence opt for a longer benefit period.
Existence and Type of Home Care Coverage
Four participants reported sales of facility-only policies, which accounted for 0.7 percent of total sales. One insurer was responsible for more than 80 percent of such sales. Ninety-six percent (96.4 percent) of the comprehensive policies included home care benefits at least equal to the facility benefit. No participant has reported home-care-only sales since 2018.
Other Characteristics
As shown in Table 21, partial cash alternative features (which allow claimants, in lieu of any other benefit that month, to use between 10 and 40 percent of their benefits for whatever purpose they wish) were included in 52.5 percent of sales, including non-participant sales.
Return of premium (ROP) features were included in 10.4 percent of policies. ROP returns some or all premiums (usually reduced by paid LTCI benefits) when a policyholder dies. Approximately 75 percent of ROP features were embedded automatically in the product. Embedded features are designed to raise premiums minimally, typically decreasing the ROP benefit to $0 by age 75.
Nearly sixteen percent (15.8 percent) of policies with limited benefit periods included a restoration of benefits (ROB) provision, which typically restores used benefits when the insured has not needed services for at least six months. Approximately 90 percent of ROB features were automatically embedded.
Insurers must offer shortened benefit period (SBP) coverage, which makes limited future LTCI benefits available to people who stop paying premiums after three or more years. The insurers able to report SBP sales, sold SBP to 3.7 percent of buyers.
Only one insurer issued non-tax-qualified (NTQ) policies, which accounted for 0.1 percent of industry sales.
“Captive” (dedicated to one insurer) agents produced 53.1 percent of the coverages. Brokers produced 46.3 percent and a direct-to-consumer carrier accounted for 0.6 percent. At one time, “captive” agents who sold LTCI tended to specialize in LTCI. Now many are agents of mutual companies.
Sales distribution by jurisdiction is posted on the Broker World website.
Limited Pay and Paid-Up Policies
In 2020, two insurers sold policies that become paid-up in 10 years or less, accounting for 1.1 percent of sales, the highest percentage since 2014, as shown in Table 22.
Because today’s prices are more stable, premium increases are less likely. One of the key reasons for buying 10-year-pay (avoidance of rate increases after the 10th year) is greatly reduced, while the cost of 10-year-pay has increased, making it less attractive than in the past. Nonetheless, limited-pay and single-pay policies are attractive to minimize post-retirement outflow and to accommodate §1035 exchanges.
Seven participants reported that 3.0 percent of their inforce policies are paid-up, a lower percentage than last year because an additional insurer participated.
PARTNERSHIP PROGRAM BACKGROUND
When someone applies to Medicaid for long-term care services, most states with Partnership programs disregard assets up to the amount of benefits received from a Partnership-qualified policy (some Indiana and New York policies disregard all assets). Except for California, states with Partnership programs grant reciprocity to Partnership policies issued in other jurisdictions. Partnership programs are approved in 44 jurisdictions, all but AK, DC, HI, MA, MS, UT, and VT, but MA has a similar program (MassHealth).
Four states (CA, CT, IN and NY) blazed the trail, legislating variations of the Robert Woods Johnson approach (“RWJ” states), whereas “DRA” states use simpler, more consistent rules developed later, in the Deficit Reduction Act of 2005. For example, RWJ states require a separate Partnership policy form, generally still have more stringent benefit increase requirements and sometimes assess a fee for insurers to participate (none of which apply in DRA states).
Approximately 60 percent of Partnership states now allow one percent compounding to qualify for Partnership, which can help low-budget buyers qualify for Partnership and also enables worksite core programs to be Partnership-qualified. A higher percentage of policies would qualify for Partnership in the future if insurers and advisors leverage these opportunities. However, currently only three insurers offer one percent compounding.
Partnership programs could be more successful if:
- Advisors offer small maximum monthly benefits more frequently to the middle class. For example, a $1,500 initial maximum monthly benefit covers about four hours of home care every two days and, with compound benefit increases, may maintain buying power. Many middle-class individuals would like LTCI to help them stay at home while not “burning out” family caregivers and could be motivated further by Partnership asset disregard. (This approach does not work in RWJ states with high Partnership minimum daily benefit requirements.)
- Middle-class prospects were better educated about the importance of benefit increases to maintain LTCI purchasing power and to qualify for Partnership asset disregard.
- The four original Partnership states migrate to DRA rules.
- More jurisdictions adopt Partnership programs.
- Programs that privately finance direct mail educational LTCI content from public agencies were adopted more broadly.
- Financial advisors were to press reluctant insurers to certify their products and offer one percent compounding.
- More financial advisors were certified. Some people argue that certification requirements should be loosened. At a minimum, the renewal certification process could be improved.
- Linked benefit products became Partnership-qualified.
PARTNERSHIP PROGRAM SALES
Participants reported Partnership sales in all 44 authorized states except CT and NY. No participant sold Partnership policies in more than 41 states in 2020. Two had Partnership sales in 38 states, three in 29 to 34 states, one in 1 state, and the other has chosen not to certify Partnership conformance.
Insurance brokers do not have access to Partnership policies in CA, CT and NY and from only one insurer in IN. However, in some of those states, consumers can purchase Partnership-qualified coverage from one or two other entities.
In the DRA states, 55 percent of policies qualified for Partnership status. Minnesota (81.4 percent) leads each year. Georgia, Maine and Wisconsin were also above 70 percent.
The original RWJ states had few Partnership sales. In New Mexico, a recent Partnership state, only 4.7 percent of sales qualified, which should increase in the future. Kentucky had only 25.2 percent.
UNDERWRITING DATA
Case Disposition
Seven insurers contributed application case disposition data to Table 23. In 2020, 57.8 percent of applications were placed, the lowest ever, seemingly impacted by the pandemic. One insurer reported a 76.4 percent placement rate; all others were below the average, with three insurers between 40 and 47 percent.

Decline rates and suspended/withdrawn rates hit records. While we thought the suspended/withdrawn rate would rise with the pandemic, of the six insurers who have reported such data for both 2019 and 2020, two had a noticeably lower suspended/withdrawn rate in 2020 and two were +/-0.1 percent.
Decline rate by carrier varied from 11.9 to 38.4 percent, but all but two insurers were between 23.2 and 29.1 percent, varying based on factors such as age distribution, distribution system, market, underwriting requirements, and underwriting standards. Our placed percentages reflect the insurers’ perspective. A higher percentage of applicants secures coverage because applicants denied by one carrier may be issued either stand-alone or combo coverage by another carrier or may receive coverage with the same insurer after a deferral period.
Table 24 shows that, compared to 2019, the placement rate increased below age 60 and decreased above age 60, which seems consistent with a theory that the lower placement rate was related to the pandemic. This data is a subset of the placement data in Table 23.
Low placement rates increase insurers’ cost per placed policy. More importantly, low placement rates discourage advisors from discussing LTCI with clients. In addition to not wanting to waste time and effort, advisors fear that declined clients will be dissatisfied. In the Market Perspective section, we listed ways to improve placement rates. This is a critical issue for the industry. If readers have suggestions, they are invited to contact the authors.
Underwriting Tools
Six insurers contributed data to Table 25, which divides the number of uses of each underwriting tool by the number of applications processed. For example, the number of medical records was 82 percent of the number of applications. That does not mean that 82 percent of the applications involved medical records, because some applications resulted in more than one set of medical records being requested.
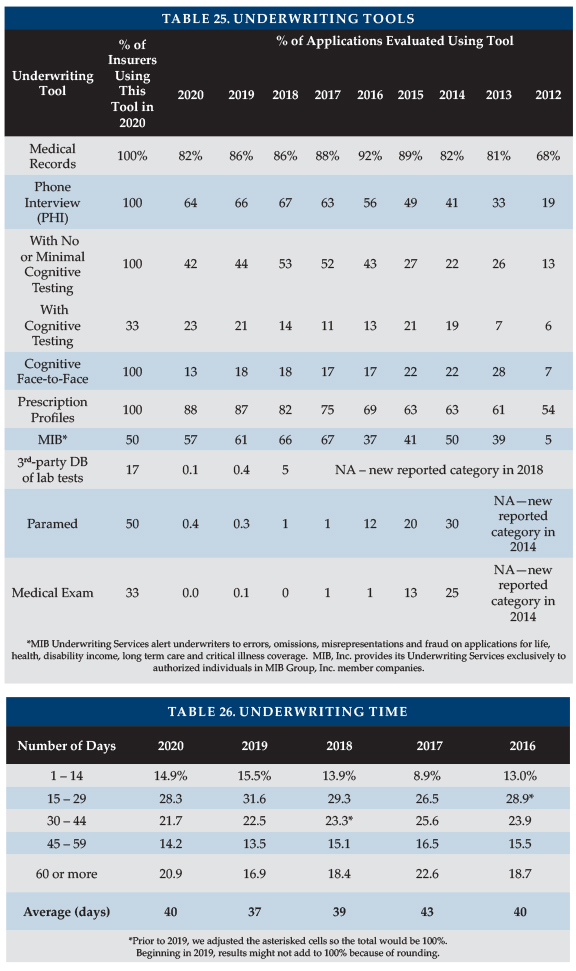
Insurers are trying to speed underwriting to increase placement rates. In the worksite market, insurers are less likely to use some of these tools.
Year-to-year changes in distribution of sales among insurers significantly impact results. Lower maximum ages result in fewer face-to-face exams. Insurers might underreport the use of an underwriting tool because they may lack a good source for that statistic. For example, an insurer might not be able to split phone interviews by whether or not they include cognitive testing.
The biggest change was the drop in Face-to-Face assessments, perhaps because it was hard to schedule them due to the pandemic.
Underwriting Time
Table 26 shows the average processing from receipt of application to mailing the policy time (40 days) reversed the trend of speedier processing. Of the six insurers that reported this data in both 2019 and 2020, the three fastest processors of 2019 all got faster and the three slower processors of 2019 all got slower, expanding the range from 28.9-60.3 to 26.9-65.9.
Rating Classification
Table 27 shows that a lower percentage of policies was issued in the most favorable rating classification, but the highest percentage was placed in the two most favorable classes since 2012. That’s surprising because prior to 2016, we had more worksite business in the rating classification table. For more information, look for the August issue of Broker World magazine where we will separate data by worksite vs. non-worksite business.
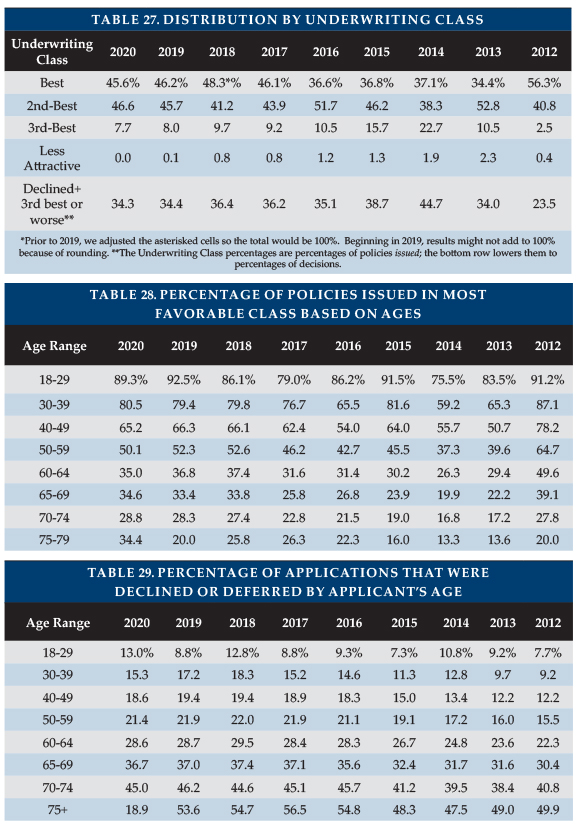
Only 7.7 percent of policies were issued beyond the second-best classification, but three insurers placed 11.0 to 12.4 percent of policies in such a class and another insurer placed 19.2 percent of policies in such a class.
Two insurers placed more than 80 percent of their applicants in the best underwriting class. The other five insurers placed 19 to 25 percent in their best class.
Lastly, Table 27 shows the percentage of decisions which were either declined or placed in the 3rd or less-attractive classification is reducing. Hence, we conclude that industry is making more favorable decisions rather than declining applicants in lieu of giving them a substandard rating,
Tables 28 and 29 show the 2020 percentages of policies issued in the most favorable category and decline decisions by issue age. Tables 27 and 28 do not exactly match Table 26 because some participants provide all-age rating or decline data. The percentage placed in the most favorable classification increased for ages 65 and older, likely statistical fluctuation. Although overall decline rates increased, the by-age decline rates decreased, except for under age 30; that anomaly results because only some insurers can provide decline data by issue age.
CLOSING
We thank insurance company staff for submitting the data and responding to questions promptly. We also thank Sophia Fosdick, Margaret Liang, Nicole Gaspar, and Alex Geanous of Milliman for managing the data expertly.
We reviewed data for reasonableness and insurers reviewed their product exhibit displays. Nonetheless, we cannot assure that all data is accurate.
If you have suggestions for improving this survey (including new entrants in the market), please contact one of the authors.
Reference:
Society of Actuaries (November 2016). Long-Term Care Insurance: The SOA Pricing Project. Retrieved May 16, 2020, from https://www.soa.org/globalassets/assets/files/static-pages/sections/long-term-care/ltc-pricing-project.pdf (PDF).