Chris Giese, FSA, MAAA, is a principal and consulting actuary in the Milwaukee office of Milliman, Inc.
He can be reached at 17335 Golf Parkway, Suite 100 Brookfield, WI 53045. Telephone: 262-796-3407. Email: chris.giese@milliman.com.
The 2025 Milliman Long Term Care Insurance Survey is the 27th consecutive annual review of stand-alone and combination long-term care insurance (LTCI) published by Broker World magazine. This comprehensive report, authored by Claude Thau, Nicole Gaspar, Chris Giese, and Matthew Epps, provides a detailed review of the individual and worksite stand-alone LTCI marketplace, sales distributions, claims, underwriting trends and available products as well as sales and commentary relative to combination LTCi. We thank insurance company staff for submitting the data and responding to questions promptly.
The report includes the following sections and exhibits:
Section IV: Claims Data Analysis – Stand-alone LTCI
Section V: Statistical Analysis of Stand-alone LTCI Sales
Section VI: Underwriting Data Analysis – Stand-alone LTCI
Stand-Alone LTCi Product Display shows financial ratings, LTCI sales and inforce policies, and generic product details
Stand-Alone LTCi Premium Display includes lifetime annual premiums by insurer for various benefit options
Stand-Alone Underwriting Class Display shows the premium adjustment (from the Premium Display) for each underwriting class and also shows the distribution of issued policies by underwriting class
Dive into the complete 2025 Milliman Long-Term Care Insurance Survey for all the data, analysis, and expert commentary. Read the Full Report
The 2024 Milliman Long Term Care Insurance Survey, published in the July/August issue of Broker World magazine, was the 26th consecutive annual review of long-term care insurance (LTCI) published by Broker World magazine. It analyzed product sales, reported sales distributions, and detailed insurer and product characteristics.
From 2006-2009, Broker World magazine published separate group LTCI surveys, but discontinued those surveys when the availability of group LTCI policies shrank. In 2011, Broker World magazine began this annual analysis of worksite (“WS”) sales to complement the overall market analysis.
The WS market consists of individual policies and group certificates (“policies” comprise both henceforth) sold with employer support, such as permitting on-site solicitation and/or payroll deduction. If a business owner buys a policy for herself and pays for it through her business, participants likely would not report her policy as a WS policy because it was not part of a WS group. If an employer sponsors LTC/LTCI educational meetings, with employees pursuing interest in LTCI off-site, sales would likely not be reported as WS sales.
We limit our analysis to US sales and exclude “combination” products, except where specifically indicated. (Combination products pay meaningful life insurance, annuity, or disability income benefits in addition to LTCI.)
The bulk of worksite sales that cover activities of daily living (ADLs) or cognitive impairment do not qualify as LTCI under section 7702(B) and are not covered in this survey (except as specifically mentioned).
In addition to “WS” to represent worksite sales, we use “NWS” to represent individual (non-worksite) sales and “Total” to refer to WS and NWS sales combined.
About the Survey Participants: Seven insurers (Bankers Life, Knights of Columbus, Mutual of Omaha, National Guardian Life, New York Life, Northwestern, and Thrivent, referred to as “Participants” herein) contribute broadly to stand-alone sales distributions reported herein. Total 2023 sales data includes one additional contributor (LifeSecure) and 2023 inforce data includes two additional contributors (LifeSecure and CalPERS).
Our stand-alone LTCI WS sales and statistical distributions come from participants National Guardian Life, New York Life, and Northwestern; WS sales data from contributor LifeSecure; and inforce business from those insurers plus Mutual of Omaha.
The following ten insurers participated in our combination sales data: AFLAC, John Hancock, Mass Mutual, New York Life, Nationwide, Northwestern Mutual (Northwestern), OneAmerica, Securian, Trustmark and United of Omaha.
Comparisons of sales distributions: WS statistical distributions can vary significantly from year-to-year if particular segments of the WS market are over- or under-represented (the three segments are core, carve-out, and voluntary, described later). Carriers that provided our 2023 distributions had an average worksite annual premium of $2,271, excluding FPOs and single premium policies, whereas insurers that provided sales, but not distributions, had an average annual worksite premium of $1,476. That discrepancy, consistent with the past several years, suggests that our worksite sales distributions are dominated by carve-out executive sales.
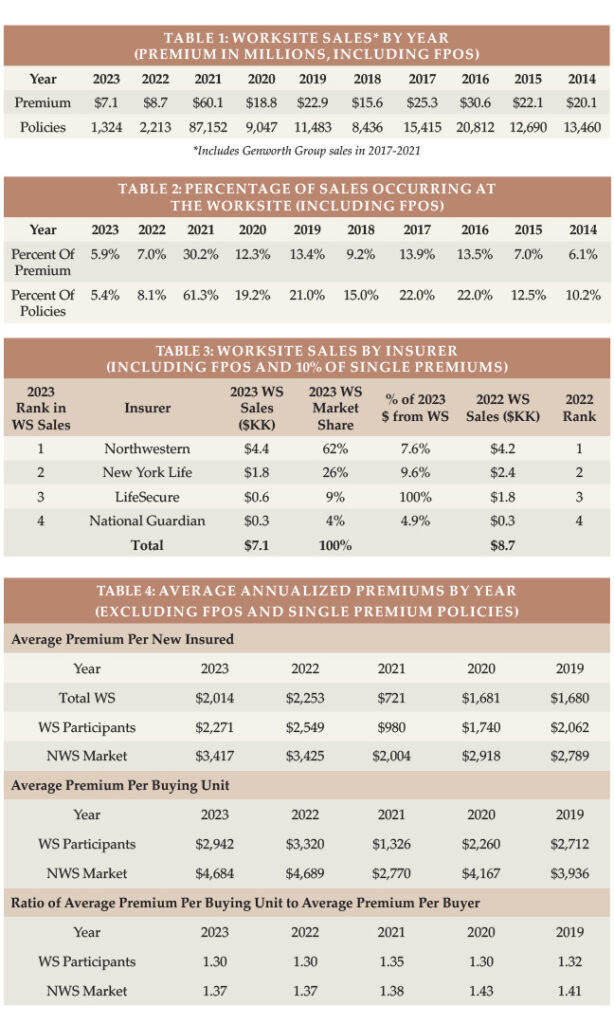
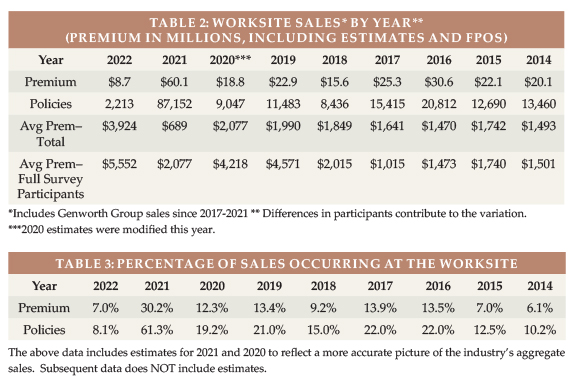
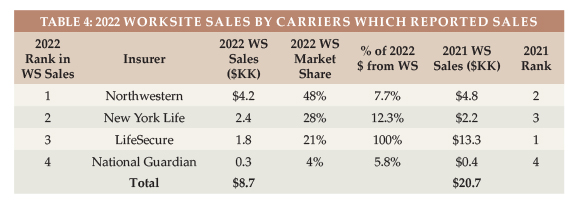
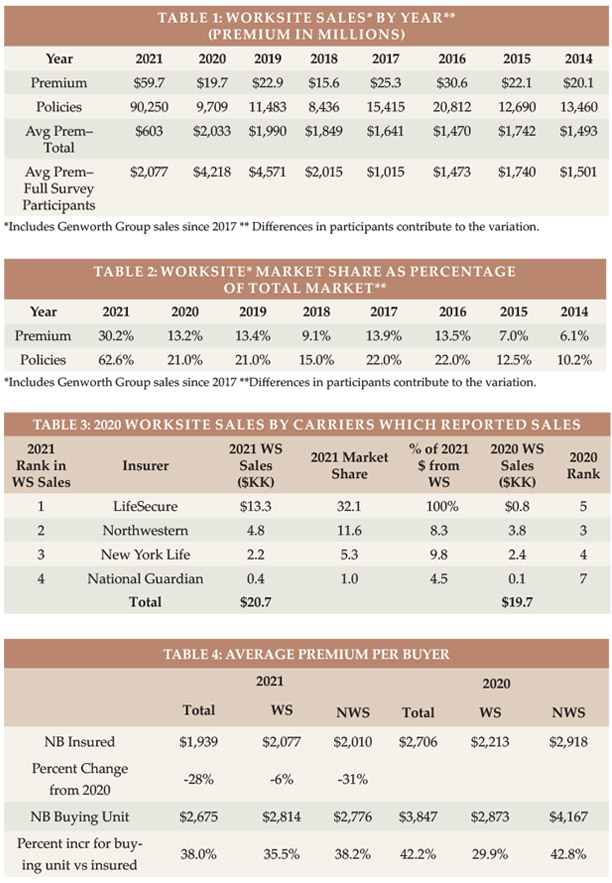
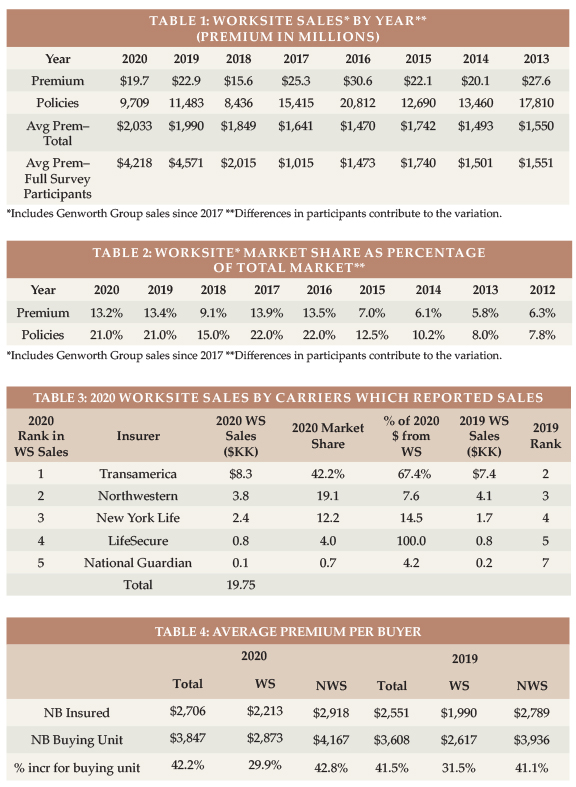
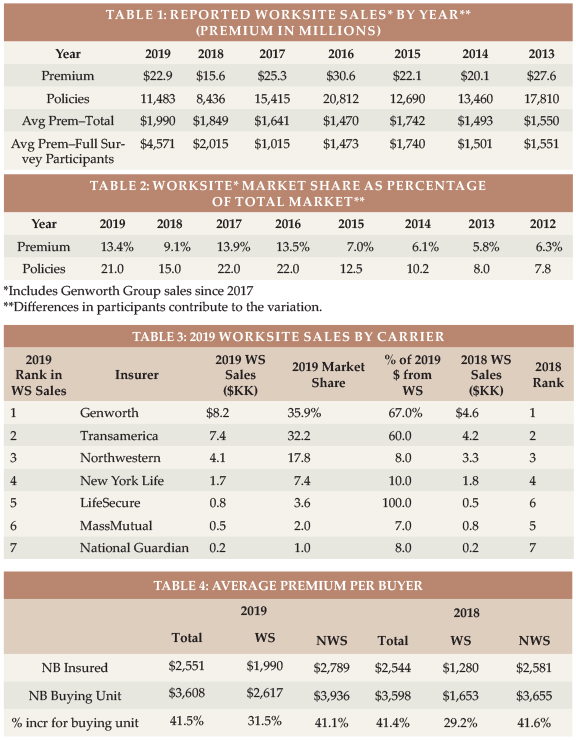
Highlights from This Year’s Survey Table 1 shows WS new sales by year (for 2023: 1,324 lives, down 40 percent from 2022, and $7.1 million of annualized premium, including FPOs, down 18 percent) and Table 2 shows the percentage of Total sales that were made in the WS by year (5.4 percent of lives and 5.9 percent of premium in 2023). The WS stand-alone LTCI market has reduced substantially since the major writer discontinued sales in 2021 and is a decreasing percentage of the Total market. As discussed previously, some sales that are worksite-related may not be classified as WS sales.
Over at least a 20-year period prior to 2022, the fewest stand-alone worksite LTCI policies sold in a year was 8,436 policies (2018). Worksite sales with coverage for ADL-deficiency and cognitive impairment have shifted to combination policies, most of which do not qualify as LTCI under section 7702(B). Only two of the carriers in that market reported combo worksite sales for our survey, but those two carriers sold roughly 80,000 such worksite policies in 2023 (up 16 percent from 2022) compared to the industry’s 1,324 stand-alone LTCI WS sales. Among our combination contributors, WS sales accounted for 36.3 percent of reported lives and 9.9 percent of annualized premium. We have a good-sized sample of combination insurers, but a lower percentage of industry sales than in the stand-alone market.
MARKET PERSPECTIVE There are three segments of the WS market. A single WS case may involve different segments for different employee classes.
In “core” (“core/buy-up”) programs, employers pay for a small amount of coverage for generally a large number of employees. Employees can buy more coverage. “Core” programs generally have low average ages, short benefit periods, low daily maximum benefits and a small percentage of spouses insured.
In “carve-out” programs, employers pay for robust coverage for key executives and usually their spouses. Generally, executives can buy more coverage for themselves or spouses. Compared to “core” programs, a higher percentage of insureds are married and more spouses buy coverage. Because the age distribution is older, the maximum monthly benefit is higher, and the benefit period is longer, the average premium is much higher than for core programs.
In “voluntary” programs, employers pay none of the cost. The typical coverage is more robust than “core” programs, but less robust than “carve-out” programs. Voluntary programs tend to be most weighted toward female purchasers.
Because of tax savings, small executive carve-out issue dates may have effective dates weighted toward the end of the year. On the other hand, large voluntary cases are more likely to have fall enrollments with January 1 effective dates.
National Guardian, New York Life, and Northwestern write mostly executive carve-out programs and are the only insurers that provided statistical worksite distributions; therefore, our distributions are heavily weighted to the executive carve-out market.
Carrier and product shift: Voluntary WS programs have gravitated toward combination products that include life insurance because insurers, brokers, employers, and employees tend to favor combination products.
Insurers’ pricing, underwriting, and distribution considerations favor combination products. Prior to 2012, insurers used unisex “street” pricing and typically discounted “street” prices by five percent for the worksite. Gender-distinct “street” pricing made WS pricing more complicated for insurers who believe unisex pricing is preferable in the WS due to Title VII of the 1964 Civil Rights Act. Pricing, state filing, administration, and illustration work increased when insurers could no longer simply reduce “street” prices by five percent.
Because women have higher expected future claims, unisex pricing saves women money compared to gender-distinct NWS pricing. On the other hand, men pay much more (e.g., roughly 50 percent more for some insurers) with unisex pricing than with gender-distinct pricing, possibly complicating WS sales and raising insurer concerns about gender anti-selection (a higher percentage of females in WS cases). Insurers also fear health anti-selection (unhealthy people being over-represented among buyers), as stand-alone LTCI does not have a high voluntary participation rate. Therefore, WS stand-alone LTCI programs have limited, if any, underwriting (health) concessions.
Combination products with LTC-related benefits are less affected by unisex pricing as females pay less for the death benefit but more for the LTCI (or chronic illness) benefit. Furthermore, products with chronic illness riders do not require salespeople to be LTCI-certified, which provides insurers access to a broader distribution system than with stand-alone LTCI. As combination life programs have higher penetration rates, insurers often offer “guaranteed issue,” coverage based on the number of employees and participation rates.
From the broker, employer, and employee perspective, simplicity is very attractive. “Guaranteed issue,” along with typically fewer age restrictions than for unisex stand-alone LTCI pricing, allows any employee to be covered and makes enrollment easier and faster, like other employee benefit offerings.
Additionally, combination products’ death benefit avoids the “use it or lose it” issue and is more meaningful for young and less affluent people than is LTCI. Such products can allow 100 to 300 percent of the death benefit to be used for help with ADLs or cognitive impairment, typically using up to four percent of the death benefit each month. Alternatively, they can allow 100 to 200 percent of the death benefit (at a rate of four percent per month) but restore the death benefit each month when a LTCI claim is processed. With “restoration”, beneficiaries will receive the full death benefit regardless of how much LTCI benefit was received. Most of these provisions qualify as “chronic illness” under IRS §101(g); others qualify as “long-term care insurance” under IRS §7702(B). The chronic illness products do not require broker LTCI certification, which makes those products “simpler” than §7702(B) products.
While stand-alone (and linked-benefit) individual LTCI products generally offer annually-increasing coverage to try to maintain purchasing power in the face of inflationary increases in the costs to provide long-term care, WS combination products have a fixed benefit. For example, if a 30-year-old employee buys a $100,000 death benefit, she will have a $4,000 monthly benefit for chronic illness (assuming the benefit features described above). That $4,000 benefit would have much more purchasing power if she needs care in the next few years than if she needs care 50 years from now.
Stand-alone LTCI is still popular in executive carve-out programs. Executives can more easily afford to continue coverage after termination of employment, hence appreciate the value of compound benefit increases. Income tax advantages encourage employer-paid coverage, particularly for executives, and tax advantages may increase in the future if income tax rates rise or if such LTCI coverage permits opting out of future state LTCI programs. Because of tax advantages and employer premium payment, higher unisex prices for men are less of an issue in the executive carve-out market. Two stand-alone LTCI insurers offer unisex pricing with as few as 2 to 5 (varies by jurisdiction) employees buying, an approach that caters to this market.
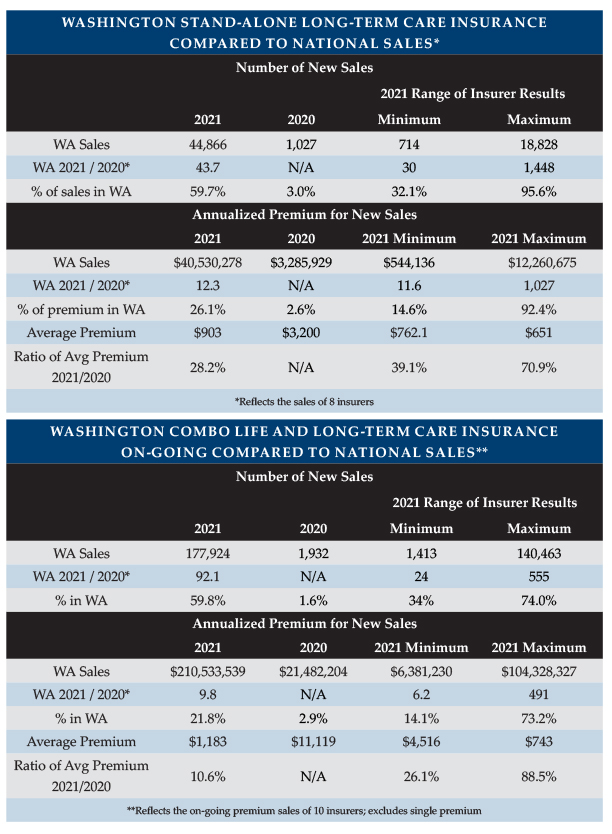
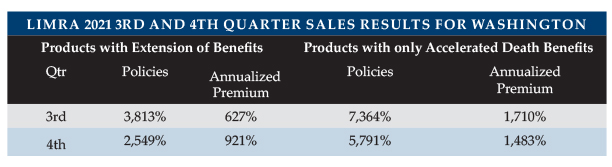
State-run LTCI programs: We discussed state-run LTCI programs in the July/August issue and prior years’ articles. Washington state’s “Washington Cares Fund” (WCF) stimulated tremendous market demand in the state of Washington, causing WS sales and distributions to vary greatly from historical trends in 2021 and 2022. However, the Washington Cares Fund and other potential state-run programs appear to have had little impact on 2023 WS sales.
Availability of coverage: As few people younger than age 40 buy stand-alone LTCI, some insurers have raised their minimum issue age to avoid anti-selection and to reduce exposure to extremely long claims. One insurer limits the maximum age to 69. Such age restrictions can discourage employers from introducing a program (even a carve-out program if they have executives or spouses too young to be covered).
Younger employees who are ineligible for coverage may still benefit from a program because their elders are often eligible for WS stand-alone LTCI programs. However, one contributor no longer offers WS LTCI to non-household relatives. Reduced availability for such relatives does not have much impact on sales, because typically 99 percent of worksite sales are to employees or their partners. Thus, even if a program is available to elder relatives, it is not likely to meaningfully address the negative impact of employees being caregivers.
With increased remote work, more employers have employees stretched across multiple jurisdictions. Eligible non-household relatives might live anywhere. However, insurers may not offer a product in jurisdictions with difficult laws, regulations, or practices, such as slow policy form approval. It can be hard to find a product which can cover everyone unless LTCI is sold on a group policy form and the employer does not have individuals in extra-territorial states. Combination products also run into jurisdictional issues because some jurisdictions do not allow LTCI benefits to exceed the death benefit and/or do not allow death benefit restoration.
Increasing hurdles for coverage have discouraged brokers as well as insurers. Some employee benefit brokers are reluctant to embrace stand-alone LTCI because of declinations, the enrollment effort compared to typical group coverages, certification requirements, their personal lack of expertise, etc. These issues could be mitigated by LTCI specialists forming relationships with employee benefit brokers.
Support for Employees who are Caregivers: Various programs offer LTC-related services to employees and their families. Regardless of whether the employee is insured or the relative is insurable, they may be able to access information, advice, services, and products that make caregiving more efficient, more effective, safer, and less expensive. Enabling employees and their families to have better LTC experiences and to use more (not necessarily 100 percent) commercial care should boost productivity at work. Some of these programs are packaged with WS LTCI.
STATISTICAL ANALYSIS In addition to fundamental industry changes, distributions may vary significantly from year to year due to different participants, shifting distribution within an insurer, and changing market share among insurers. Our sales distributions reflect only stand-alone LTCI. Two insurers reported their number of new employer cases as well as the number of new worksite sales. Combined, they averaged 5 applications per new employer case, which seems to confirm the executive carve-out concentration in our data.
Aggregate Sales Table 1 shows the number of sales and premium in the worksite market by year. As noted above, the worksite market is in decline, with the exception of 2021 due to sales stimulated by the WCF. The shrinkage of the stand-alone WS market is underscored when you consider that nearly two-thirds of 2023 WS premiums came from FPOs on past years’ sales.
Table 2 shows WS sales as a percentage of total LTCI sales. As the market shrinks, the impact of FPOs on past sales becomes larger. FPOs account for WS being a higher percentage of premium (5.9 percent) than policies (5.4 percent). Removing FPOs, the WS premium is 3.2 percent of the total. The 2022 percentages are slightly inflated due to runout sales in Washington.
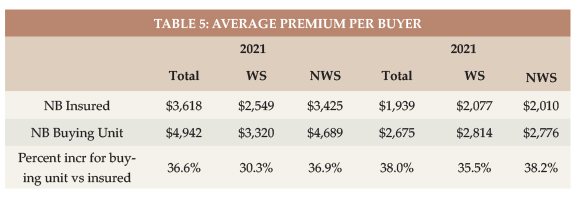
Market Share Table 3 shows the insurers’ reported WS sales, including FPOs and new sales to worksite cases issued in prior years. Excluding FPOs, New York Life would have been in the lead, followed by LifeSecure.
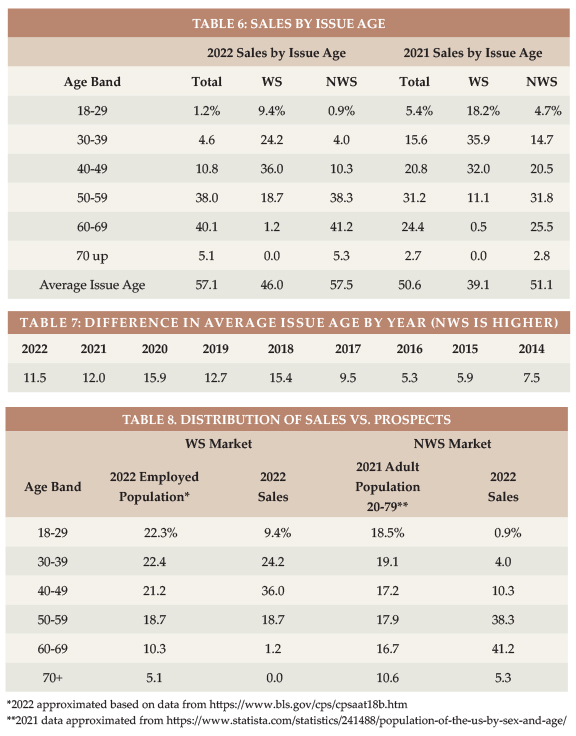
Average Premium Per Buyer Table 4 shows the average premium (without FPOs and without single premiums) per new insured for WS contributors, for WS participants (insurers which provided distributions), and for the NWS market. The total WS market has a lower average premium than those WS carriers that provided distributions. When comparing the WS market to the NWS market, influences such a younger average issue age drive the lower WS average premium.
Table 4 also shows the average premium per buying unit for insurers that provided distributions (a couple comprise a single buying unit). The average premium per buying unit is higher because there are fewer buying units than insureds. The ratio between average premium per buying unit and average premium per insured life is consistently lower for WS sales, because more WS buyers are single and because spouses are less likely to buy in the WS. However, Table 4 likely understates the difference because our WS distributions reflect a higher concentration from the carveout market, which has a lot of couples who both buy.
Issue Age In reviewing the balance of the statistical presentations, we urge you to be selective in how you use the data because it is not representative of the entire WS market as explained above.
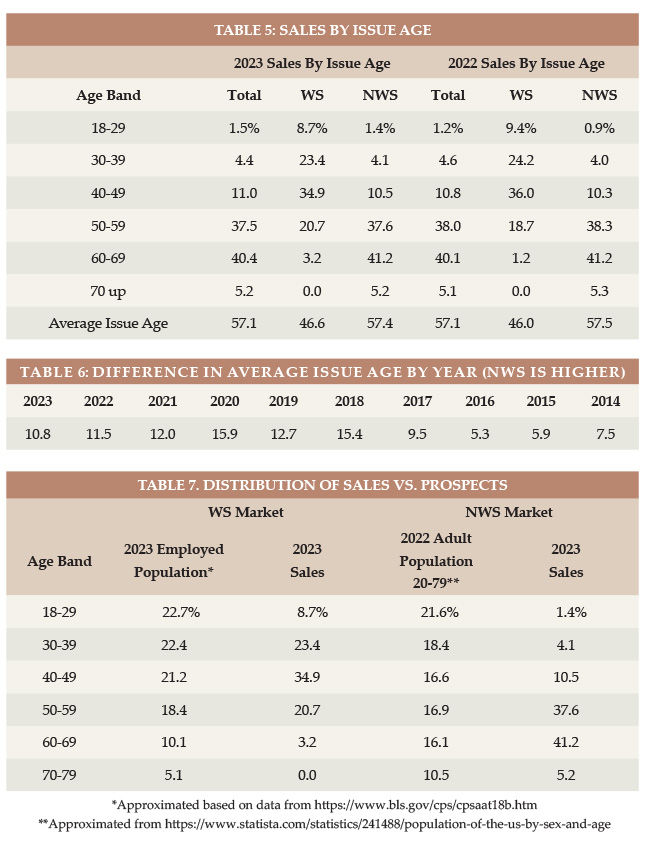
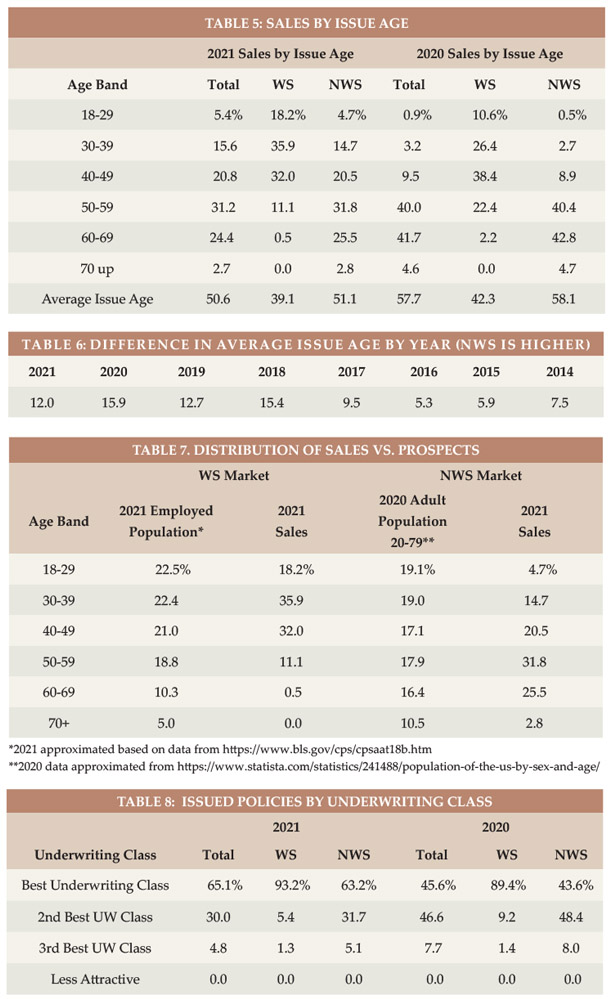
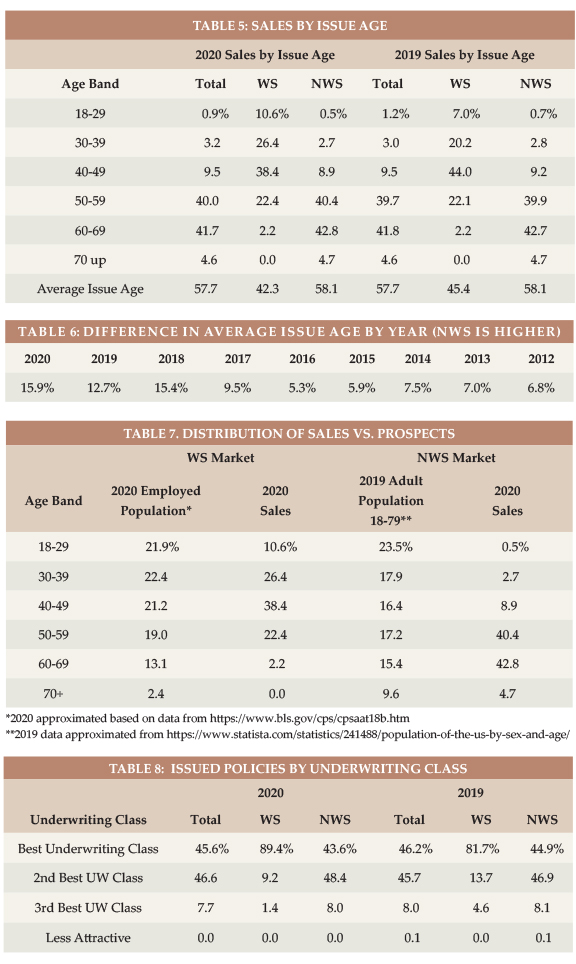
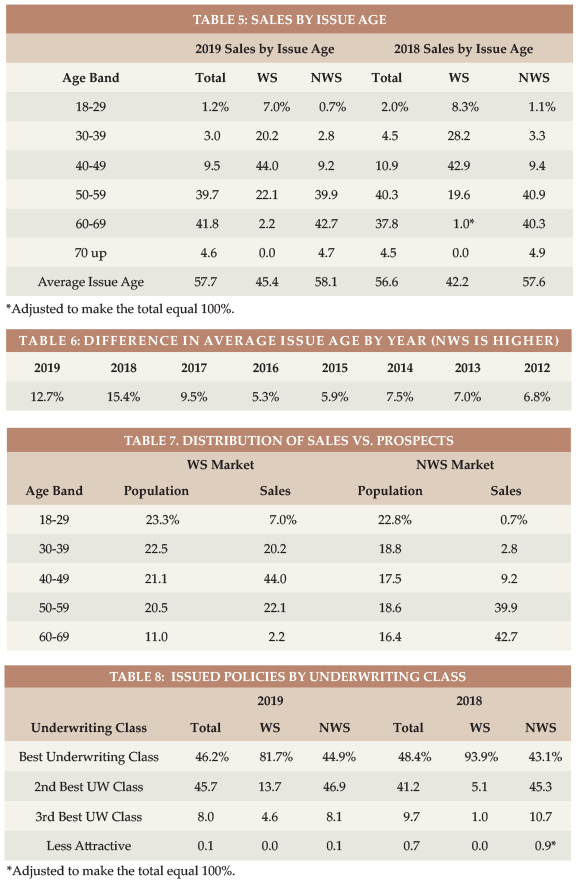
Table 5 shows the distributions by issue age and Table 6 shows, by year, how much older the average age NWS buyer is than the average age WS buyer.
Table 7 displays the relative age distribution of workers ages 18+ compared to the age distribution of purchasers in the WS market and the age distribution of adults 20-79 compared to the age distribution of purchasers in the NWS market. If the percentage of sales in a particular age group is higher than the percentage of population in that age group, we can conclude that LTCI is more appealing to that age group, the industry gets in front of that age group more, and/or more of the applicants in that age group qualify for coverage. In the WS market, the industry is particularly effective with ages 40-49. In the NWS market, the industry is particularly effective for ages 50-69.
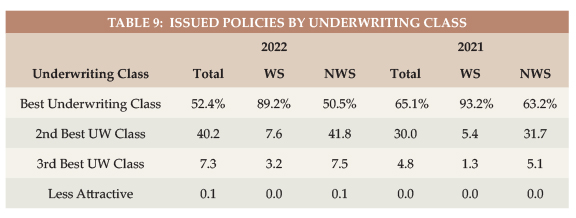
Rating Classification Three of our seven contributors do not offer a “preferred health” discount, so the bulk of their sales are in their best underwriting class. They are also the insurers providing WS distributions, which contributes to the high percentage (92 percent) of worksite policies issued in the best underwriting class, as shown in Table 8.
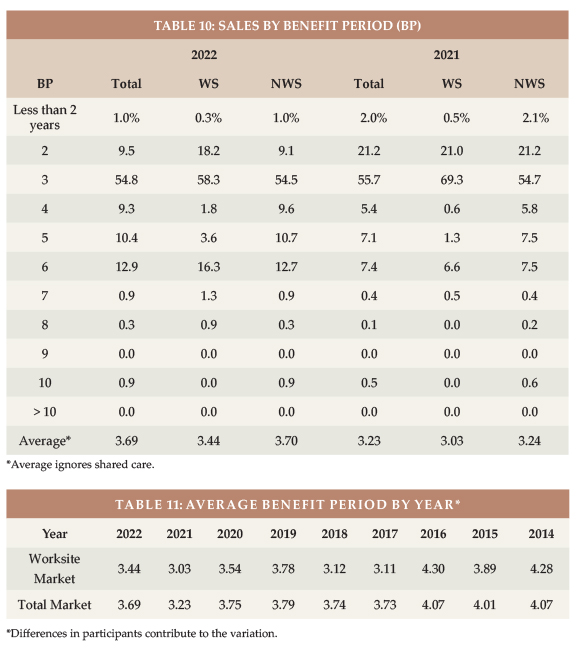
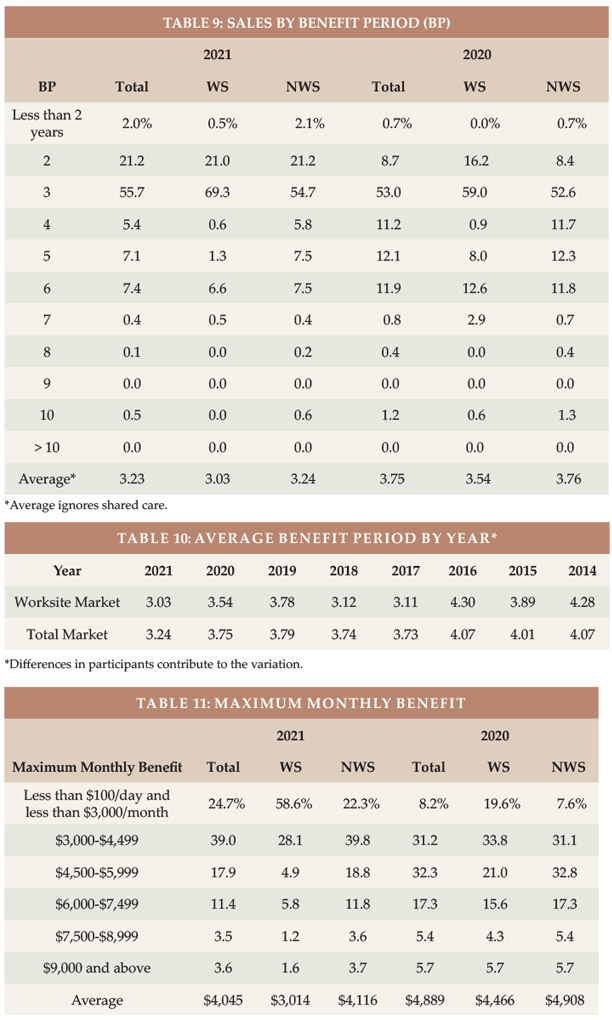
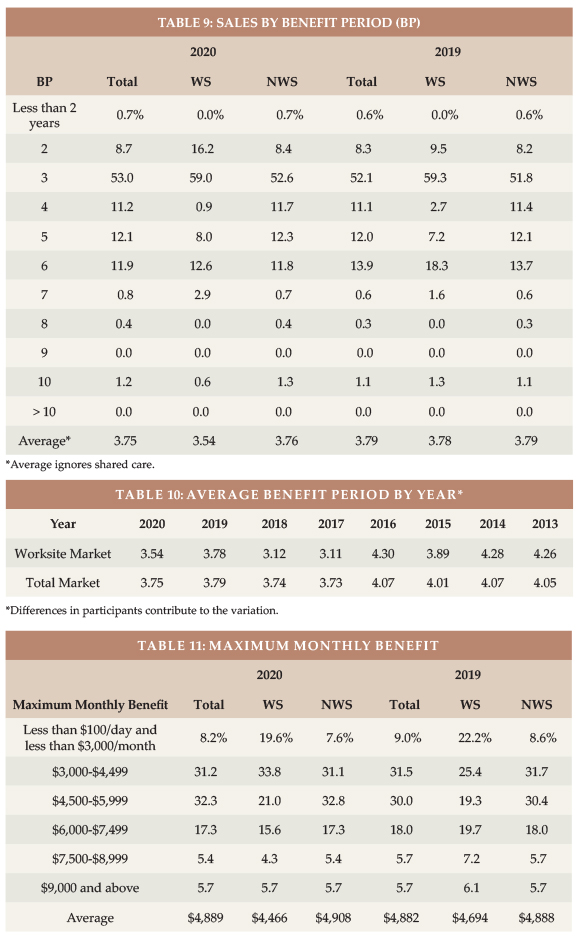
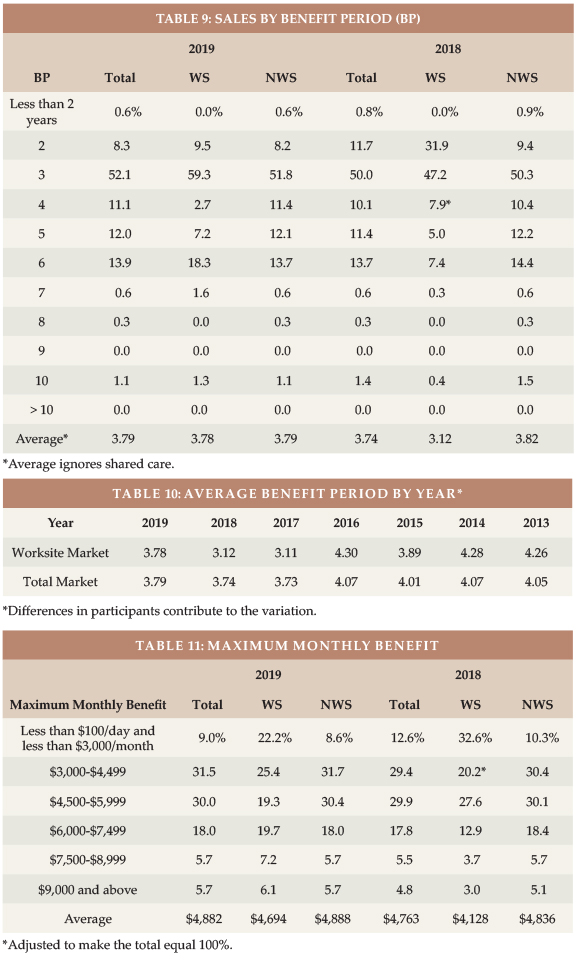
Benefit Period The WS average benefit period is low for core/buy-up programs and somewhat low for voluntary programs. Executive carve-out programs sometimes have longer benefit periods than the NWS market. In 2023, the WS market, for the first time since 2016, had a slightly longer average benefit period than the total market (see Table 9). Table 10 shows the results by year. Note that these statistics ignore Shared Care which, in effect, lengthens benefit period and is more prevalent in the NWS market.
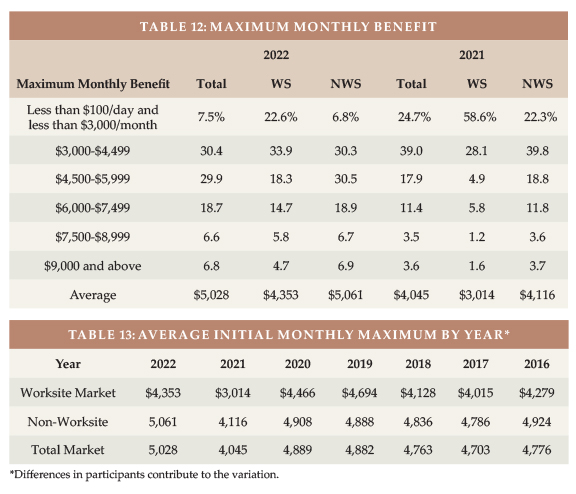
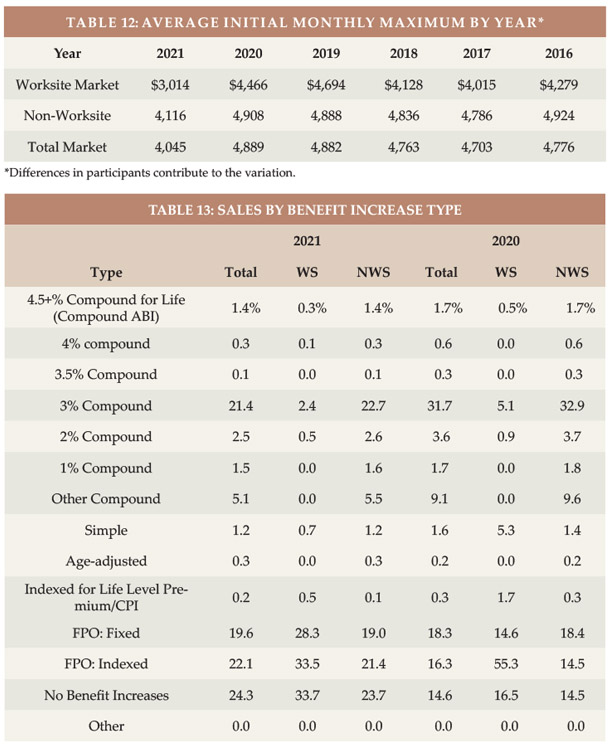
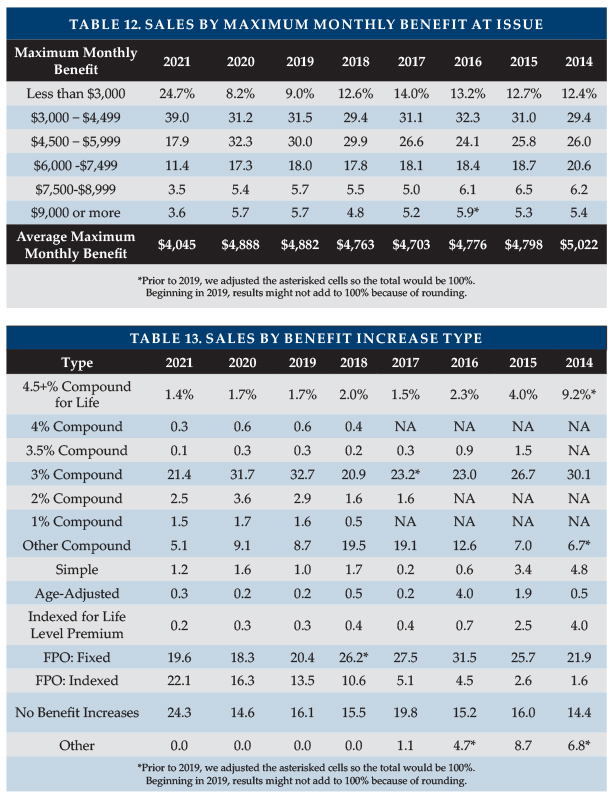
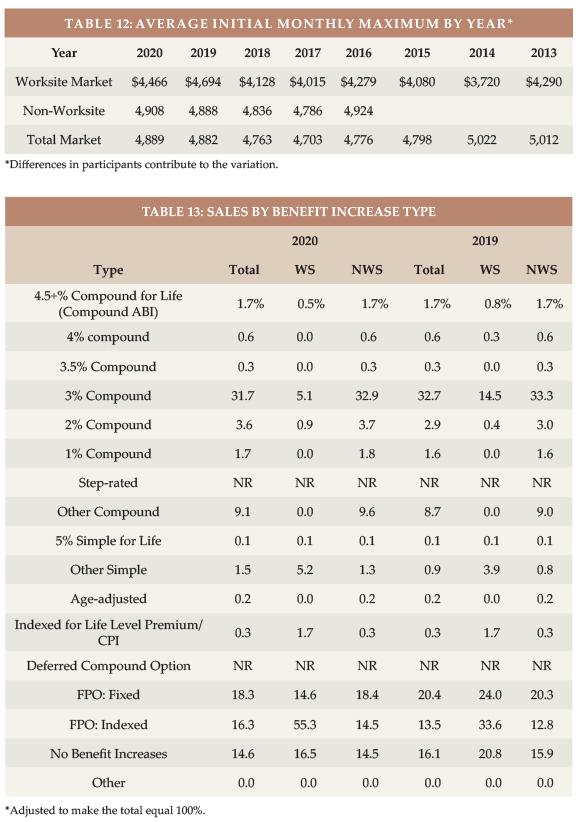
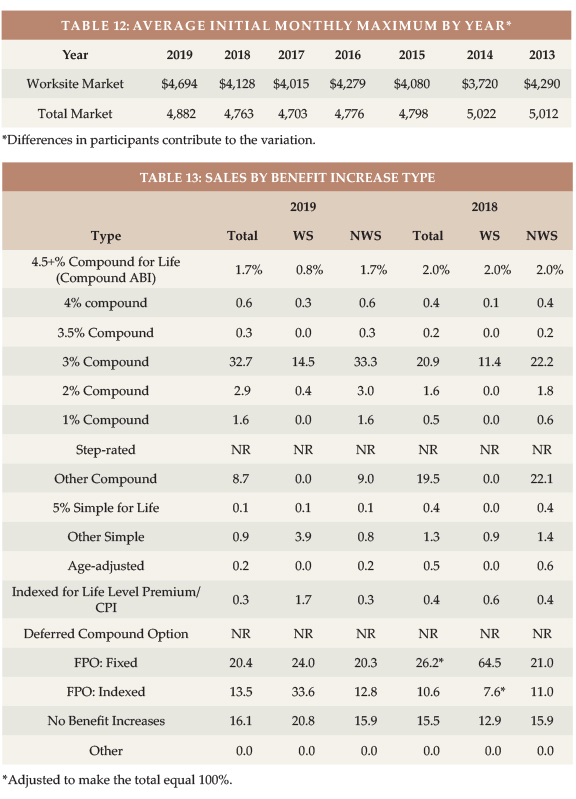
Maximum Monthly Benefit To calculate the average initial monthly maximum, we presume an average size in each size range shown in Table 11. While the WS market had a slightly longer average benefit period in 2023 than did the NWS market, it had a smaller average initial monthly maximum. Table 12 shows that the initial maximum monthly benefit hit record high levels in 2023. The WS initial monthly maximum varies more over time than the total market because of participant changes and how many core/buy-up plans were sold in a particular year.
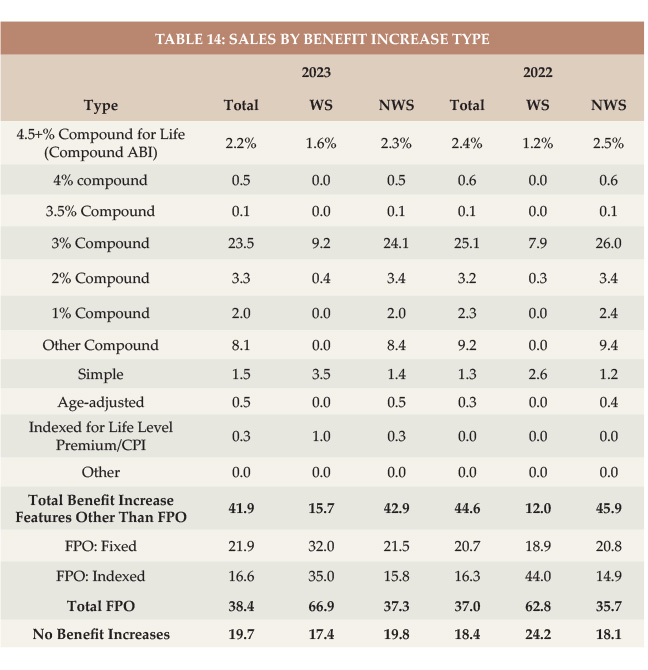
Benefit Increase Features As shown in Table 14, 10.8 percent of 2023 WS sales had compounding of three percent or higher, compared to 9.1 percent in 2022. Of the 2023 WS sales, 17.4 percent had no increase feature and 67 percent had a FPO feature.
In the NWS market, 26.9 percent had three percent or higher compounding compared to 29.2 percent in 2022. While three percent or more compounding is dropping in the NWS, it is increasing in the WS market, albeit still much less common in the WS market.
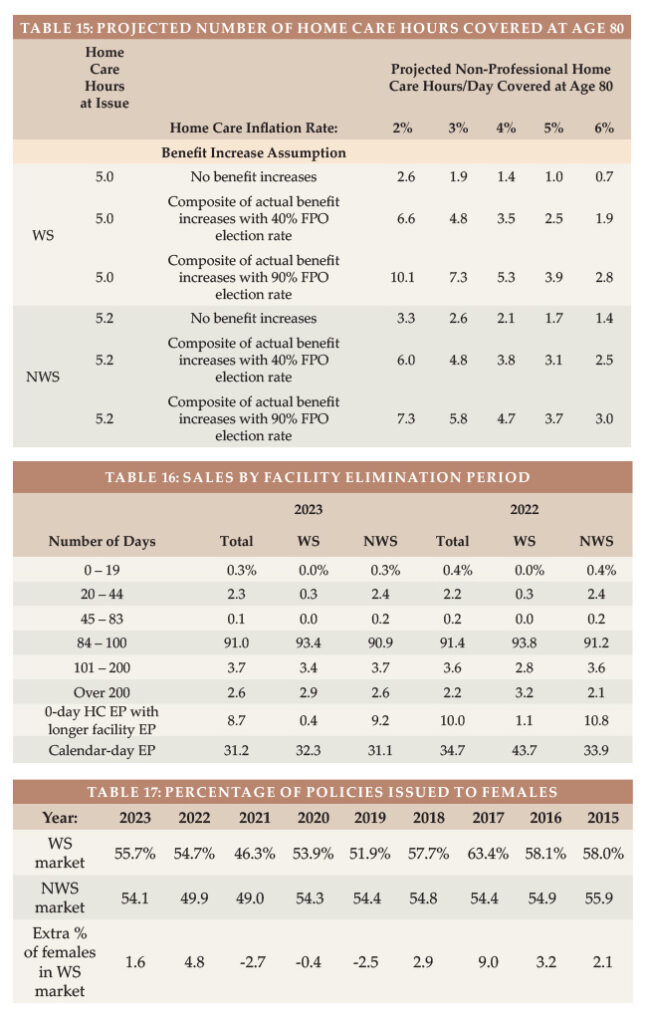
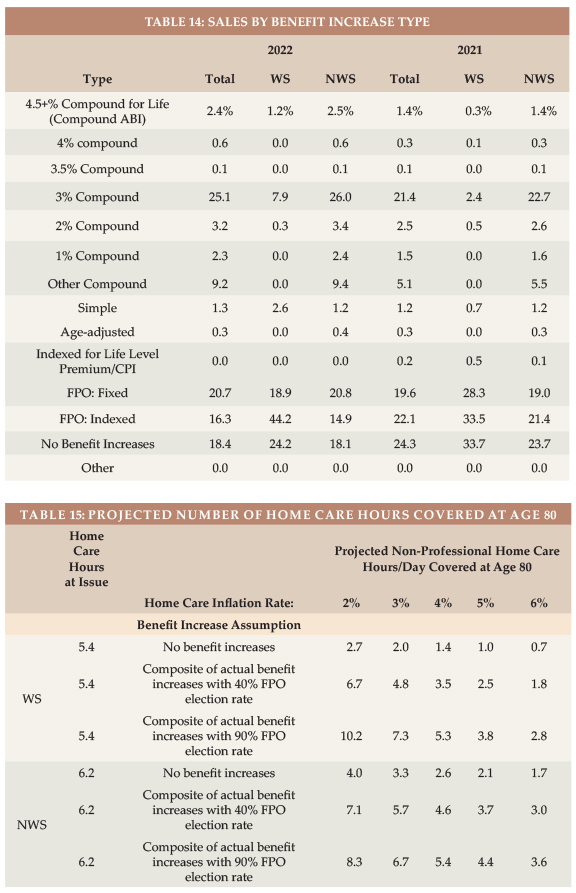
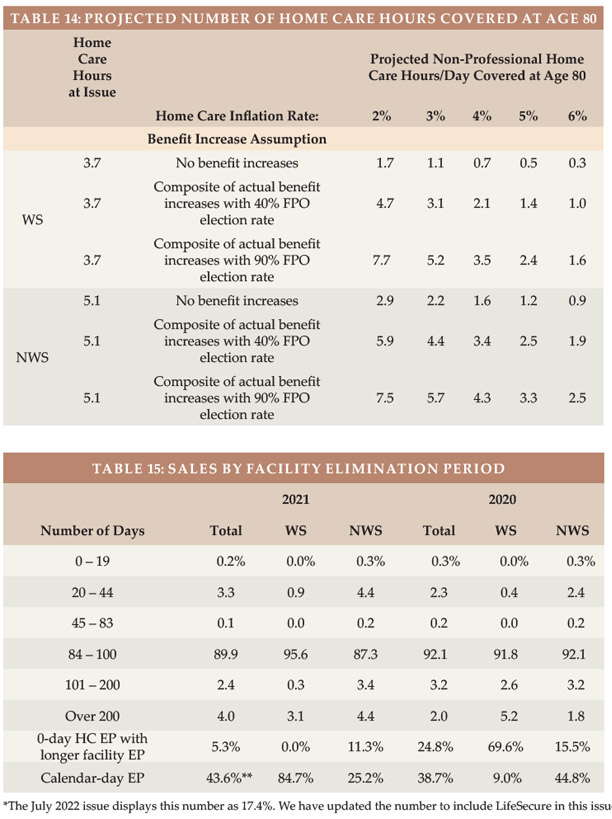
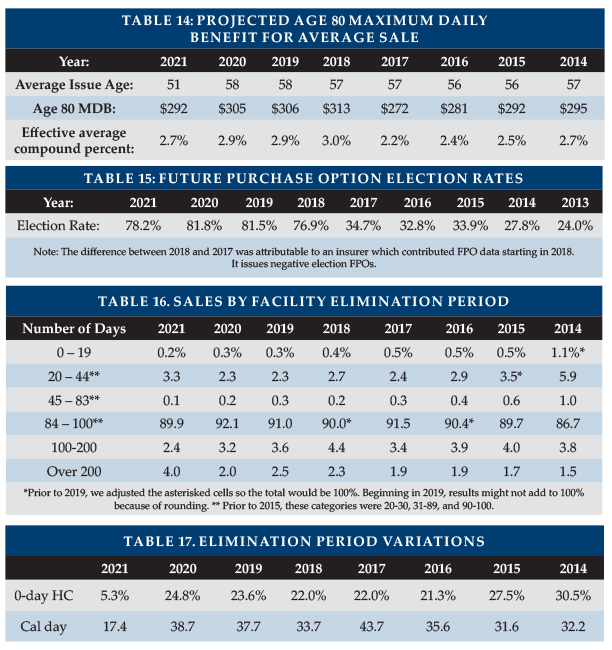
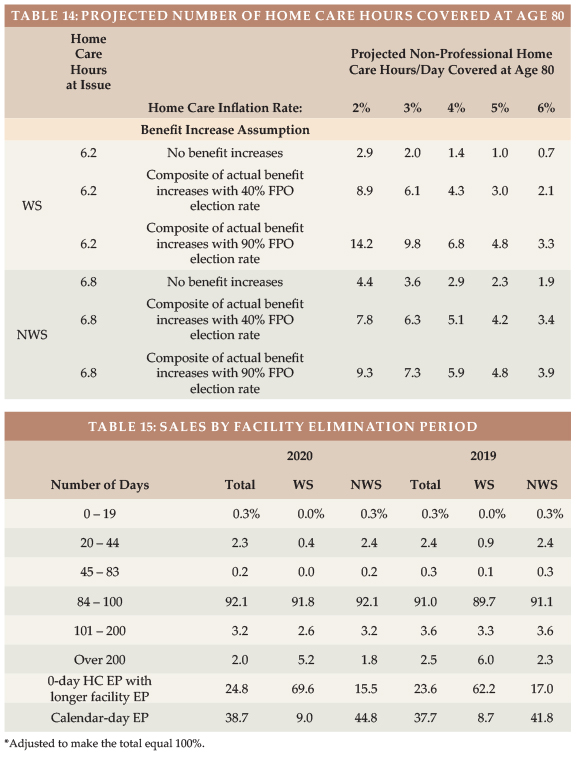
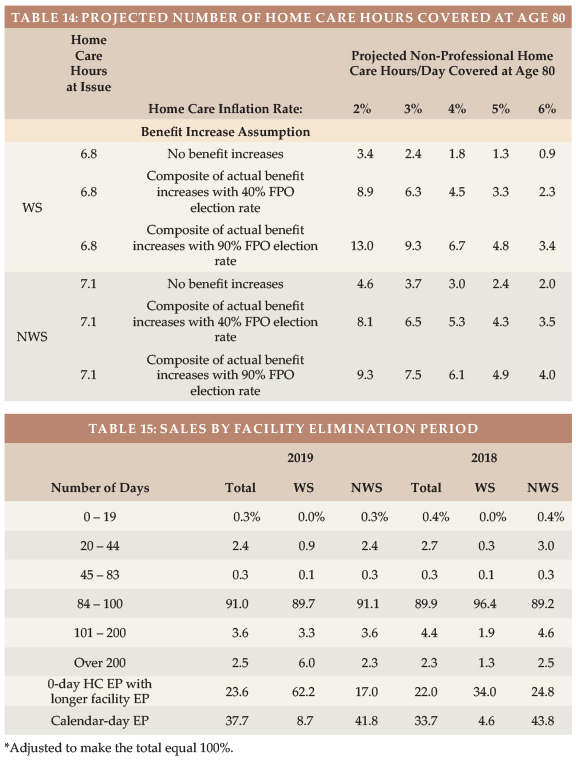
Future Protection Based on a $33/hour cost for home health aides (the median cost according to Genworth’s 2023 Cost of Care Survey), the average WS initial maximum daily benefit of $166 would cover 5.0 hours of such care per day at issue, whereas the typical NWS initial daily maximum of $173 would cover 5.2 hours of such care per day, as shown in Table 15.
The number of future home care hours that could be covered depends upon when care is needed (we have assumed age 80), the home care cost inflation rate between now (age 47 for WS and 57 for NWS) and age 80 (we have calculated with 2, 3, 4, 5 and 6 percent inflation), and the benefit increases provided by the LTCI coverage between now and age 80.
Table 15 shows calculations for three different assumptions relative to benefit increase features:
The first line presumes that no benefit increases occur (either sold
without any benefit increase feature or no FPOs were exercised).
The second line reflects the average benefit increase design using the methodology reported in the July/August article, except it assumes that 40 percent of FPOs are elected (intended to be indicative of “positive” election FPOs, in which the increase occurs only if the client elects it) and provide five percent compounding.
The third line is like the second line except it assumes 90 percent of FPOs are elected (intended to be indicative of “negative” election FPOs, in which the increase occurs unless the client rejects it). It also assumes the FPOs reflect five percent compounding.
Table 15 indicates that:
Without benefit increases, purchasing power deteriorates significantly, particularly for the WS purchaser as younger buyers have more years of future inflation prior to claim onset. For example, with a flat benefit, the number of covered hours of home care at age 80 drops to 1.9 hours for the average WS purchase age if there is three percent inflation. The average NWS buyer would have 2.6 hours of care (rather than 1.9 hours) at age 80 if they had no benefit increases and inflation was three percent because the average NWS buyer is older (and secondarily, buys a larger daily benefit).
The “composite” (average) benefit increase design assuming that 40 percent of FPO offers are exercised preserves purchasing power better than when no increases are assumed. The average WS buyer gains buying power over time if the inflation rate is two percent, being able to pay for 6.6 hours at age 80. But if the inflation rate is four percent, this drops to 3.5. The average NWS buyer generally does better because of a higher issue age, more robust benefit increase features and a higher initial maximum daily benefit. However, the WS market has more FPOs, so when we assume 90 percent FPOs election, the WS market does better. It also does better with 40 percent FPO election and a two percent inflation rate because we presume a full five percent FPO will be exercised.
Assuming that 90 percent of FPO offers are exercised, the average WS buyer would have at least as much coverage at age 80 as at issue if the inflation rate is less than four percent. The average NWS buyer has increasing purchasing power unless inflation averages four percent.
Table 15 underscores the importance of considering future purchasing power when buying LTCI. Please note:
a) The average 2023 WS buyer was 10 years younger at issue than the average 2023 NWS buyer, hence has 10 more years of inflation and benefit increases in Table 15. The actual inflation rate to age 80 is not likely to be the same for today’s 47-year-olds as for today’s 57-year-olds.
b) Individual results vary significantly based on issue age, initial maximum monthly benefit, and benefit increase feature, as well as the inflation rate and the age at which the need for care occurs.
c) By the median age of starting to need care (about age 83) and the median age of needing care (about age 85), more purchasing power could be gained or lost.
d) Table 15 does not reflect coverage for professional home care or facility care. According to the 2023 Genworth study, the median nursing home private room cost is $320/day, which is currently comparable to 10 hours of non-professional home care. However, the inflation rate for facility costs is likely to differ from the inflation rate for home care. From 2004-2023, Genworth’s studies showed the following compound growth rates: private room in a nursing home (3.1 percent), assisted living facility (4.3 percent), home health aide (2.7 percent), and home care homemaker (3.1 percent).
e) Table 15 could be distorted by simplifications in our calculations. For example, we assumed that the FPO election rate does not vary by age, size of policy or market and that everyone buys a home care benefit equal to the average facility benefit.
Partnership Program Background When someone applies to Medicaid for long-term care services, most states with Partnership programs disregard assets up to the amount of benefits received from a Partnership-qualified policy (with some policies, IN and NY disregard all assets). Partnership programs exist in 44 jurisdictions (all but AK, DC, HI, MA, MS, UT, and VT), but MA has a similar program (MassHealth). The first four states to develop Partnerships (CA, CT, IN and NY) have different rules, some of which have become a hindrance to sales. We are not aware of a Partnership-qualified WS LTCI product in those four states, which is unfortunate because the WS market serves many people who could benefit from Partnership.
To qualify for a state Partnership program, a policy must have a sufficiently robust benefit increase feature. At least 29 jurisdictions have lowered the minimum Partnership-eligible compounding benefit inflation rate to one percent. To facilitate Partnership sales in such jurisdictions, an insurer could lower its minimum size from $1,500 to $1,000 if one percent compounding is included in a core program. The policies would qualify for the state Partnership and case revenue and core sales would likely increase. The premium would be more level by issue age, shifting risk to younger ages which can be preferable for the insurer in a core program.
Jurisdictional Distribution We also examined the market share (based on number of new insureds) by jurisdiction. As was the case last year, the WS market share of five states (AL, AK, HI, NC, & VT) was at least 50 percent higher than that state’s overall market share (e.g., if they had a two percent overall market share, they had at least a three percent market share in WS). This could be the result of a single large case in that state. In 18 jurisdictions (same number as last year), the market share of total sales was at least 50 percent greater than the WS market share, suggesting that there may be opportunity for WS sales in these jurisdictions: CO, DE, IN, KS, KY, LA, MA, MD, ME, MO, MS, NE, NH, NV, OR, RI, SD, and VA. (The 9 bold italicized states were in this list last year.) In 7 jurisdictions (up from 5), our participants had no stand-alone WS sales at all (DC, ID, NM, UT, WV, WY and Puerto Rico).
Click here for a chart of the market share of each US jurisdiction relative to the total, WS and NWS markets, and the Partnership percentage by state. This chart indicates where relative opportunity may exist to grow LTCI sales.
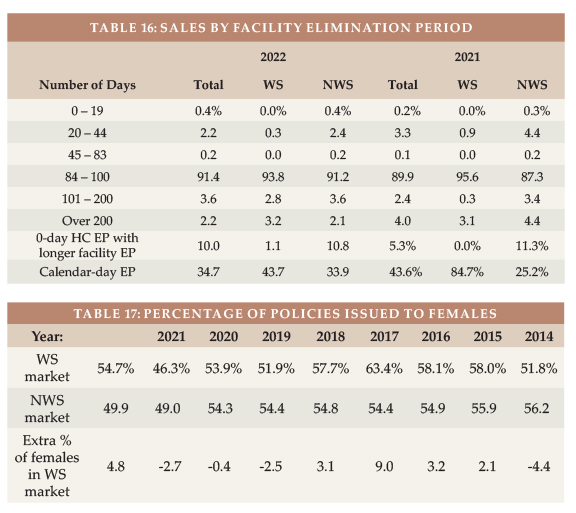
Elimination Period More than 90 percent of the NWS market buys 90-day elimination periods (EPs). For that reason, many WS programs offer only a 90-day EP.
Table 16 shows distribution by EP and how many policies had a 0-day home care feature and a longer facility EP and how many policies had a calendar-day EP (as opposed to a service-day EP). We have reflected that all LifeSecure policies are 90-day EP with a calendar-day definition. Policies which have 0-day home care EP and define their EP as a service-day EP operate almost identically to a calendar-day EP, because people in facilities get daily care.
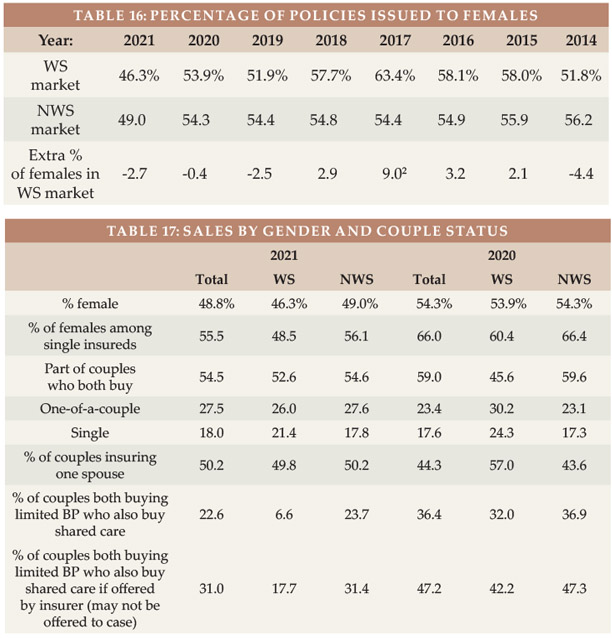
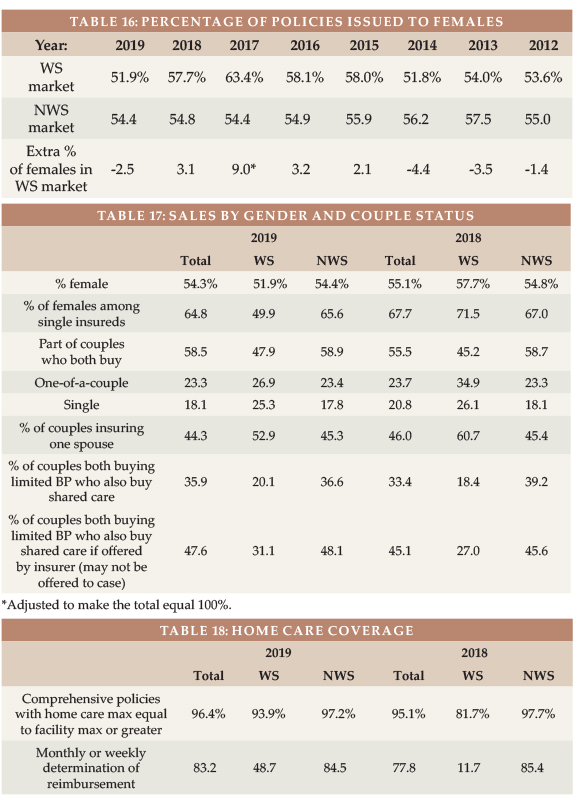
Gender Distribution and Sales to Couples and Relatives Insurers began gender-distinct LTCI pricing in 2013, but unisex pricing continues to be typical in the WS market because of Title VII of the 1964 Civil Rights Act.
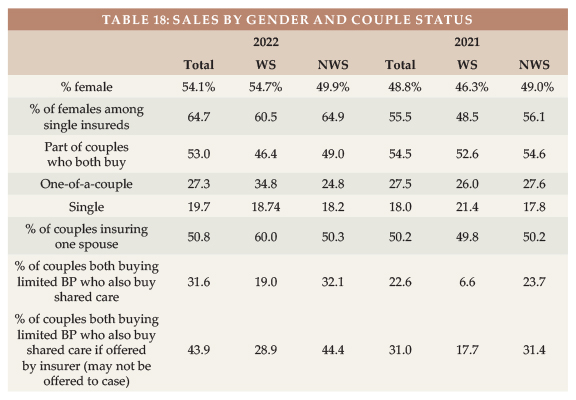
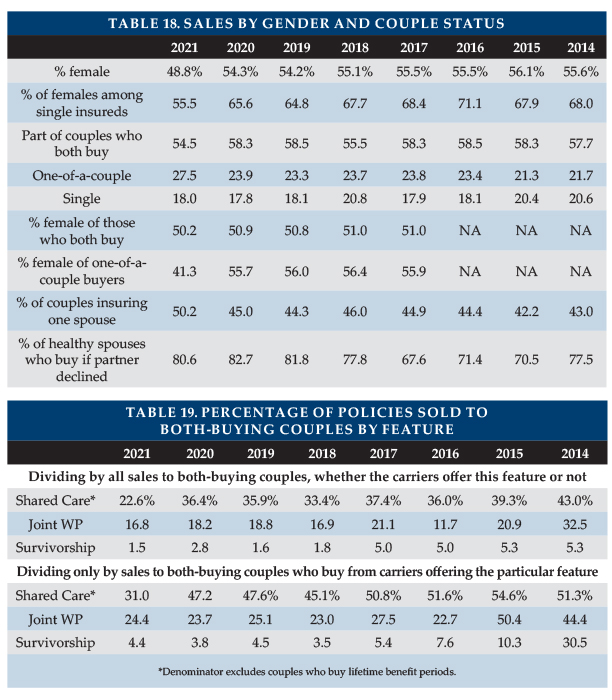
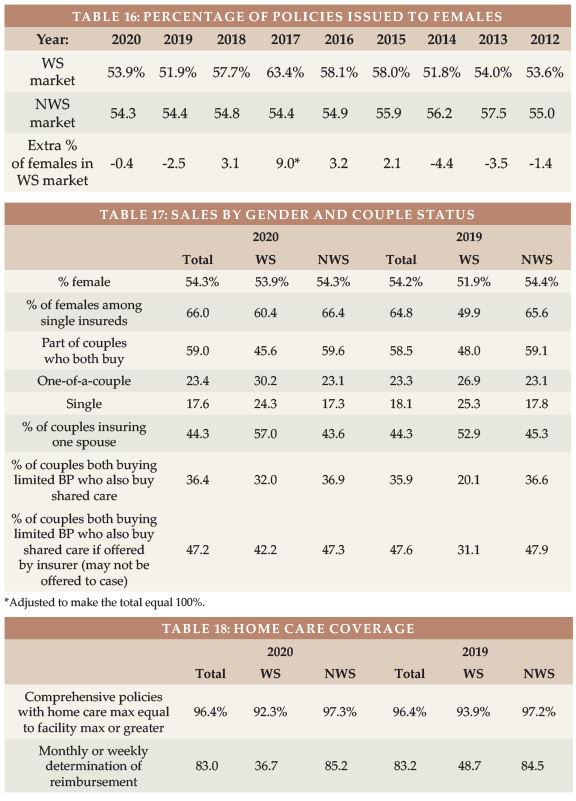
Women are 49.9 percent of the US age 20-79 population but have nearly always dominated LTCI sales1. Since 2016, the percentage of female buyers in the NWS has fluctuated from 54.1 to 54.9 percent (see Table 17), except for 2021 when the percentage of females dipped below 50 percent in both the WS and NWS markets because of the higher number of males purchasing coverage in WA. In 2022, the NWS market also had fewer than 50 percent females because of delayed processing of 2021 WA sales, but the Total market reverted to mostly female.
Table 17 also shows that the WS market generally experiences a higher percentage of female buyers (presumably because of unisex pricing), quantifying the above-mentioned “gender anti-selection” compared to the NWS market. To the degree that our WS data is over-weighted to executive carve-out programs, it likely understates the gender anti-selection of voluntary WS LTCI programs. Women make up 46.9 percent of workers but accounted for 55.7 percent of our reported 2023 WS sales2.
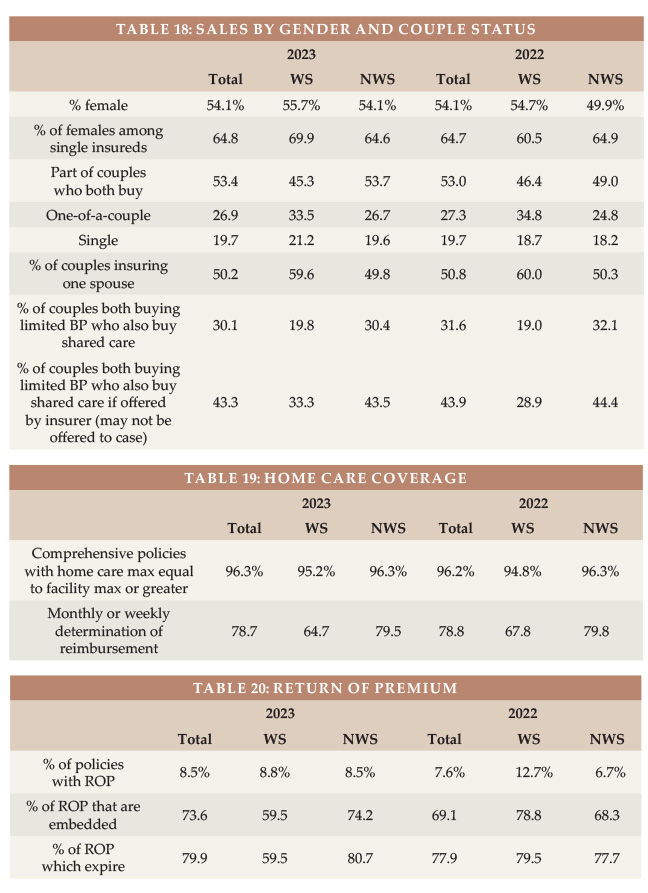
Table 18 digs deeper, exploring the differences between the WS and NWS markets in single female, couples, and Shared Care sales. Our WS data has more couples who insure only one partner (59.6 to 49.8 percent in the NWS market). Shared Care is less often offered in a WS program.
Our limited data with regard to relatives who buy shows that two spouses are insured for every three employees. That’s a high percentage reflective of executive carve-out data. Over time, we have seen about one percent of purchasers are relatives other than the employees and employees’ spouses.
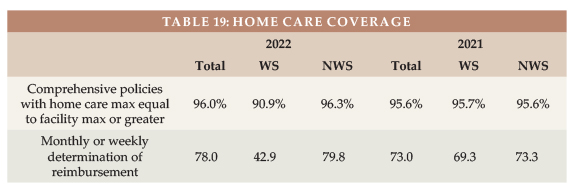
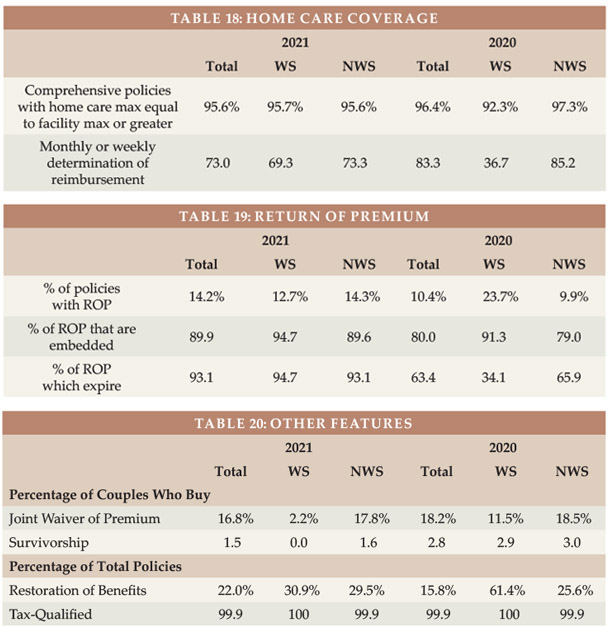
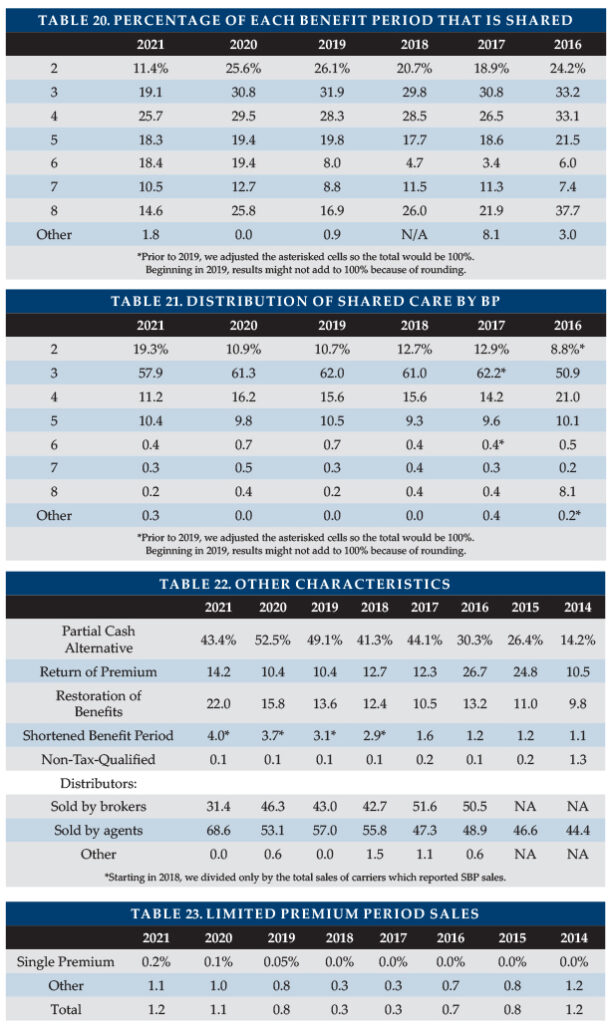
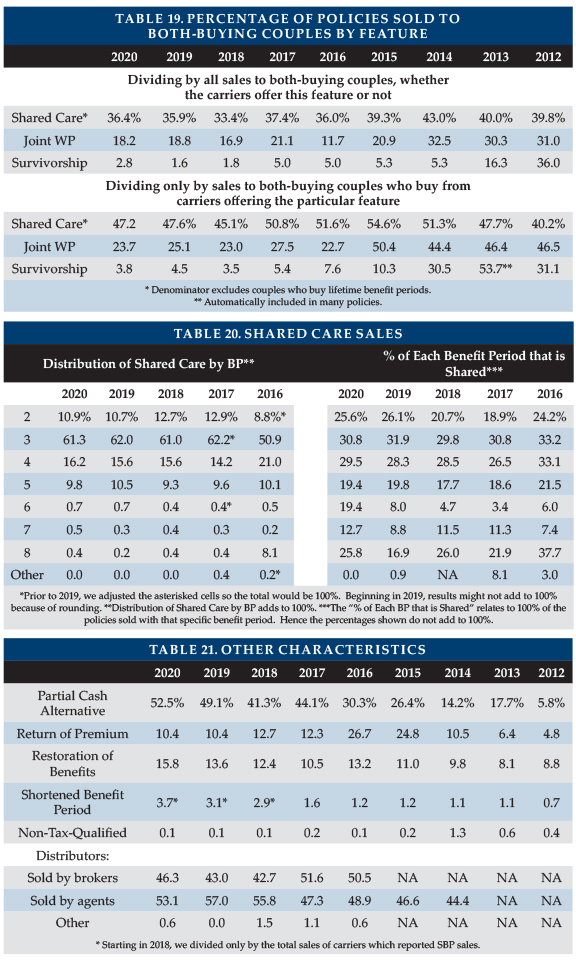
Type of Home Care Coverage Table 19 summarizes sales by type of home care coverage and shows the frequency of monthly determination of benefits. Long ago, WS policies’ home care maximum monthly benefits were 50 percent of the facility benefit; today they are generally identical.
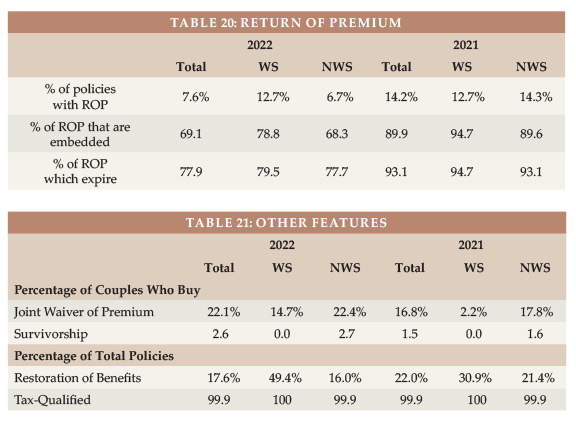
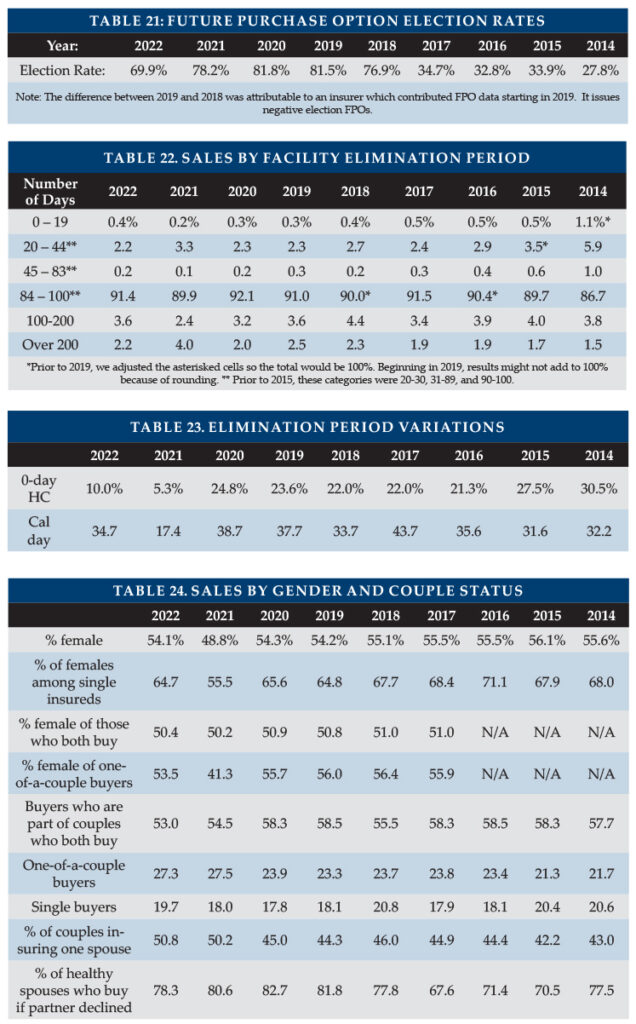
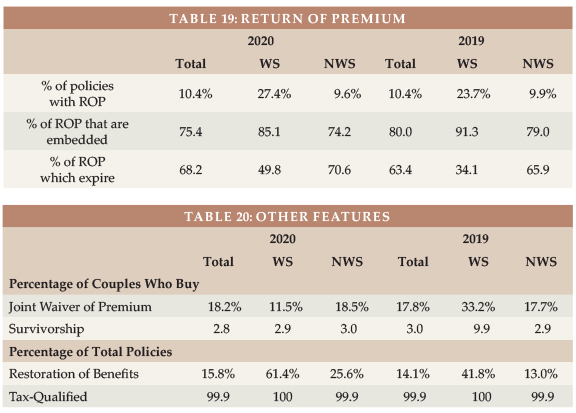
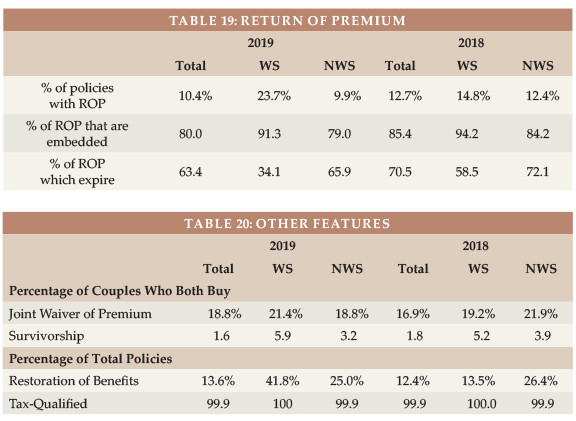
Other Features Table 20 shows that most Return of Premium (ROP) features are automatically included and phase out before death would be likely. ROP with expiring death benefits may provide an inexpensive way to encourage more young people to buy LTCI but does not address the buyer’s concern that they might pay all their life, then die in their 90s without qualifying for benefits.
Table 21 shows lower Joint Waiver of Premium and Survivorship sales to couples in the WS market than in the NWS market. Some products automatically provide Joint Waiver of Premium if a couple buys identical coverage or if a couple buys Shared Care. Employers sometimes are disinclined to add an optional couples’ feature because they are already contributing more money to cover both a married employee and that employee’s spouse than the cost for a single employee the same age.
CLOSING We thank insurance company staff for submitting the data and responding to questions promptly. We also thank Sophia Fosdick and Quentin Clemens of Milliman for managing the data expertly.
We reviewed data for reasonableness. Nonetheless, we cannot assure that all data is accurate. If you have suggestions for improving this survey, please contact one of the authors.
The 2024 Milliman Long Term Care Insurance Survey is the 26th consecutive annual review of stand-alone long term care insurance (LTCI) published by Broker World magazine. It analyzes the marketplace, reports sales distributions, and describes available products. More discussion of worksite sales, including a comparison of worksite sales distributions vs. non-worksite sales distributions will be in Broker World magazine’s September/October issue.
Unless otherwise indicated, references are solely to U.S. stand-alone LTCI sales, excluding exercised future purchase options (FPOs) or other changes to existing coverage. “Stand-alone” refers to LTCI policies that do not include death benefits (other than returning premiums upon death or waiving a surviving spouse’s premiums) or annuity or disability income benefits. Where referenced, “combo” or “combination” products provide LTCI combined with life insurance or annuity coverage. “Linked benefit” policies are combo policies which can allow more than the death benefit or annuity account value to be used for long-term care (LTC).
All references to sales in terms of “premium” refer to “annualized” premium (1 x annual; 2 x semi-annual; 4 x quarterly; 12 x monthly), even if only one monthly premium was received before year-end. “WCF” refers to the “Washington Cares Fund,” explained in the Market Perspective section.
Highlights from this year’s survey As discussed in our survey of 2021 sales, the WCF stimulated tremendous market demand in the state of Washington, causing sales distributions to vary greatly from history (as one example, more sales to males than to females). In 2022, some participants’ sales distributions continued to be influenced by a backlog of 2021 applications. The 2023 sales distributions in this year’s survey should have no such influence.
Participants Seven insurers (Bankers Life, Knights of Columbus, Mutual of Omaha, National Guardian Life, New York Life, Northwestern, and Thrivent) participated, providing broadly to stand-alone sales distributions reported herein. Total 2023 sales data includes one additional contributor and 2023 inforce data includes two additional contributors.
Our worksite sales reflect the total industry, but our worksite sales distributions do not reflect low-price worksite programs; hence, our worksite sales distributions are not characteristic of the entire worksite market.
The following ten insurers contributed to our combination sales data: AFLAC, John Hancock, Mass Mutual, New York Life, Nationwide, Northwestern Mutual (Northwestern), OneAmerica, Securian, Trustmark and United of Omaha.
Sales Summary
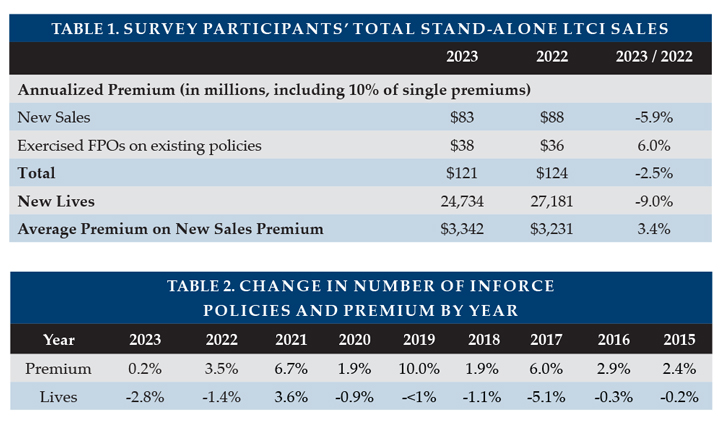
As seen in Table 1, contributors reported total stand-alone LTCI annualized new premium sales of $121 million in 2023 (including exercised FPOs except FPOs for insurers no longer selling LTCI and counting 10 percent of single premium), which is 2.5 percent less than the contributors’ reported sales of $124 million in 2022. The 2.5 percent drop reflects a 5.9 percent decrease for premium on new LTCI policies, partly offset by a 6 percent increase in FPOs and single premium.
The 2023 sales to 24,734 new insureds is 9 percent lower than 2022 sales to 27,181 new insureds, resulting in an 3.4 percent increase in average premium per new insured (excluding FPOs).
The percentage of 2023 sales that occurred in the worksite were the lowest ever in our sales survey. We observe that life insurance policies with LTCI or chronic illness riders are more commonly sold in this market.
Including FPO elections, Northwestern accounted for 48 percent of annualized new premium. Mutual of Omaha continued to lead in annualized premium from new policies and accounted for 30 percent of new insureds in 2023.
Although our sales survey covers essentially the entire stand-alone LTCI market, the ten insurers contributing combo sales are a smaller percentage of the combo market. LIMRA provided broader information about the combined life/LTCI market to supplement the data reported by contributors in our survey.
Reflecting nine entities’ data, the number of inforce insureds dropped 2.8 percent while annualized premium increased 0.2 percent. Inforce premium rises due to sales, price increases, and benefit increases (including FPOs), and falls from lapses, reductions in coverage, deaths, and shifts to paid-up status. The number of people with stand-alone coverage increased through 2014, but, as shown in Table 2, has decreased annually since then except for the 2021 aberration. However, inforce premium has continued to increase each year due to inforce price increases and higher prices for new policies.
Collectively, eight participants paid 9.3 percent more in claims in 2023 than in 2022. Overall, the stand-alone LTCI industry incurred $15.0 billion in claims in 2022 based on companies’ statutory annual filings, a 10.6 percent increase over 2021, which raises the running total of incurred claims since 1991 to $196.0 billion (2022 claims of $15.0 billion plus total of $180.9 billion from our prior year’s article).
About the Survey This article is arranged in the following sections:
Highlights provides a high-level view of results.
Market Perspective provides insights into the LTCI market.
Claims presents industry-level claims data.
Sales Statistical Analysis presents industry-level sales distributions reflecting data from 8 insurers.
Partnership Programs discusses the impact of the state partnerships for LTCI.
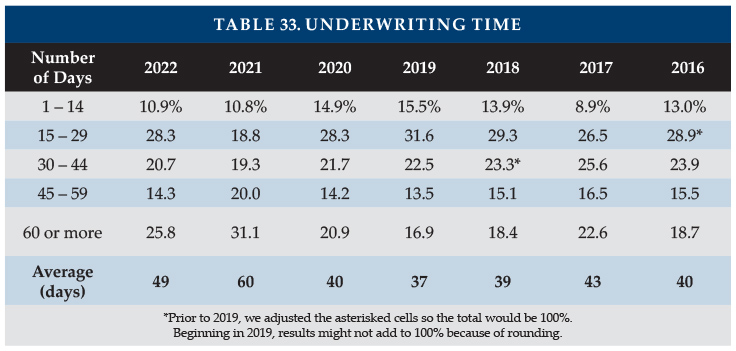
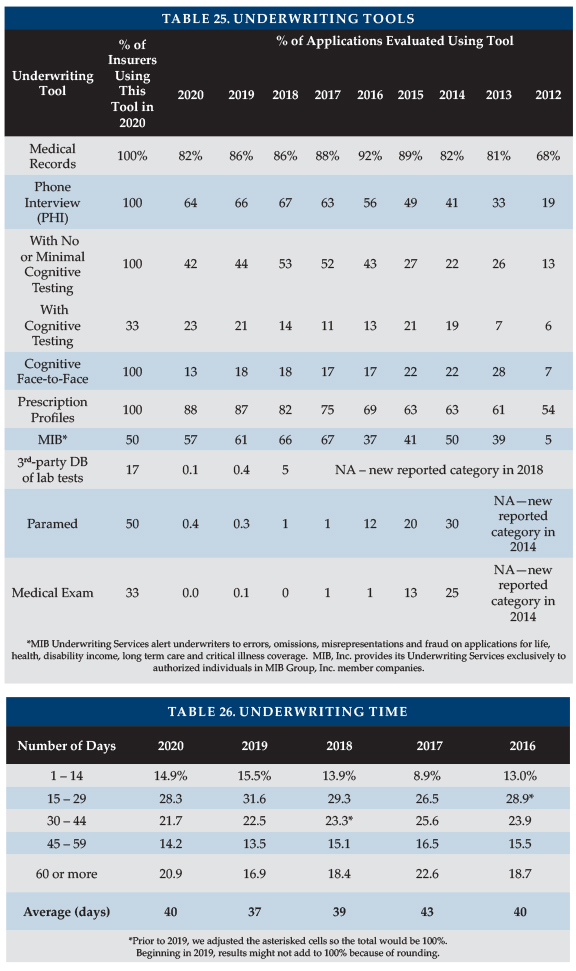
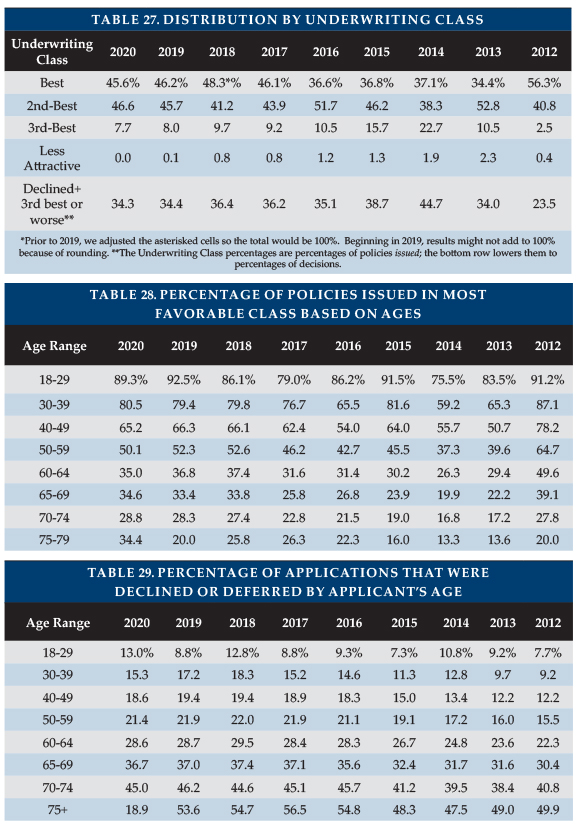
Underwriting Data discusses underwriting decisions, turn-around times and tools.
Product Exhibit shows, for 6 insurers: financial ratings, LTCI sales and inforce policies, and product details.
Product Details, a row-by-row definition of the product exhibit entries, with some commentary.
Premium Exhibit shows lifetime annual premiums for each insurer’s most common underwriting class, for issue ages 40, 50, 60, and 70 for single females, single males, and female/male couples (assuming both buy at the same age), based on $100 per day (or closest equivalent weekly or monthly) benefit, 90-day facility and most common home care elimination period, three-year and five-year benefit periods or $100,000 and $200,000 maximum lifetime buckets, with and without Shared Care and with flat benefits or automatic three or five percent annual compound benefit increases for life. Worksite premiums do not reflect any worksite-specific discount, though some carriers offer this.
Premium Adjustments (from our Premium Exhibit prices) by underwriting class for each participant.
Distribution by underwriting class for each participant. Depending upon the product shown for an insurer in the Product Exhibit, we sometimes adjust that insurer’s underwriting distribution to provide readers a better expectation of likely results if they submit an application in the coming year and to line up with the prices we display. For example, if the Product Exhibit shows only a new product which has only one underwriting class (hence one price), but the insurer’s data partly or solely reflect an older product with three underwriting classifications, we might choose to show “100 percent” in their best (only) underwriting class.
State-by-state results show the percentage of sales by state, average premium by state and percentage of policies qualifying for Partnership by state.
MARKET PERSPECTIVE (more detail in subsequent parts of the article) Washington State’s “Washington Cares Fund” (WCF) stimulated tremendous demand for private LTCI from individuals and businesses in Washington in 2021. WCF imposes a 0.58 percent payroll tax to fund a $36,500 lifetime benefit to pay for care (intended to inflate according to the Washington consumer price index) as defined in the Revised Code of Washington 50B.04. People who purchased private stand-alone or combination LTCI by November 1, 2021 could file to be exempt from the tax. Because the WCF does not require policies to be kept in force to maintain an exemption, we collected data from contributors to study cumulative lapse rates through January 2024 (varying slightly among insurers) from 2021 sales. For the purposes of summarizing data, we segmented the lapse rate data into two groups depending on the level of lapse rates outside of Washington over the more than two-year period as follows:
“Normally-low” lapses, where lapse rates outside of Washington were roughly eight percent.
“Normally-high” lapses, where lapse rates outside of Washington were roughly 42 percent.
Table 3 shows results varied between blocks with normally-low lapses and blocks with normally-high lapses (such as some worksite programs). Blocks with normally-low lapses experienced a higher lapse rate for Washington sales than corresponding sales outside Washington, 2.37 times as much for stand-alone policies and 1.78 times as much for combo policies. On the other hand, blocks with normally-high lapse rates showed lapse rates were 39 percent lower for Washington sales than corresponding sales outside Washington. Early policy duration lapse rates that are higher (lower) than anticipated may depress (increase) unit profitability, as renewal premium flow is reduced. Underwriting and issue expenses are harder (easier) to amortize.
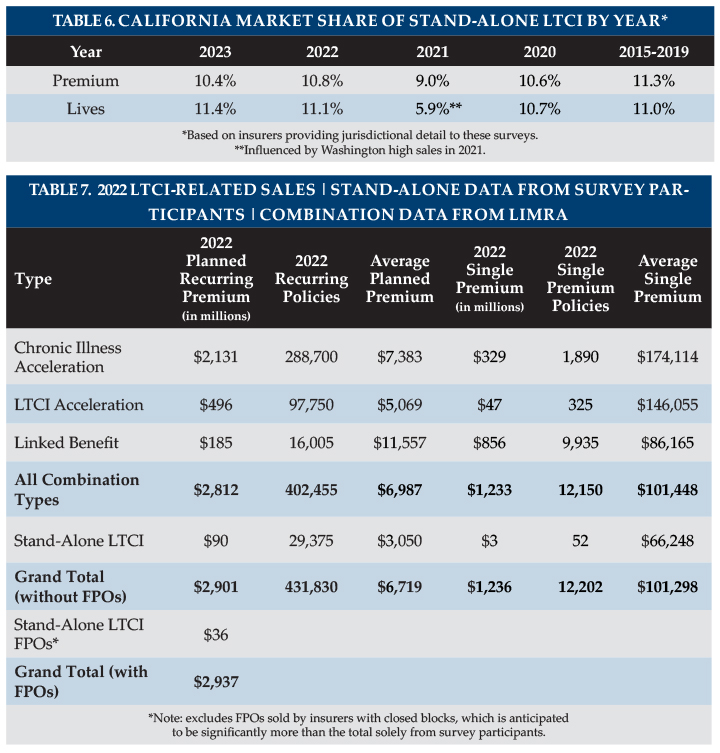
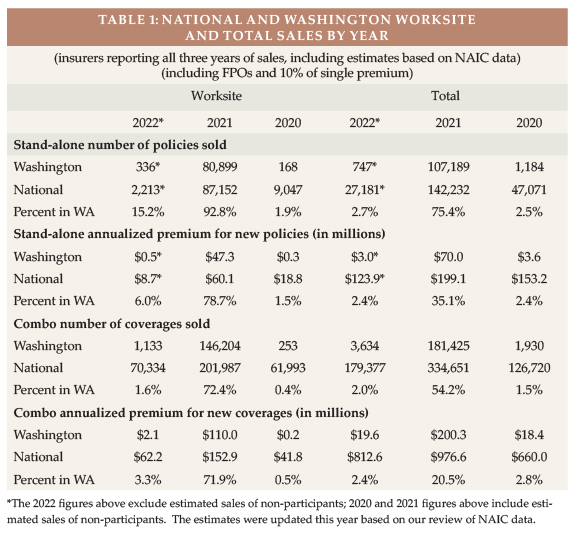
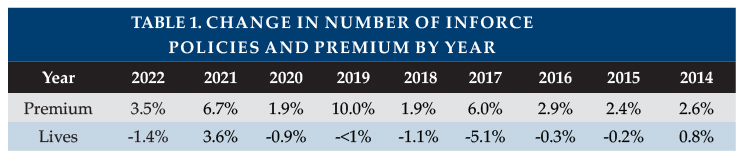
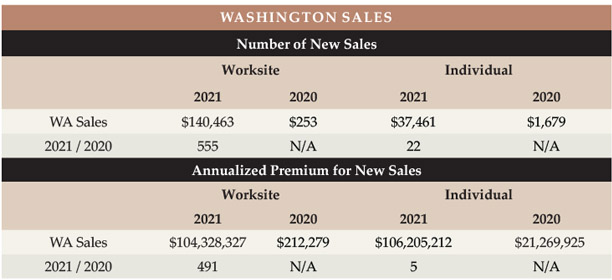
Table 4 shows the concentration of sales in Washington (for premiums and lives) from 2015 to 2023. In 2023, Washington sales continued to account for a higher percentage of new business (three percent of premium and 4.2 percent of lives) than in 2015-2019 (2.3 percent of premium and 2.4 percent of lives). As Washington’s market share of lives increased more than its market share of premiums, Washington’s average premium has lowered compared to other jurisdictions. Six of the seven insurers that contributed state distributions showed significantly larger Washington market share (in terms of new policies sold) in 2023 than in 2019.
Based on conversations with some brokers (special thanks for Carolyn Olson for her insights), we believe many people bought new larger policies in 2023 to replace small policies originally purchased in 2021. We will continue to monitor Washington’s market share in future years.
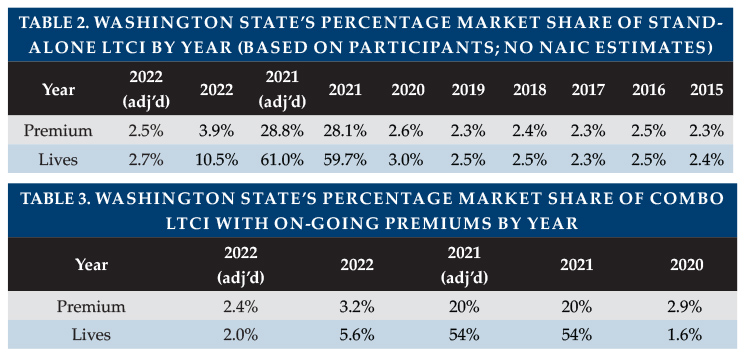
Table 5 shows the sales market share (for premiums and lives) from 2015 to 2023 in two neighboring states to Washington—Idaho and Oregon—to analyze the sales impact of the WCF in these states. Note in 2022, the WCF was amended to allow out-of-state residents who work in Washington to file for an exemption.
Our Idaho data continues to show increased market share in 2023 compared to 2020 and prior, whereas Oregon shows little difference across the years. However, as noted above, our jurisdiction distributions do not reflect the worksite-focused insurers; inclusion of worksite data might have shown more impact in Idaho and Oregon.
Table 6 shows the sales market share (for premiums and lives) from 2015 to 2023 in California to analyze whether there was any impact on sales due to the feasibility studies examining a potential new statewide LTCI program1,2. The most recent study was completed in 2023, in response to California AB5673 signed in October 2019, which called for a task force (TF) to “examine the components necessary to design and implement a statewide long term care insurance program.” The TF’s first meeting was in March 2021 and as it proceeded, more and more publicity ensued. As one example of the increased publicity, in August 2023, California Insurance Commissioner Ricardo Lara issued a warning letter4 regarding complaints related to “misleading marketing and communications by some long term care insurers and agents in connection with the work of the California Long Term Care Insurance Task Force.”
If the TF work stimulated sales, we might expect younger people to buy private LTCI and California’s market share by number of lives to increase more than its market share of annualized premium (similar to the pattern observed for Washington sales in 2021). Table 6 does appear to exhibit some of this pattern in recent years. In 2023 California’s market share by number of lives is the second highest and its market share by premium is the second lowest since 2015 (ignoring the 2021 aberration influenced by Washington sales).
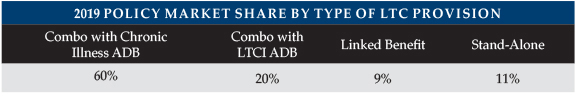
To help provide perspective on the stand-alone market, we continued our recent history of reviewing life insurance sales with LTC-related provisions. These include:
“Chronic Illness Acceleration” represents features which qualify under §101(g). They are prohibited to be marketed as LTCI per NAIC regulation, hence do not require brokers to be LTCI-certified. They allow a portion of the death benefit (depending on the product, perhaps as much as 100 percent) to be used for LTC-related expenses and generally use a cash-indemnity design.
“LTCI Acceleration” features under §7702(B) can be marketed as LTCI and require brokers to be LTCI-certified. They allow a portion of the death benefit (usually one to four percent per month, generally up to 100 percent of the death benefit) to be used for LTC.
“Linked-Benefit” features allow more than the death benefit to be used for LTC, in one (or both) of two ways. First, they might include automatic annual increases to maximum benefits (such as simple or compound increases), where the additional benefits may (or may not) reduce the death benefit. Second, they may continue LTC benefits even after the death benefit has been used up. Nearly all linked-benefit purchasers in 2022 (98.2 percent according to LIMRA) chose either benefit increases or extension of benefits or both.
Although we cover essentially the entire stand-alone LTCI market, the ten insurers contributing combo sales are a much smaller percentage of the market, hence may not be characteristic of the full market. One insurer reported a much lower average size in 2023, after having reported first-year dump-ins as new annualized premium in 2022. If we remove that outlier, the increase in annualized premium was 38 percent and the increase in policies sold was 26 percent, reflecting a 9.2 percent increase in average premium to $2,965. The increase in average new premium may reflect more 10-year-pay policies, an older average issue age, etc. Prices in the market have been dropping, resulting in a lower cost for whatever monthly maximum LTC benefit is desired. It is particularly interesting that the average premium rose despite the lower unit prices. Our single premium combo participants experienced a 5.4 percent increase in new annualized premiums, an 3.5 percent increase in the number of policies sold, and a 1.8 percent increase in average premium per policy. We do not get statistical breakdown of combo sales.
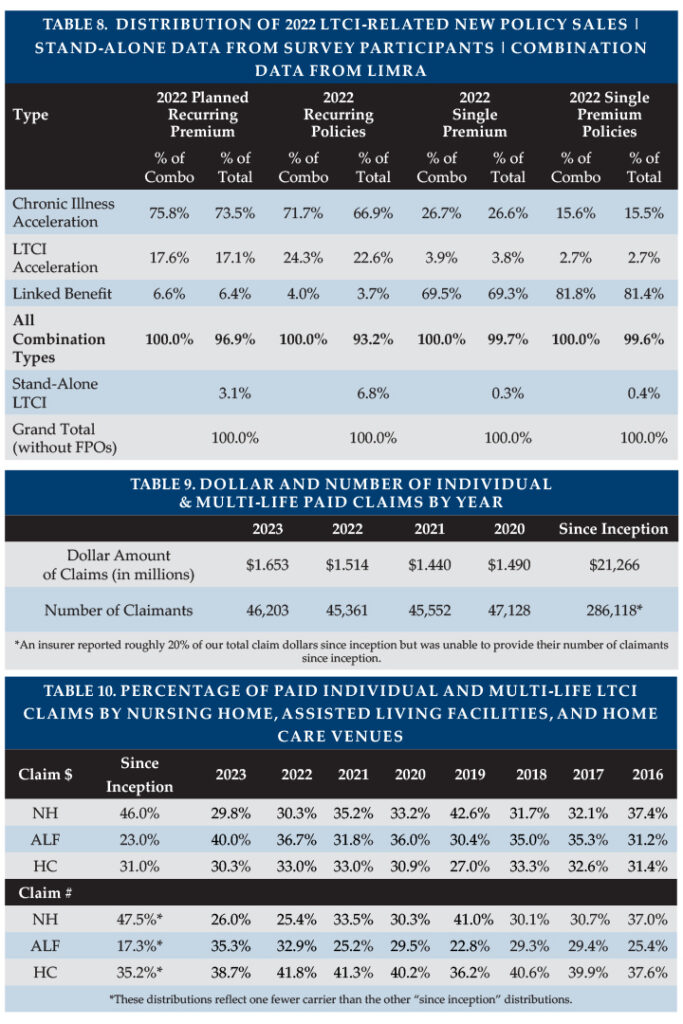
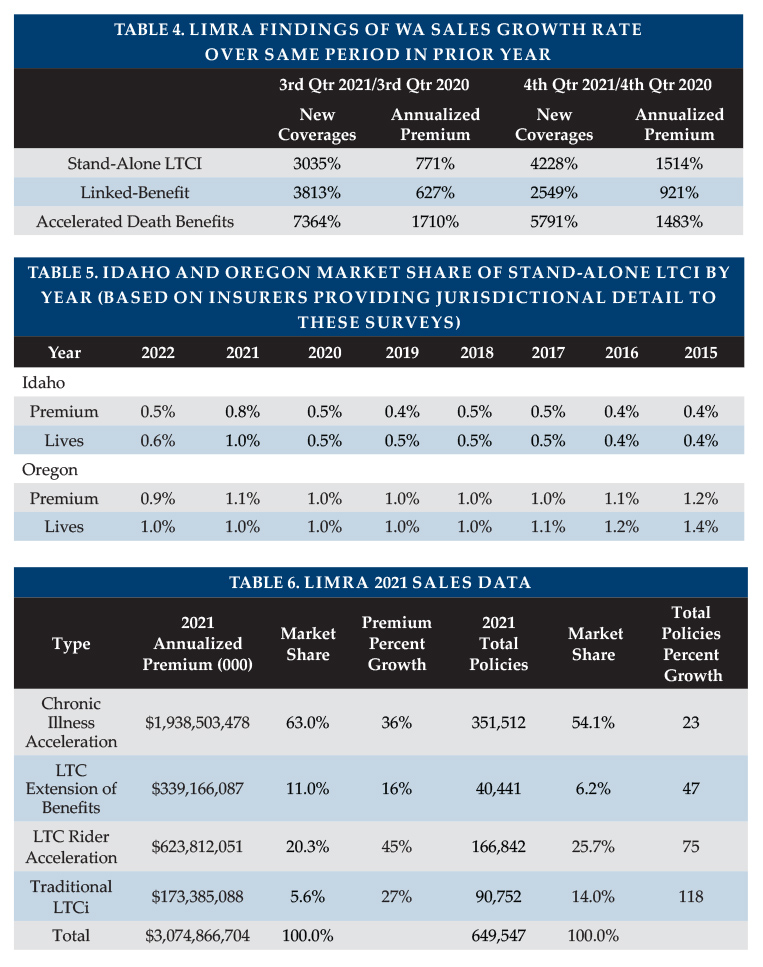
LIMRA kindly shared its 2022 combination product sales findings. Tables 7 and 8 summarize the stand-alone LTCI data from our survey alongside the LIMRA combination product data. Table 8 shows that 89.5 percent of the recurring premium policies (and more than 90 percent of the associated premium) with a LTCI-related feature were limited to acceleration of the death benefit. Of these, the vast majority were Chronic Illness riders because they can be added at no cost and without limiting distribution to LTCI-certified brokers.
Of the policies that can be marketed as LTCI, 68 percent of the recurring premium policies are on policy forms that offer only LTCI Acceleration features, whereas 96 percent of the single premium policy forms also offer extended LTCI benefits after the death benefit has been used up as LTCI.
Linked-Benefit (referred to as “LTCI Extension” by LIMRA) sales together with Stand-alone LTCI sales account for 12.4 percent of policies (including single premium policies).
Our 2022 data differs from LIMRA because we had fewer insurers and more worksite sales with chronic illness features. Excluding worksite, we have 55 to 60 percent of LIMRA’s Linked-Benefit sales and a similar average size, adjusting for the carrier that reported dump-in premium as on-going. Similarly, we have about 40 percent of recurring premium policies with LTCI Acceleration and a similar average size, but have a very small portion of LTCI Acceleration single premium policies.
Excluding our worksite policies, we have 20 percent of LIMRA’s Chronic Illness cases, but only half as much premium. Adding our worksite policies, we have 45 percent of Chronic Illness cases but only 13 percent of premium because worksite cases have much lower premium.
Linked benefit and other combination products are attractive to consumers because if the insured never has an LTC-related claim, their beneficiary will receive a death benefit. They also are more likely than stand-alone LTCI to have indemnity benefits and guaranteed premiums.
Such policies generally cost more than stand-alone LTCI if there is comparable LTCI coverage at older ages (such as age 85). However, the price difference seems to be shrinking because higher interest rates and competition appear to be driving linked-benefit prices lower while stand-alone LTCI new business prices have generally increased in recent years, especially for one-of-a-couple sales. Because of their benefit increase features, stand-alone and linked-benefit products often provide more LTC protection at older attained ages than policies which provide LTCI only through an accelerated death benefit.
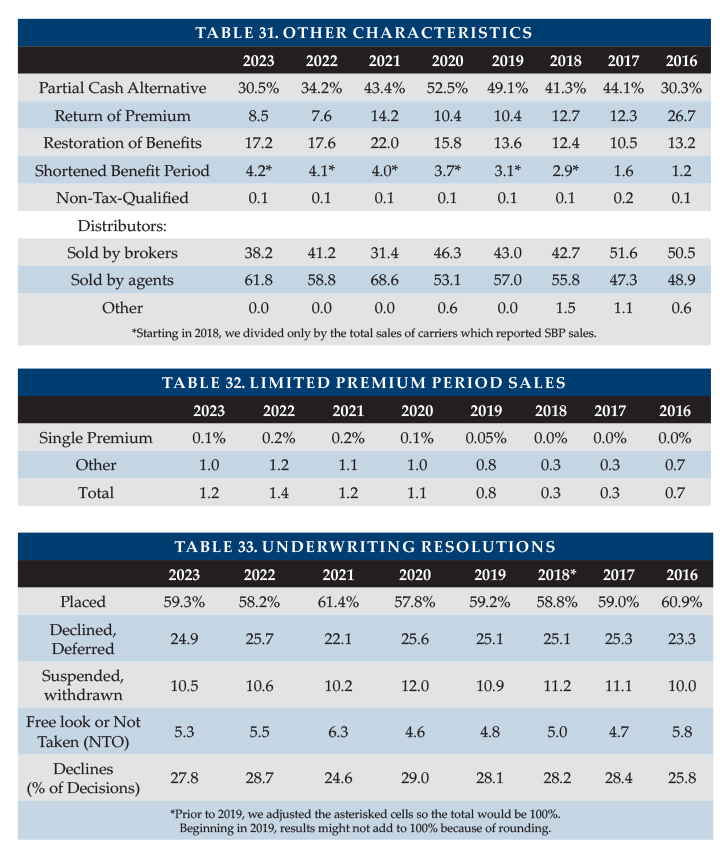
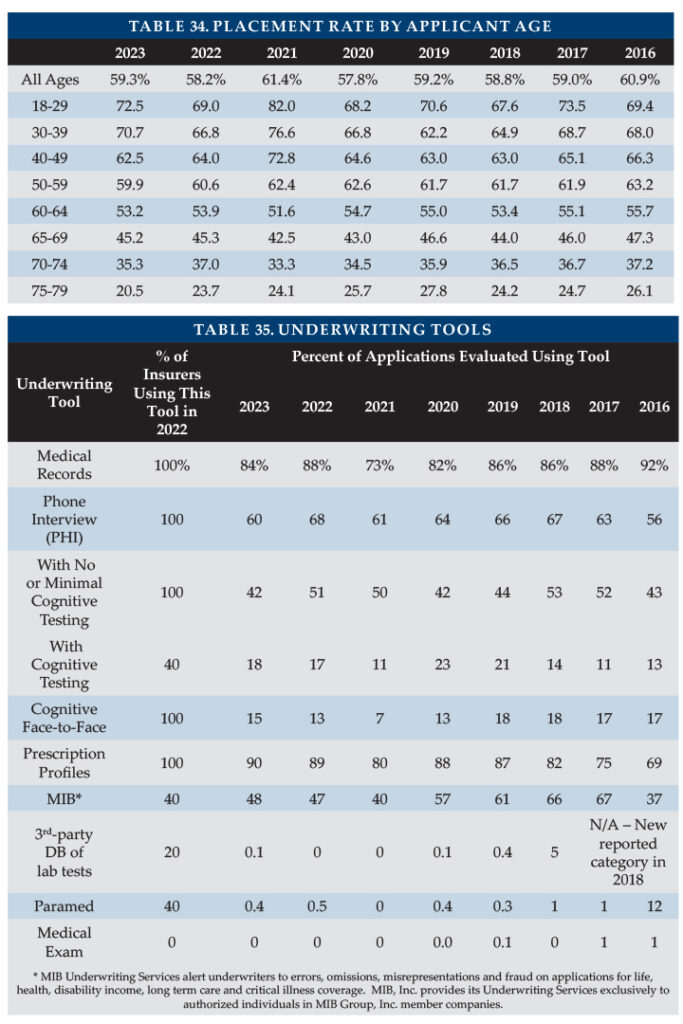
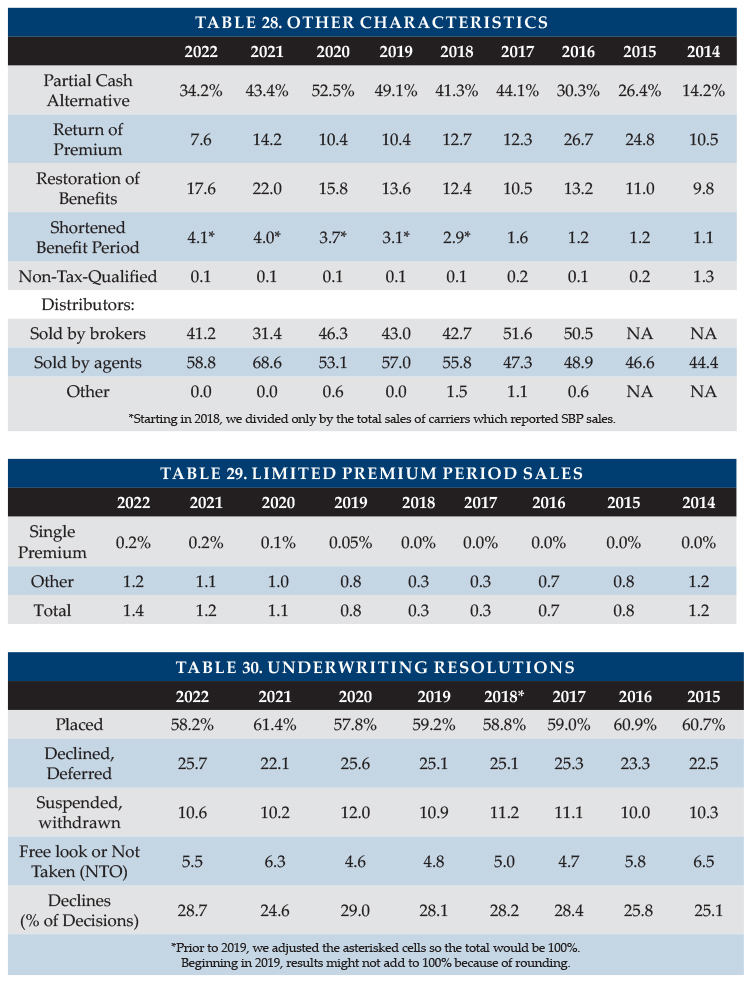
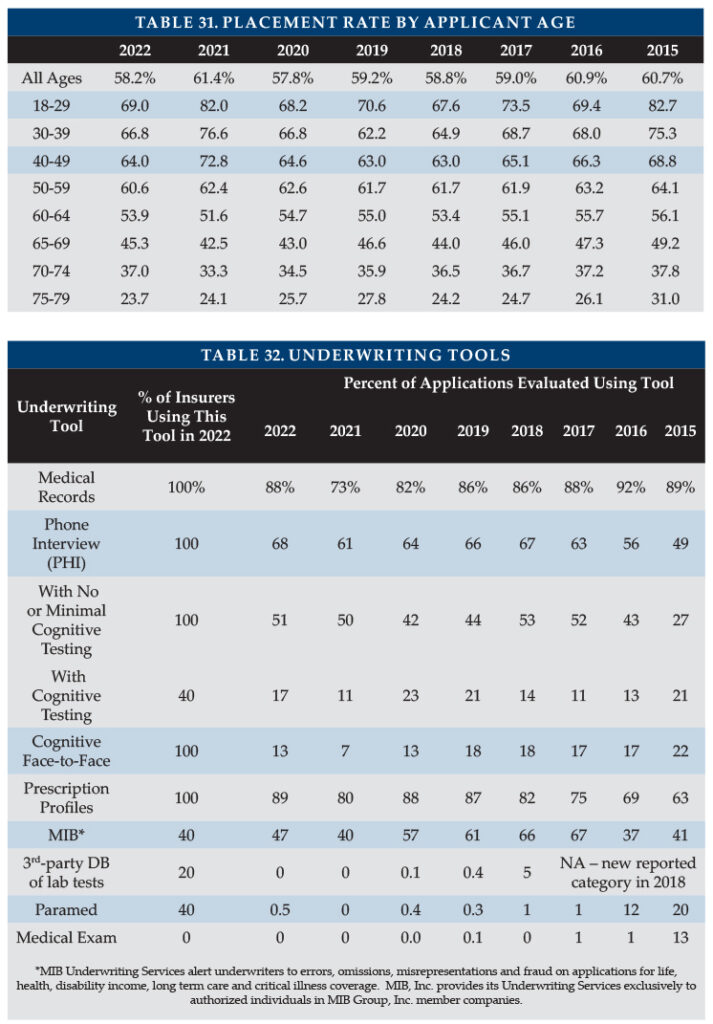
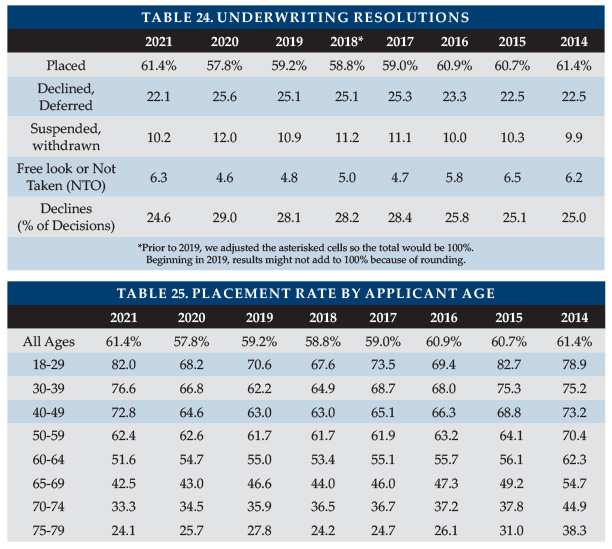
In 2023, 59.3 percent of stand-alone LTCi applications went inforce, the second straight increase since an all-time low of 54.1 percent (excluding Washington applications in 2021. Nonetheless, some may still view the placement rate as problematic. Prior to 2009, two-thirds of applications were placed despite higher average issue ages (however, in that era, there were more worksite cases with limited underwriting).
Higher placement ratios are critical to encourage financial advisors to mention LTCI to clients. The following opportunities can improve placement rates.
E-applications, which can speed submission and reduce processing time.
Uploading medical records via human application program interface (API).
Health pre-qualification by distributors, which can be aided by drill-down questions in on-line underwriting guides.
Requiring cash with the application.
Improved messaging regarding the value of LTCI and of buying now (rather than in the future).
Beyond Washinton and California, other states have taken action recently regarding possible state-run LTCI programs. Examples include:
Minnesota received a contractor’s report regarding options to increase access to long term care financing, services, and support.
New York SB 462 and Pennsylvania HB 844 would establish state insurance programs.
Kentucky HR 100, Massachusetts HB 652, and Vermont H.444 would establish bodies to study feasibility of a state insurance program. Connecticut SB245 would study LTC needs, not specifically LTCI.
Future state LTCI programs will likely differ from WCF in several respects. For example, based on draft laws and task force discussions in other states, they:
May not leave the window open for people to opt out by buying LTCI after the legislation has been signed.
May require that private LTCI policies remain in force to maintain exemption.
May narrow the range of private LTCI policies that qualify for exemption.
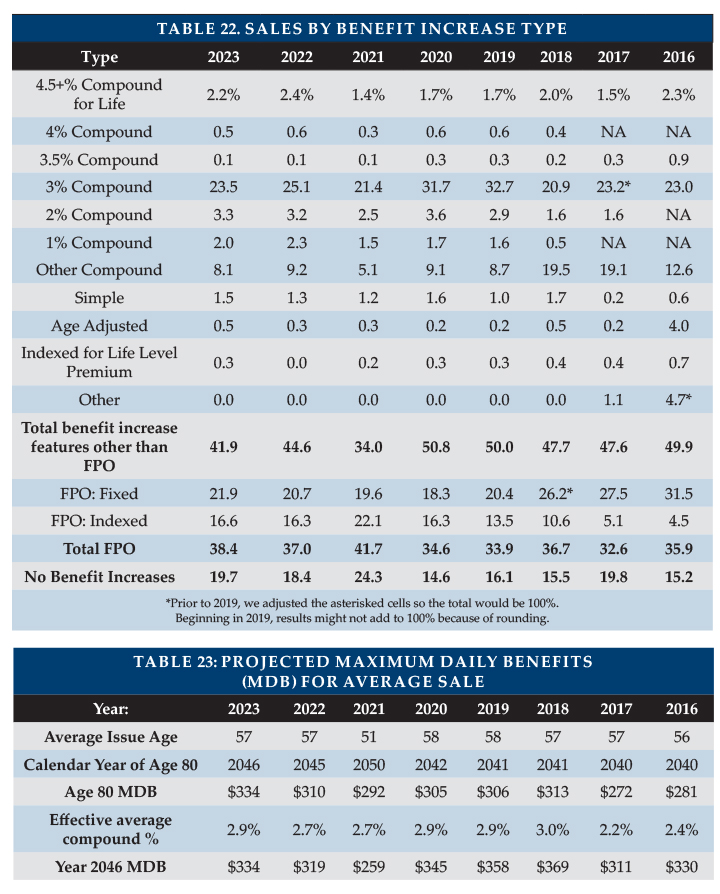
The FPO (future purchase option, a guaranteed, or a non-guaranteed board-approved, option, under specified conditions, to purchase additional coverage without demonstrating good health) election rate rose to 86.3 percent, which is in line with what the same insurers reported in the past.
Considering such FPOs and other increased coverage provisions, we project a maximum benefit at age 80 of $334/day for an average 57-year-old purchaser in 2023, which is equivalent to an average 2.9 percent compounded benefit increase between 2023 and 2046. Inflation appears to be more of a concern now. As discussed later, purchasers may be disappointed if the purchasing power of their LTCI policies deteriorates over time.
Current premiums are much more stable than past premiums, partly because today’s premiums reflect much more conservative assumptions based on far more credible data. The Policy Exhibit shows, for each insurer, how long ago the most recent policy was issued that has had a price increase and how long ago the currently-issued product was priced. No participant has raised prices for policies issued in 2017 or later. Additionally, it has been three years since any participant released new prices for new sales. Financial advisors may not be familiar with the greatly improved stability of LTCI premiums, hence may be reluctant to encourage clients to consider LTCI because the advisors fear steep price increases.
Some insurers of older inforce polices are also exploring strategies around rate stability. As one example, New York Life made old inforce blocks non-cancelable (guaranteed to have no future rate increases) in states which approved their full most recent (second) rate increase on those policies, even if the increase was required to be phased in over several years. This premium rate guarantee even applies to the oldest policyholders (ages 74 and older) who were exempted from the rate increase.
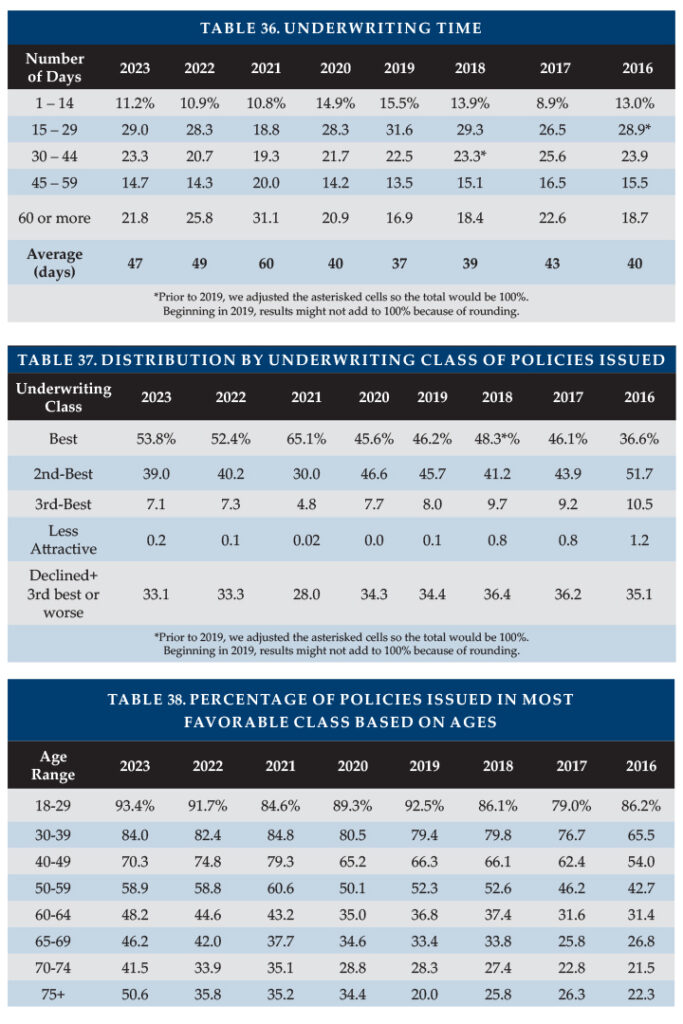
All insurers in our Product Exhibit offer coverage in all U.S. jurisdictions, except two of them do not offer policies in New York. This year, we asked insurers how many declines are successfully appealed. Three insurers responded, with percentages ranging from 2.7 to four percent. We asked what percentage of “non-frivolous” underwriting appeals are reversed, a question which insurers likely interpreted differently. One insurer’s data indicated 37 percent while another’s indicated 82 percent.
CLAIMS Independent Third-Party Review (IR) is intended to help assure that LTCI claims are paid appropriately. Since 2009 (in some jurisdictions), if an insurer concludes that a claimant is not chronically ill as defined in the LTCI policy, the insurer must inform the claimant of his/her right to appeal to IR, which is binding on insurers.
In many states, IR is not effective, either because the law was not adopted or because regulators have not set up the required panel of independent reviewer organizations (IROs). Nonetheless, a claimant could ask an insurer to agree to IR.
The Product Exhibit shows that most participants extend IR beyond statutory requirements (e.g., to policies issued prior to the effective date of IR). Some insurers hire IROs to provide another set of eyes as part of the insurer’s internal appeal process.
A very small percentage of claims go to IR. Some insurers say they have never had a request for IR.
We are not aware of regulators who track IR results, but Steve LaPierre, President of LTCI Independent Eligibility Review Specialists, LLC (LTCIIERS), the largest IR organization, reports that they upheld the insurer’s decision 98 percent of the time in 2022.
For comparison, a National Nurses United study of CA acute health claims1 indicates that IR upheld half of their denials. Acute health insurance and LTCI claims are denied for different reasons which likely explains much of the difference in the rate at which the insurers’ decisions are overturned.
The LTCI industry’s IR experience suggests that insurers, overall, are paying claims appropriately.
Eight participants reported 2023 claims. As some companies are not able to provide complete detailed data, some statistics reported below are more robust than others.
The eight entities’ combined individual and multi-life and group claim payments were 9.3 percent higher than in 2022, based upon 1.9 percent more claimants, resulting in a 7.2 percent increase in the average individual and multi-life claim payment. The average group claim payment saw a much larger 29 percent increase but reflects more volatility from a smaller number of claimants.
The LTCI industry has paid out benefits to policyholders far greater than indicated in the following statistics, because most claims are paid by insurers that do not currently sell LTCI.
Our claims represent about 10 percent of claims paid by the industry. LTCI claims paid by insurers no longer selling LTCI may differ significantly from the following statistics as their claimants are more likely to have facility-only coverage, be older, and/or have other different policy or demographic characteristics.
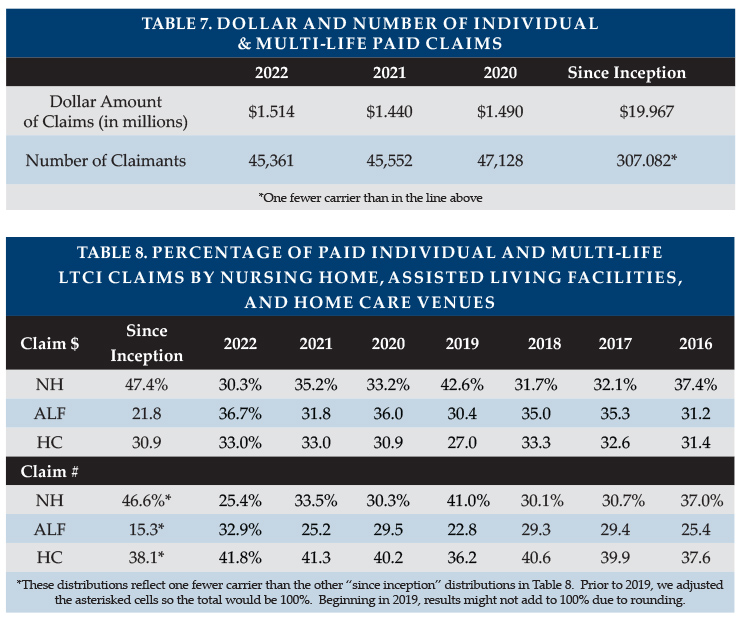
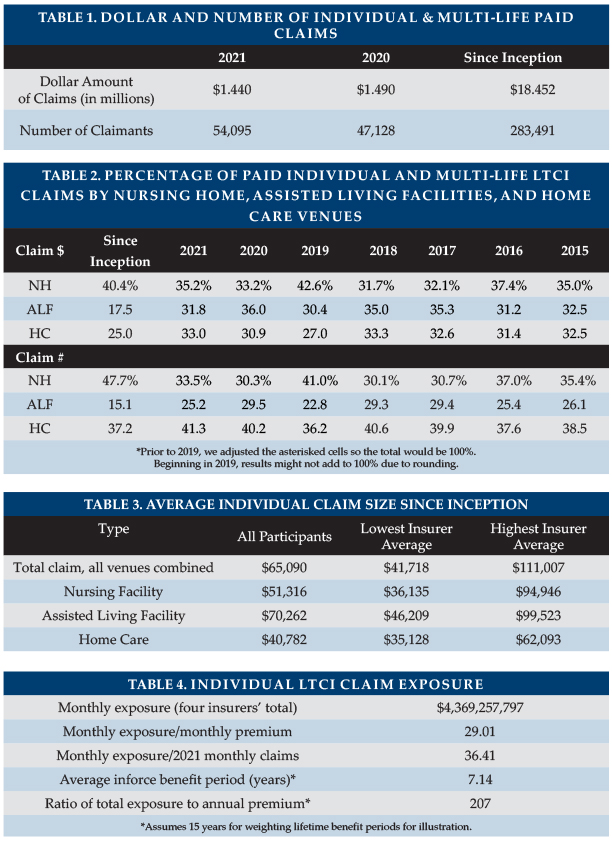
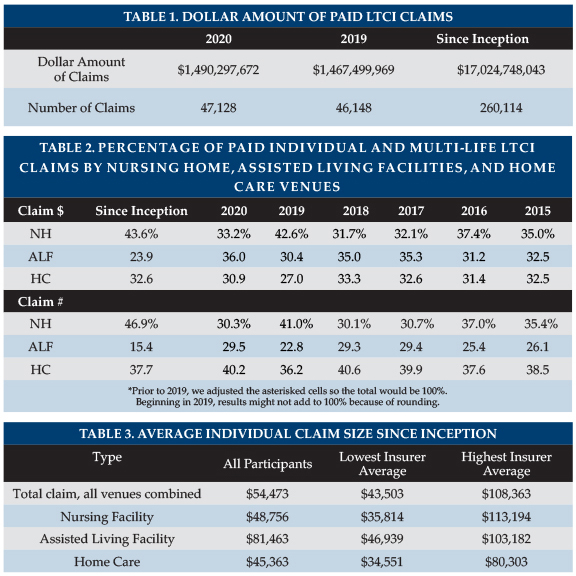
Table 9 shows the total dollar and number of reported individual and multi-life (not group) LTCI claims. Table 10 shows the percentage paid by venue. In both tables, “since inception” means since the insurer first started selling LTCI or as far back as they can report these results (for example, they may have changed claims administration systems and not be able to go all the way back to when they first processed claims).
Table 10 shows that home care and adult day care (collectively “HC” in Table 10) account for the highest percentage of 2023 claims (38.7 percent) but the second-most percentage of 2023 claim dollars (30.3 percent). Assisted Living Facilities (ALFs) account for the second-most percentage of 2023 claims (35.3 percent) but the highest percentage of claims dollars (40.0 percent). Despite the shift away from nursing homes to ALFs, nursing homes still account for the largest percentage of inception-to-date claims numbers (47.5 percent) and claims dollars (46.0 percent).
Trends can be obscured because different insurers may report claims data over the years and insurers refine how they report data. For example, we learned in 2021 that one insurer previously assigned all of a claimant’s benefits based on the venue in the claimant’s first month of claim, which implies the shift from NH to ALF since 2020 is greater than the table indicates.
In the distribution based on number of claims, a person who received care in more than one venue is counted once for each venue, but not double-counted in the total line. The average claimant is in 1.5 types of venues during the course of the claim; this does not recognize multiple providers within a single type of revenue (e.g., two nursing homes).
Six carriers reported the number of open individual claims at year-end. Open claims at year-end 2023 averaged 78 percent of the number of claimants served at any point during 2023, an increase from 70 percent the past few years.
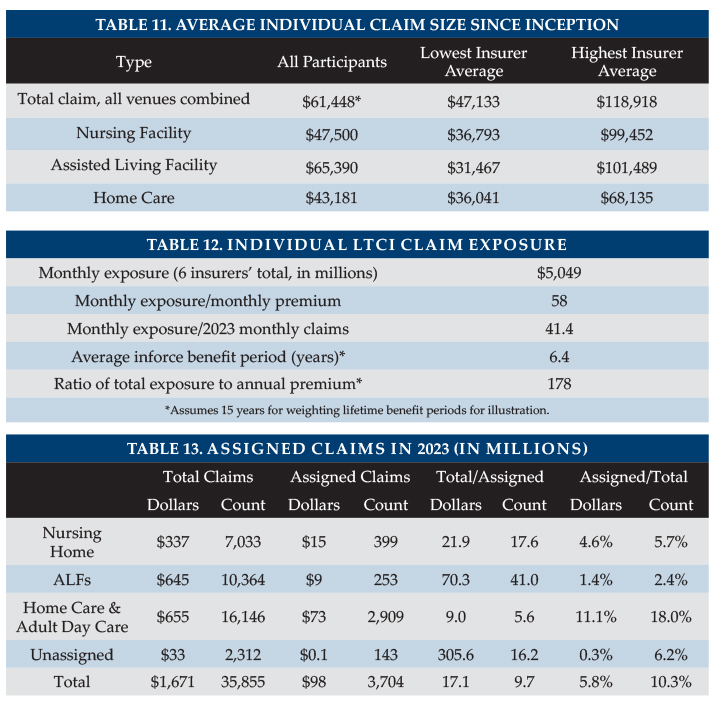
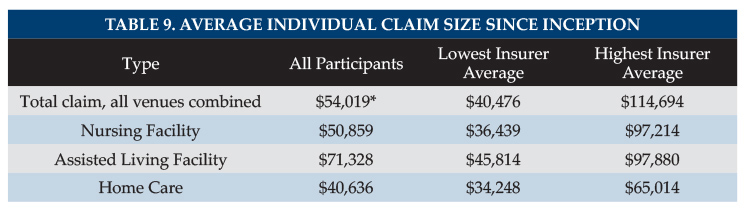
Table 11 shows average size individual claims since inception: that is, including older claims and reflecting all years of payment. One participant refined its reporting this year, causing comparisons to prior years to not be meaningful.
Because some claimants submit claims from more than one type of venue, the average total claim might be expected to exceed the average claim paid for any particular venue. Individual ALF claims stand out as high each year, probably because: a) ALF claims appear to have a longer duration compared with other venues. b) Nursing home costs are most likely to exceed the policy daily/monthly maximum, hence nursing home claims are most likely to understate actual cost of care. c) People who maximize the use of their maximum monthly benefits can generally spend as much in an ALF as in a nursing home. d) Although some surveys report that on average ALFs cost about half as much as nursing homes, ALFs may have an extra charge for a memory unit or for levels of assistance that align more closely with nursing home care.
Several insurers extend ALF coverage to policies which originally did not include ALF coverage, providing policyholders with significant flexibility at the time of claim but contributing to the insurers’ need for rate increases.
The following factors contribute to a large range of average claim by insurer (see Table 11):
Different markets (by affluence; worksite vs. individual; geography; etc.)
Demographic differences (gender; issue age; age of their block of business)
Distribution by benefit period, benefit increase feature, shared care, and elimination period. For example, one carrier has a higher average home care claim than its average facility claim, because people who added the home care rider were more likely to add compound “inflation” also.
Distribution by facility-only policies vs. 50 percent home care vs. 100 percent home care vs. home care only.
Differences in the ways insurers report claims.
The following factors cause our average claim sizes to be understated:
Approximately 16 percent of inception-to-date individual claims are still open and our data does not include reserve estimates for future payments on open claims.
People who recover, then go on claim again, are counted as multiple insureds, rather than adding their various claims together.
Besides being understated, average claims data does not reflect the value of LTCI benefits from some purchasers’ perspectives, because the many small claims drive down the average claim. LTCI provides significant financial yield for most people who need care one year or longer. A primary purpose of insurance is to protect against adverse results, so the amount of protection, as well as average claim, is important.
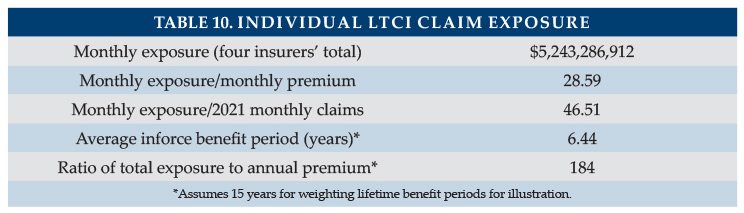
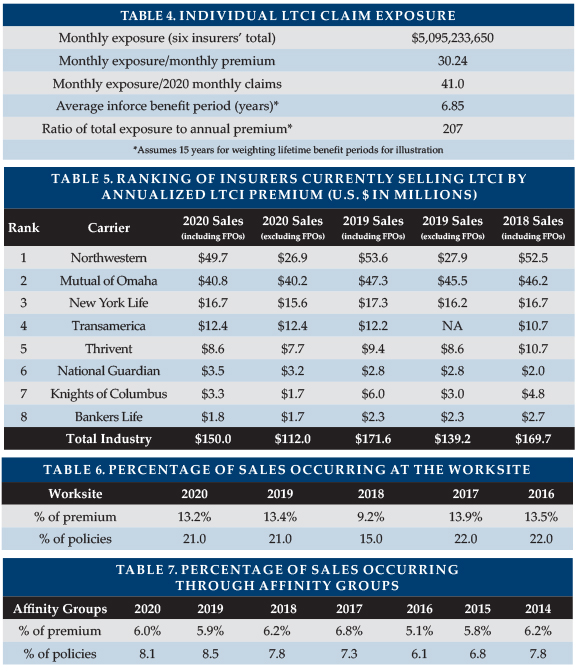
Six insurers provided current individual monthly LTCI claim exposure (note: the data reflects only initial monthly maximum for one insurer). As shown in Table 12, this figure is 28 times their corresponding monthly LTCI premium income and 41.4 times their 2023 LTCI monthly paid claims. Seven insurers contributed inforce distribution by benefit period. Treating endless (lifetime benefit periods) as a 15-year benefit period, their average inforce benefit period has reduced to 6.4 years, ignoring Shared Care. Increasing the assigned value of the endless benefit period by one year raises the average inforce benefit period approximately 0.23 years. With annual exposure 28 times annual premium and an average benefit period of 6.4 years, we estimate total exposure is 178 times annual premium.
The current average individual maximum monthly maximum benefit for claimants seems to be in the $4,900 to $8,500 range. Nursing home (NH) claims are more likely to use the policy’s maximum daily/monthly benefit than ALF claims because ALF daily/monthly costs are generally lower and because policies sometimes have lower maximums for ALFs. ALF claims correspondingly are more likely to use the policy maximum than are adult day care and home care claims.
A person might think LTC providers can fully answer the question “how much do insurers pay for LTC?” However, providers likely know only how much they receive from insurers (assigned payments), not amounts clients pay that is subsequently reimbursed from insurers. In this year’s survey, we decided to study assignments (Table 13). Five insurers contributed data.
Based on 35,855 claims, the reported data indicated 5.8 percent of claims dollars and 10.3 percent of the count of claims were assigned; in other words, total claim dollars are roughly 17 times what is assigned to providers and the total number of claims is 10 times the number that are assigned. We asked two insurers with large closed blocks (each larger than the data in our table) for their experience as additional data points for comparison. One insurer estimated similar percentages: roughly six percent of facility claim dollars and roughly 10 percent to 15 percent of home care claim dollars were assigned. The other insurer estimated that roughly 13 percent of their claim dollars were assigned.
Home care claims are roughly 4.5 times as likely to be assigned as facility claims, and, for each venue, small claims are more likely to be assigned than large claims.
It may be disadvantageous for providers when nursing home claims are assigned if the LTCI policy does not cover the full provider rate, as the provider would have to bill the family as well. Insurers may not prefer facility claims to be assigned if the facilities want to be paid in advance; in addition to the loss of potential investment income, insurers have difficulty recovering overpayments if a claimant does not stay in the facility for the full month. In contrast, home care claims are billed in arrears and policy benefit limits are more likely to exceed home care charges than nursing home charges.
SALES STATISTICAL ANALYSIS Bankers Life, Knights of Columbus, Mutual of Omaha, National Guardian, New York Life, Northwestern and Thrivent contributed significant background stand-alone LTCI sales data, but some were unable to contribute some data. LifeSecure provided only total stand-alone sales, not distributions.
Sales characteristics vary significantly among insurers based on market differences (individual vs. worksite, affluence, gender distribution, etc.). Year-to-year variations in policy feature distributions may reflect industry trends but may also reflect changes in participants, participant practices and designs, participant or worksite market shares, etc. The 2021 sales also exhibit major variance from historical results due to Washington sales. Statistical differences between the worksite and non-worksite sales will be reported in the September/October issue of Broker World.
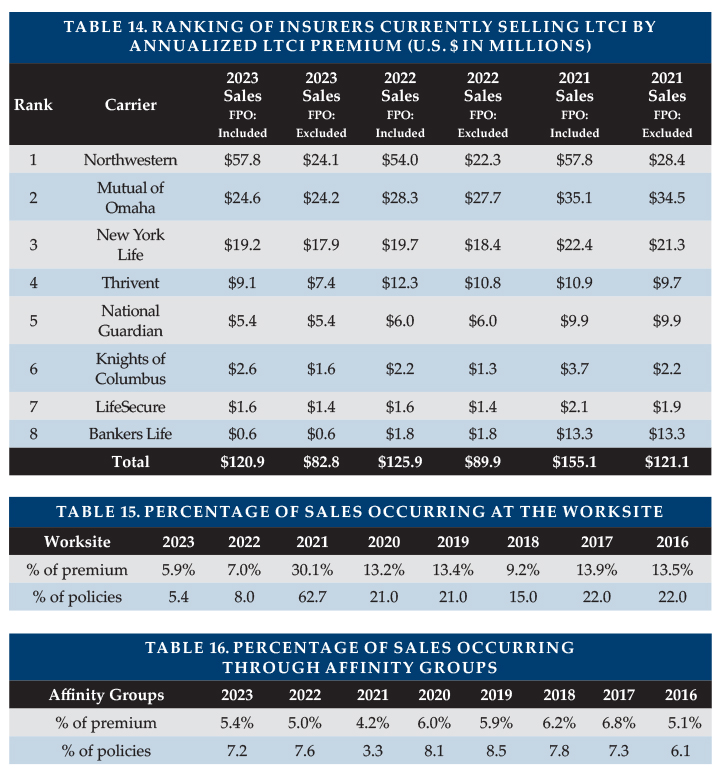
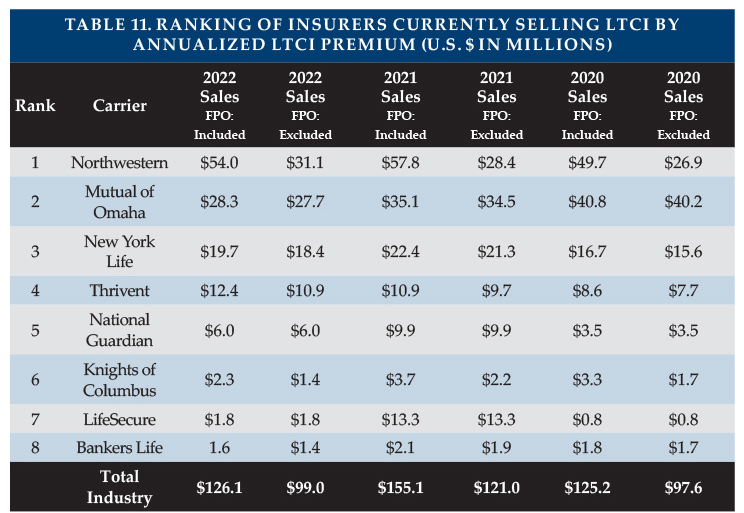
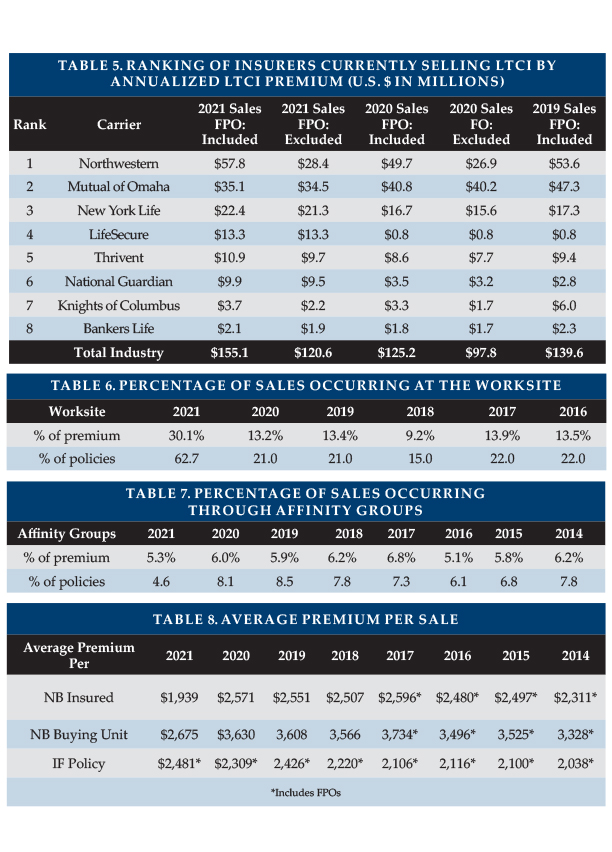
Market Share We include purchased increases on existing policies as new premium because new coverage is being issued. Table 14 shows 2023 new premium, both including and excluding FPOs.
The stand-alone market continues to consolidate, as well as shrink. Northwestern accounted for 48 percent of annualized new premium, while Mutual of Omaha maintained its lead in annualized premium from new policies (by $100k) while continuing to sell the most policies (29 percent; see Policy Exhibit). The top 3 insurers had 84 percent market share, compared to 81 percent in 2022 and 74 percent in 2021. Excluding FPOs, the concentration is lower, 80 percent in 2023. The premium in table 14 includes 100 percent of recurring premiums plus 10 percent of single premiums.
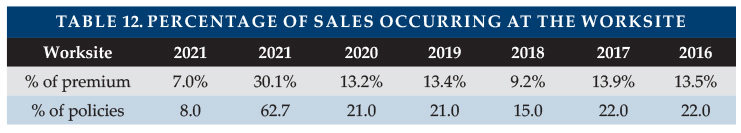
Worksite Market Share and Average Premium The percentage of 2023 sales that occurred in the worksite was the lowest ever, with four insurers reporting 2023 worksite sales. The worksite market has gravitated toward life insurance policies with an accelerated death benefit, as will be covered in the September/October article.
Worksite sales normally consist of three different markets as outlined below, the first two of which produce a higher percentage of new insureds than of new premiums.
Voluntary group coverage generally is less robust than individual coverage.
Core/Buy-Up programs have particularly young age distributions and modest coverage because a lot of people do not buy-up and are less likely to insure spouses.
Executive carve-out programs generally provide the most robust coverage. One-or two-couple executive carve-out sales may not qualify for a multi-life discount with some insurers, hence may not be labeled as worksite sales in submissions to our survey.
The amount of worksite sales reported, the FPO activity, the degree to which insurers report worksite distributions, and the distribution of worksite sales among the above-described sub-markets significantly impact sales characteristics. Our participants’ (insurers which provided sales distributions) average annual premium on new worksite policies was $2,271, but contributors that provided sales, but not distributions, had an average premium of $1,476. That average premium discrepancy makes clear that our sales distributions do not reflect the insurers focusing in the group voluntary and core/buy-up markets.,
The 5.9 percent of premium attributed to worksite sales in Table 15 includes FPOs. Limiting all premium to new policies, the worksite premium market share is 3.2 percent. More information about worksite sales will appear in Broker World magazine’s September/October issue.
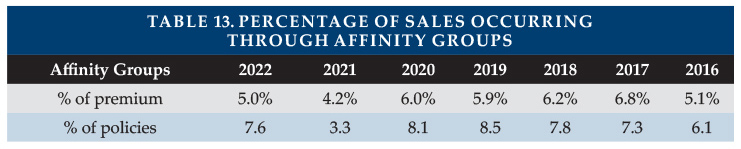
Affinity Market Share Affinity groups (non-employers such as associations) produced 5.4 percent of participants’ 2023 premium and 7.2 percent of policies.
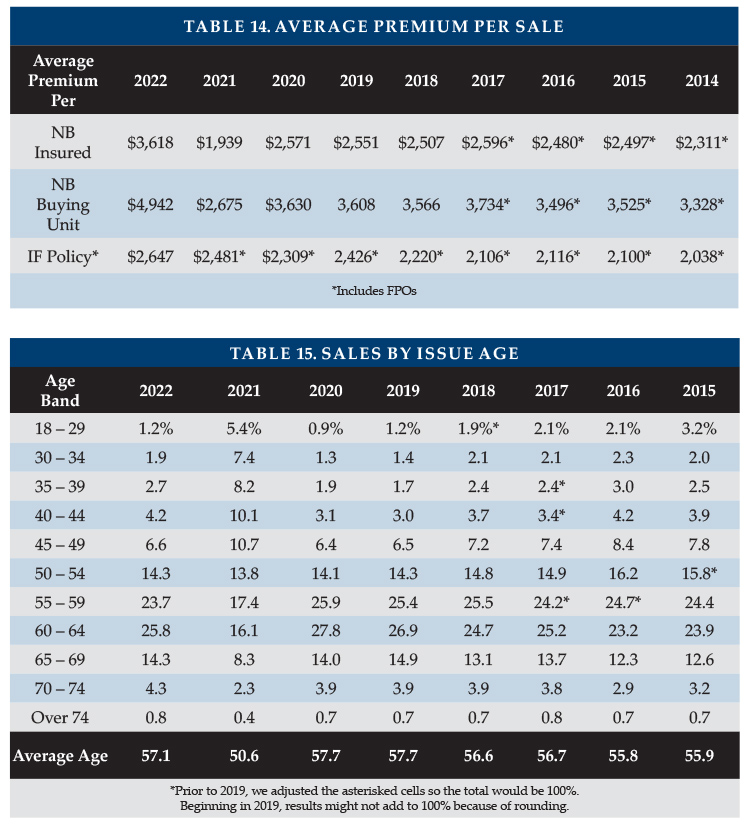
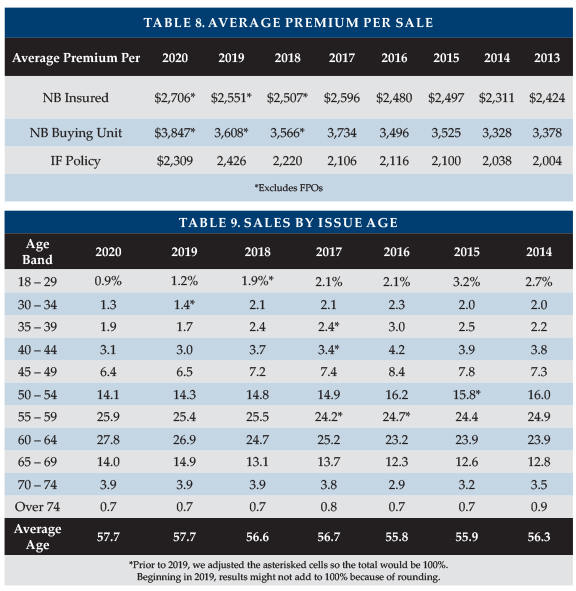
Characteristics of Policies Sold Average Annualized Premium Per Sale To determine the average annualized premium for new sales, we exclude FPOs and single premium policies, except where noted otherwise. As shown in Table 17, the average premiums in 2022 and 2023 have been higher relative to historical because of fewer small worksite policies and higher unit prices post-2020.
The influence of small worksite policies is greatly reduced now. Removing the primary insurer in that market produces an average premium per insured of $3,375, as shown in Table 17. Including this carrier produces an average premium of $3,342. Note, the difference between the average premium per buying unit and per insured is larger in the individual market because the individual market has more couples who both buy, which influences the results in Table 17 when reviewing results across the total market and individual market.
The jurisdiction with the lowest average new premium for participants in 2023 (including FPOs and counting 100 percent of single premiums) was Washington ($3,609), followed by Puerto Rico ($3,850), and Mississippi ($3,954). The jurisdiction with the highest average premium was Connecticut ($7,211), which would have been third if single premiums were excluded, followed by Wyoming ($7,167), Minnesota ($6,585), North Carolina ($5,991), Pennsylvania ($5,971) and Illinois ($5,926).
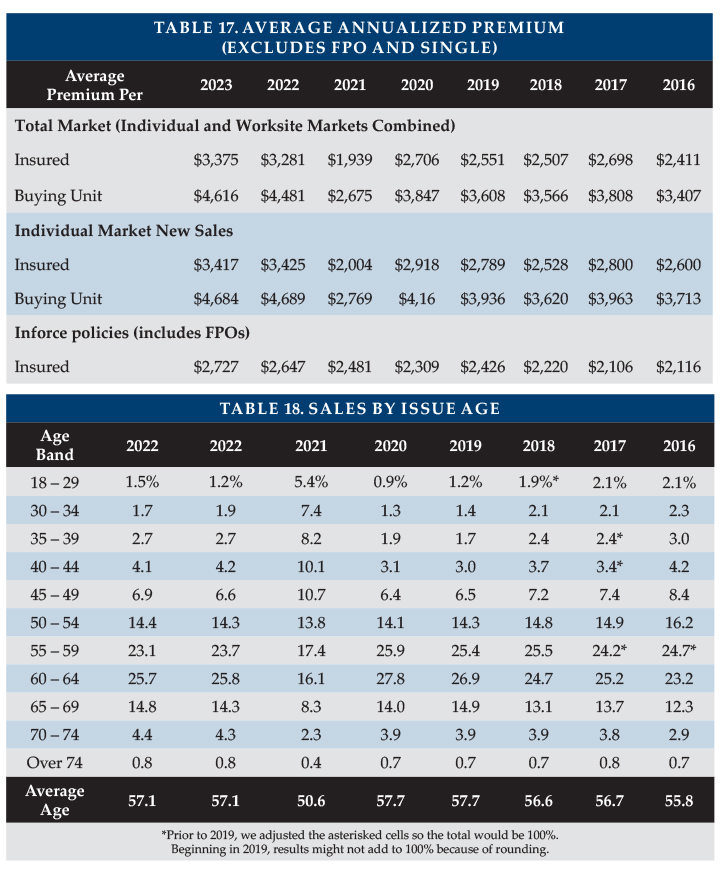
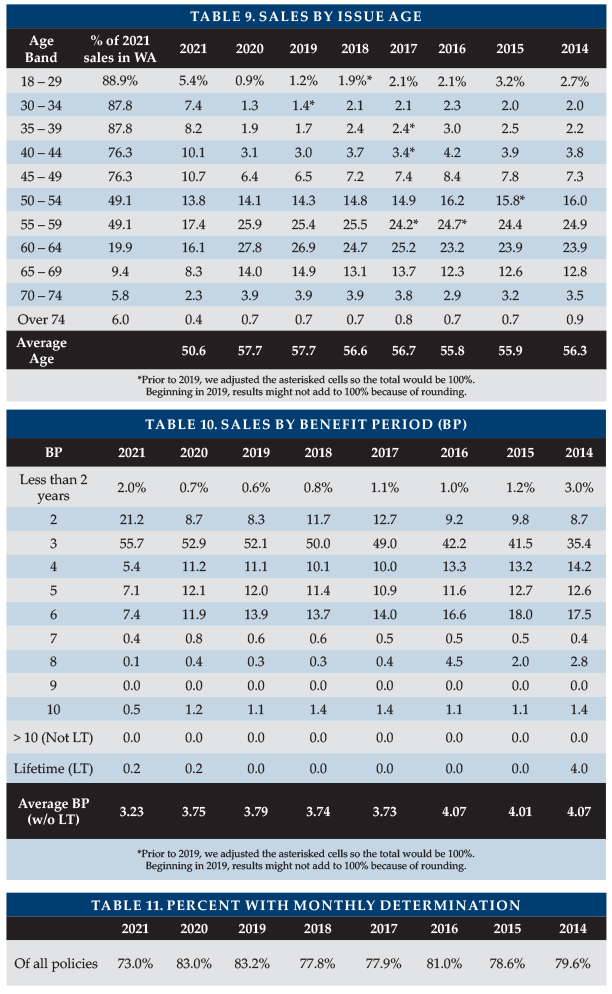
Issue Age Table 18 shows the average issue age remained 57.1. Note: one survey participant has a minimum issue age of 40, one will not issue below 30, and one will not issue below 25.
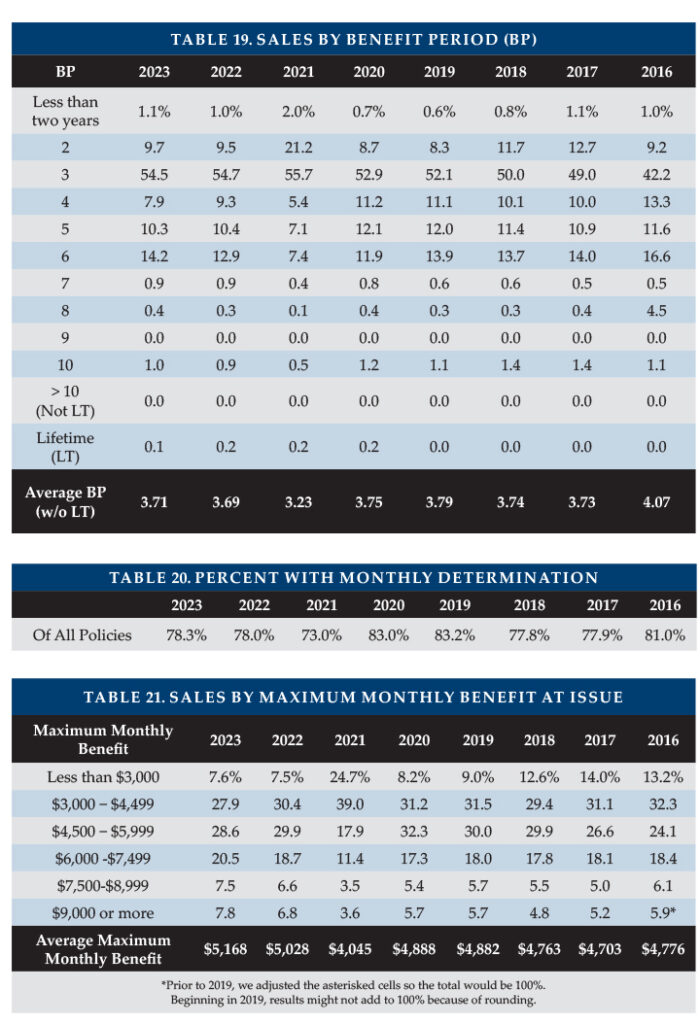
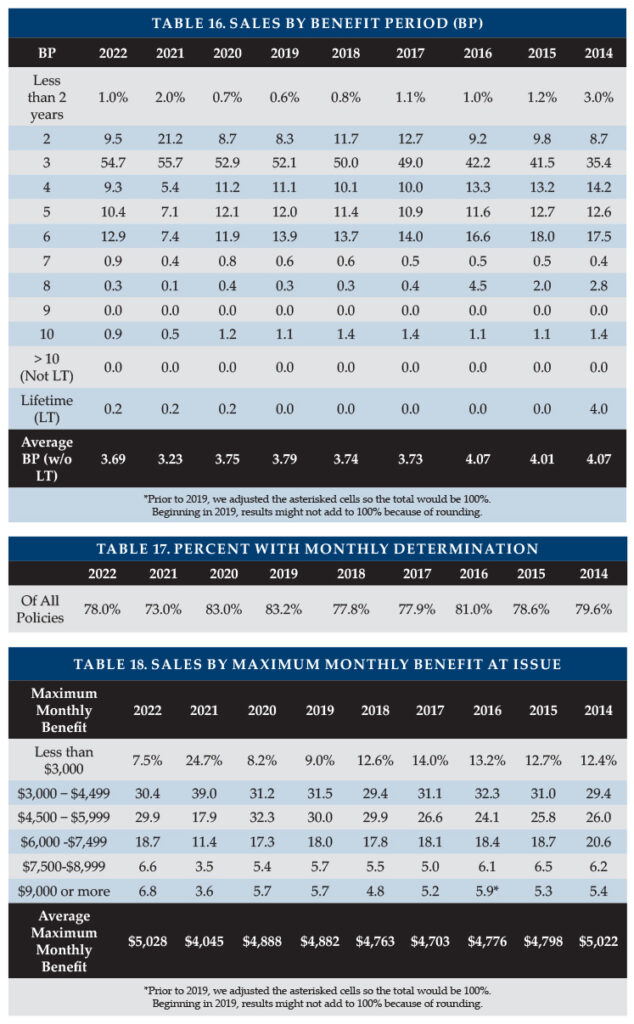
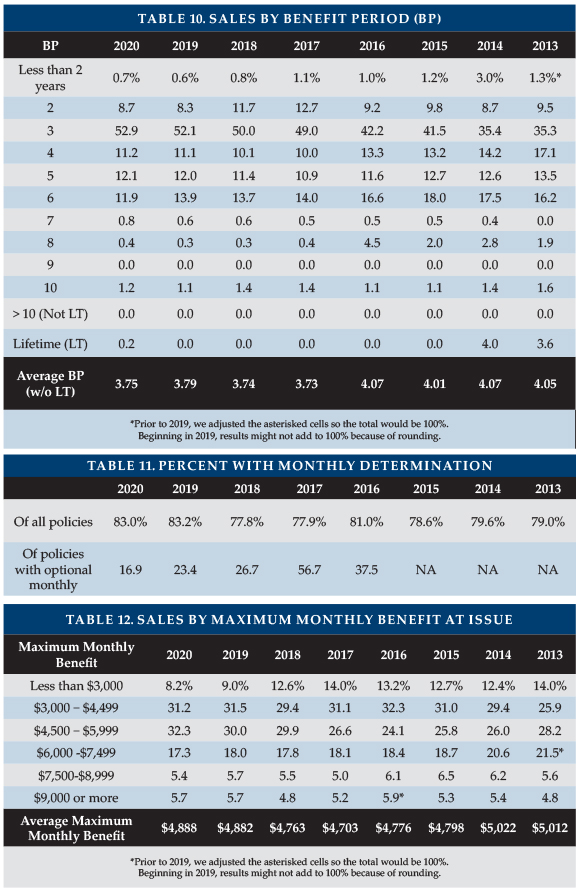
Benefit Period Table 19 shows that the average benefit period remained similar to last year, with the largest changes occurring for the 4-year and 6-year policies.
Monthly Benefit Monthly determination continued to be roughly 78 percent of new policies (Table 20). With monthly determination, low-expense days preserve more coverage to use for high-expense days, offering more flexibility for insureds. One insurer offers only daily determination; one insurer offers a choice; and the other insurers automatically have monthly (or weekly) determination.
Sales in 2023 set a record average maximum monthly benefit ($5,168), as shown in Table 21. Sales with an initial monthly maximum of $9,000 or more ranged from a low of three percent of sales for one insurer to a high of 13.3 percent for another.
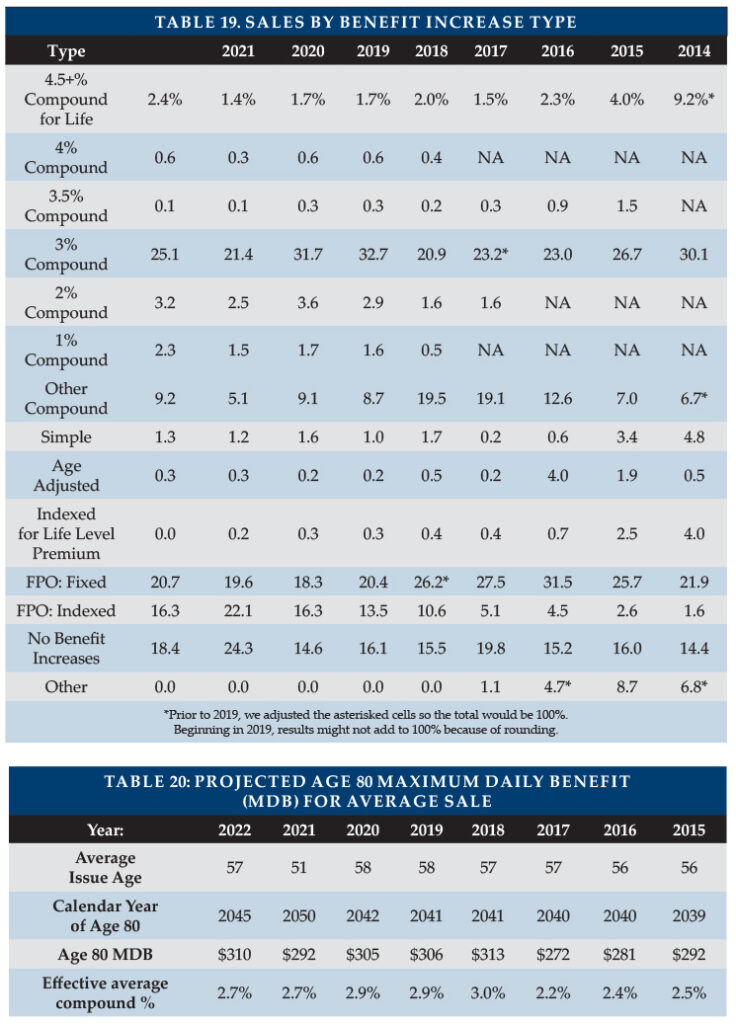
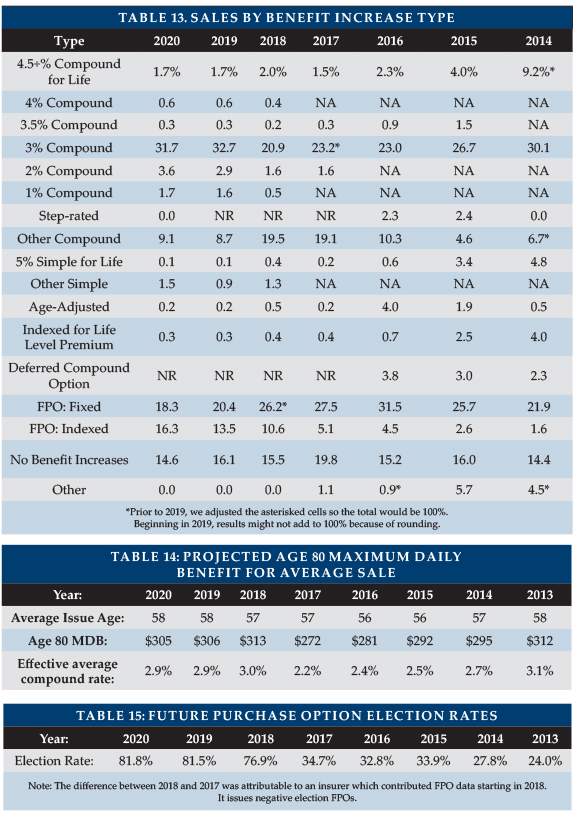
Benefit Increase Features Table 22 generally shows reduced inclusion of pre-paid benefit increase features (i.e., total of rows in Table 22 excluding sales for no benefit increases and FPOs) in 2023 stand-alone LTCI policies.
“Indexed Level Premium” policies are priced to have a level premium, but the benefit increase is tied to an index such as the consumer price index (CPI).
A person’s amount of LTCI coverage in their elder years is critical. Therefore, each year, we estimate the amount of coverage an average buyer would have at age 80. We project the age 80 maximum daily benefit by increasing that year’s average initial maximum daily benefit (MDB) from the average issue age to age 80, according to that year’s distribution of benefit increase features, using current future purchase option (FPO) election rates and a five percent per year offer for fixed FPOs. Table 23 shows the projected maximum benefit in 2046 (at age 80) for our 2023 average 57-year-old purchaser ($334/day; equivalent to 2.9 percent compounding) and corresponding results for prior years.
To compare the eventual purchasing power of each year’s average purchase, we used the same methodology to estimate the maximum daily benefit in 2046, also shown in Table 23. While an average 2023 buyer would have $334 of MDB in 2046, an average 2022 buyer would have $319 of MDB and an average 2021 buyer $259 of MDB, but an average 2020 buyer would have $345 of MDB.
With greater potential concern about inflation given the current economic environment, consideration of benefit increases likewise may grow more important. People are likely to be disappointed if cost of care grows faster than the protection built into their policy.
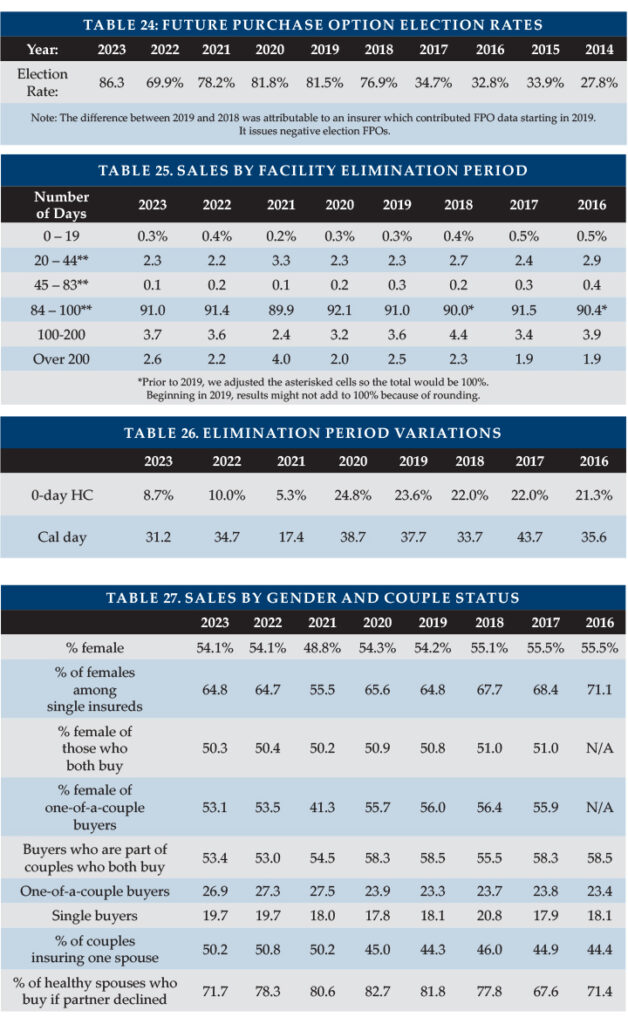
FPOs (Table 24) can play an important role in maintaining insureds’ purchasing power. In 2023, 86.3 percent of FPOs were elected, generally in-line with these contributing insurers’ prior experience. The high election rate is particularly noteworthy as the cost increases each year due to larger coverage increases each year, increasing unit prices due to age, and possibly rate increases.
Negative-election FPOs activate automatically unless the client rejects them. Positive-election FPOs activate only if the client initiates a timely request. The high election rate reflects the effectiveness of annual (as opposed to triennial) negative-election provisions (particularly those which can be lost prospectively if not currently exercised) and may reflect the importance of LTCI to policyholders, especially in an inflationary environment.
One participant had an election rate over 90 percent, but two insurers had election rates of 27 to 29 percent. FPOs can also be important to insurers as well. One insurer got 58 percent of their new premium from FPO elections.
Elimination Period Table 25 summarizes the distribution of sales by facility elimination period (EP), which shows some increasing trend for EPs of 200+ days. Two insurers saw more than five percent of their buyers chose EPs longer than 200 days.
Table 26 shows the percentage of new policies with zero-day home care elimination period (but a longer facility elimination period). The purchase rate of an additional-cost zero-day home care EP option is sensitive to the price. The higher percentages prior to 2021 reflect an insurer which stopped selling LTCI.
Table 26 also shows the percentage of new policies with a calendar-day EP. Calendar-day EP provisions count a day toward the EP if you need care, even if you do not get commercial care. Service-day EPs count only days on which commercial care is received. However, most calendar-day EP provisions require an up-front paid-service day to start counting.
Sales to Couples and Gender Distribution Table 27 summarizes the distribution of sales by gender and partner status. The sales show a smaller percentage (71.7 percent in 2023 vs. 78.3 percent in 2022) of healthy spouses bought policies when their partner was declined. Otherwise, the 2023 sales distributions were similar to 2022.
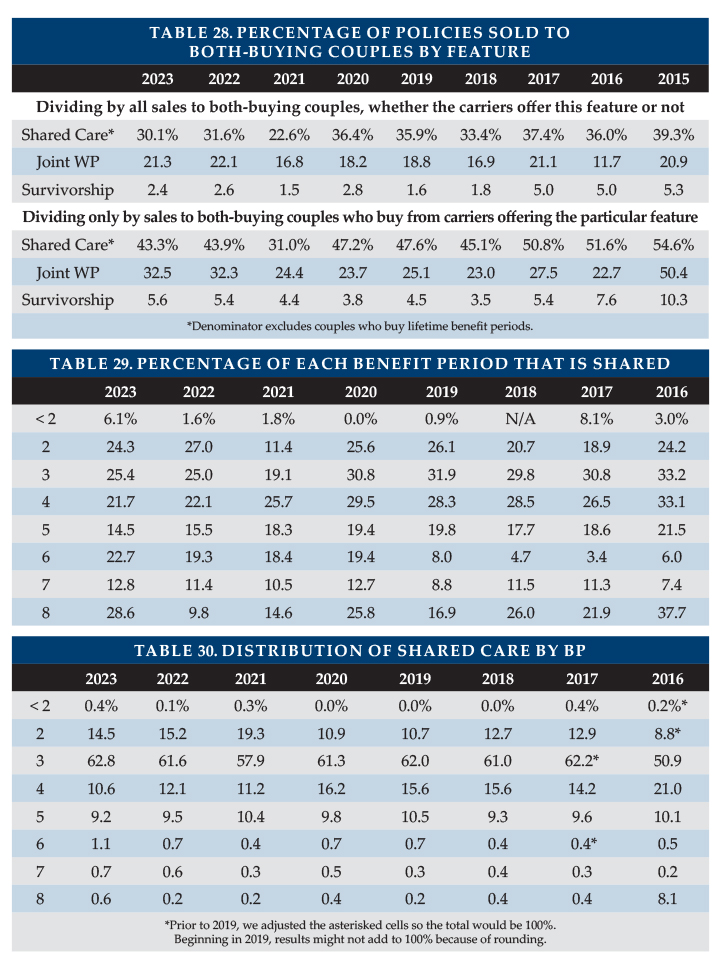
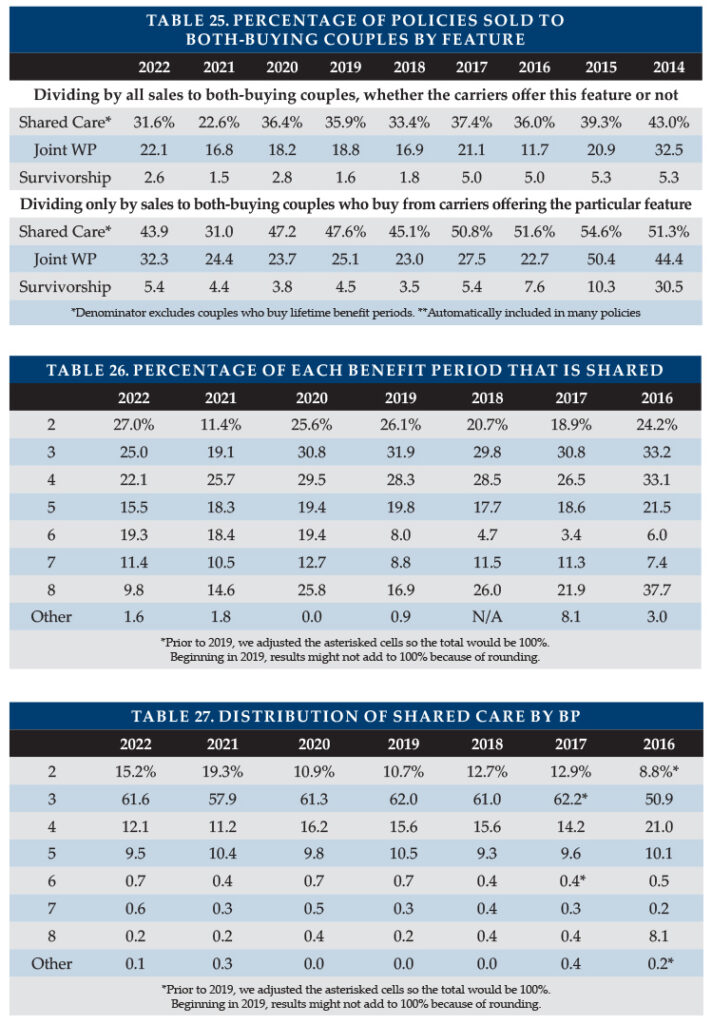
Shared Care and Other Couples’ Features Table 28 summarizes sales of Shared Care and other couples’ features.
Shared Care allows one spouse/partner to use the other’s available benefits if their own coverage has been depleted or offers a third independent pool the couple can share.
Survivorship waives a survivor’s premium after the first death if specified conditions are met (such as having been inforce for 10 or more years).
Joint waiver of premium (WP) waives both insureds’ premiums if either insured qualifies for benefits.
Changes in distribution by carrier can greatly impact year-to-year comparisons (Table 28). Some insurers embed survivorship or joint waiver automatically (sometimes only for particular circumstances such as if Shared Care is purchased), while others offer it for an extra premium or do not offer the feature.
In the top half of Table 28, percentages are calculated based on the total number of policies sold to couples who both buy (for Shared Care, only those who buy a limited benefit). The percentages in the bottom half of Table 28 reflect only the sales from insurers offering that particular feature.
For insurers reporting Shared Care sales, the percentage of both-buying couples who opted for Shared Care varied from 9.9 percent to 72.1 percent. The corresponding percentage of couples with Joint WP varied from eight percent to 100 percent and for Survivorship ranged from 2.5 percent to 14.2 percent.
Tables 29 and 30 provide additional breakdowns on the characteristics of Shared Care sales. Table 29 shows the percentage of each benefit period that included Shared Care. Table 29 shows low percentages of Shared Care, partly because its denominator includes all policies, even those sold to single people or one of a couple.
Table 30 looks only at Shared Care policies and reports their distribution across benefit period, so the percentages must total 100 percent. As most policies have three-year benefit periods, most Shared Care policies had a three-year benefit period.
Shared Care is generally more concentrated in two- to four-year benefit periods than are all sales. Couples often buy shorter benefit periods because they plan to help care for each other and expect the male partner to not need care for a long time. With Shared Care, if the male dies without using all his coverage, his unused coverage is available for the surviving female. As shown in Table 27, single buyers are more likely to be female and females are more likely to opt for a longer benefit period.
In 2023, sales generally showed a downtick in the percentage of short benefit period policies that included Shared Care and saw an uptick in Shared Care among longer benefit period policies.
Existence and Type of Home Care Coverage Three participants reported sales of facility-only policies, which accounted for 0.4 percent of total sales. For many years, one insurer has been responsible for more than 80 percent of such sales. Most (96 percent) comprehensive policies included home care benefits equal to the facility benefit, while the other policies had a home care benefit at least 50 percent of the nursing home benefit. The most recent home-care-only sale in our survey was sold in 2018.
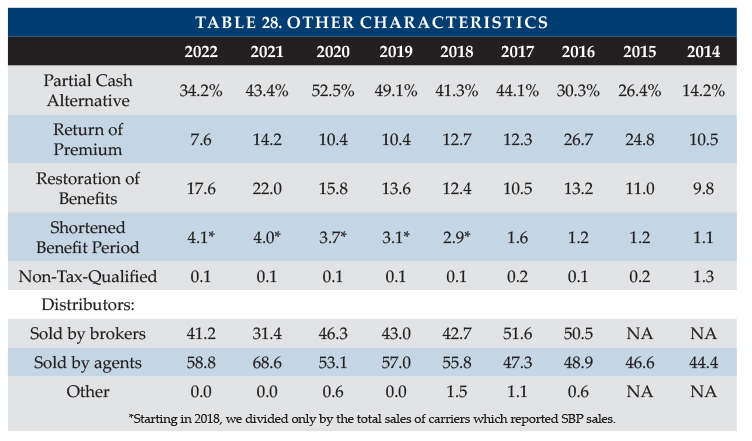
Other Characteristics Two insurers offer Partial Cash Alternative features, which allow claimants, in lieu of any other benefit that month, to use 25 to 30 percent of their coverage for whatever purpose they wish. Table 31 shows Partial Cash Alternative features were included in fewer policies due to a change in market share among participants.
Two insurers offer an additional (not an alternative as indicated above) benefit that is a cash benefit. Only 0.3 percent of polices included that feature.
Return of premium (ROP) features were included in 8.5 percent of policies. ROP returns some or all premiums (usually reduced by paid LTCI benefits) when a policyholder dies. Roughly 74 percent of ROP features were embedded automatically in the product. Embedded features are designed to raise premiums minimally, typically decreasing the ROP benefit to $0 by age 75. For the survey participants, 20 percent of ROP features would pay benefits for death after age 75.
Restoration of Benefits (ROB), which restores used benefits when the insured has not needed services for, typically at least six months, was included in 17.2 percent of policies with limited benefit periods. Roughly 90 percent of ROB features were automatically embedded.
Insurers must include shortened benefit period (SBP) coverage unless buyers specifically decline the feature. SBP coverage makes limited future LTCI benefits available to people who stop paying premiums after three or more years. Most (95.8 percent) buyers refused SBP. (Note: Contingent SBP coverage is included automatically at no cost.)
Only one insurer issued non-tax-qualified (NTQ) policies, which accounted for 0.1 percent of total industry sales.
“Captive” (dedicated to one insurer) agents produced 61.8 percent of the sales. Brokers produced the balance. At one time, “captive” agents who sold LTCI tended to specialize in LTCI. Now many are agents of mutual companies.
Limited Pay and Paid-Up Policies In 2023, two insurers in the survey sold policies that become paid-up in 10 years or less, accounting for 1.2 percent of sales.
Because today’s premiums are more stable compared to policies sold years ago, premium increases are less likely. One of the key reasons for buying 10-year-pay (avoidance of rate increases after the 10th year) is greatly reduced, while the cost of 10-year-pay has increased, making it less attractive for consumers than in the past. Nonetheless, limited-pay and single-pay policies are attractive to minimize post-retirement outflow and to accommodate §1035 exchanges.
Eight participants reported that roughly four percent of their 2023 inforce policies are paid-up, similar to 2022.
When someone applies to Medicaid for long term care services, most states with Partnership programs disregard assets up to the amount of benefits received from a Partnership-qualified policy (some Indiana and New York policies disregard all assets). Except for California, states with Partnership programs grant reciprocity to Partnership policies issued in other jurisdictions. Partnership programs are approved in 44 jurisdictions, all but AK, DC, HI, MA, MS, UT, and VT. However, MA has a similar program (MassHealth).
Four states (CA, CT, IN and NY) blazed the trail for Partnership programs in the early 1990s. Other states were allowed to adopt simplified and more standardized Partnership regulations by the Deficit Reduction Act of 2005 (DRA).
More than 60 percent of Partnership states allow one percent compounding to qualify for Partnership, which can help low-budget buyers qualify for Partnership and also enable worksite core programs to be Partnership-qualified. A higher percentage of policies will qualify for Partnership in the future if insurers and advisors leverage these opportunities. Currently three insurers offer one percent compounding.
Partnership programs could be more successful if:
Advisors offer small maximum monthly benefits more frequently to middle-income individuals. For example, a $1,500 initial maximum monthly benefit covers about 1.5 hours of home care per day and, with compound benefit increases, may maintain buying power. Many middle-income individuals would like LTCI to help them stay at home while not “burning out” family caregivers and could be motivated further by Partnership asset disregard. (This approach does not work in CA, CT, IN and NY because of their high Partnership minimum daily benefit requirements.)
Middle-income prospects were better educated about the importance of benefit increases to maintain LTCI purchasing power and qualify for Partnership asset disregard.
The four original Partnership states migrate to DRA rules.
More jurisdictions adopt Partnership programs. (AK, HI, MA, MS, VT, and DC do not have Partnership programs, but MA has its MassHealth program which is similar.)
Programs that privately finance direct mail educational LTCI content from public agencies were adopted more broadly.
Financial advisors were to press reluctant insurers to certify their products and offer one percent compounding.
More financial advisors were certified. Some people argue that certification requirements should be loosened. At a minimum, the renewal certification process could be improved.
Linked benefit products became Partnership-qualified.
PARTNERSHIP PROGRAM SALES Participants reported Partnership sales in 41 states, all Partnership-authorized states except CA, CT and NY. No insurer reported Partnership sales in more than 38 states and one insurer issues no Partnership policies.
Insurance brokers do not have access to Partnership policies in CA, CT and NY and from only one insurer in IN. However, consumers may be able to purchase Partnership-qualified coverage from another entity.
As shown in the Sales Distribution by Jurisdiction table of participants sales in DRA states, 46.4 percent qualified for the Partnership. Rhode Island (75.8 percent) exceeded perennialleader Minnesota (74.1 percent) for the highest percentage of Partnership-qualified sales. Maine (73.5 percent) also had more than 70 percent and North Dakota had 69.9 percent. Ten states had between 60.0 percent and 62.5 percent and another nine had more than 50 percent but less than 60 percent qualify. Fifteen states had 20 to 50 percent qualify. New Mexico (7.6 percent), Utah (12.0 percent), Indiana (13.6 percent) and West Virginia (18.7 percent) were the only DRA states in which fewer than 20 percent qualified.
UNDERWRITING DATA Case Disposition Five insurers contributed application case disposition data to the survey (Table 33). Case resolutions improved in 2023 with 59.3 percent placed and 24.9 percent declined or deferred, compared with 58.2 percent and 25.7 percent in 2022. One insurer placed 77 percent of its cases; the others placed 47 to 56 percent.
Of cases which were resolved, 27.8 percent were declined or deferred, with the percentage varying from 14.2 percent to 36.1 percent, depending on insurer. To the degree that a declined applicant got coverage elsewhere or a deferred applicant was ultimately approved, the eventual placement rate for applicants is higher than our data indicates.
Overall, 15.8 percent of cases were suspended or withdrawn during underwriting or not accepted or dropped during the free look period. That is the lowest percentage since 2019.
Factors such as age distribution, distribution system, market, underwriting requirements, and underwriting standards affect these results.
Table 34 shows the placement rate by applicant age. This data is a subset of the data in Table 33 and the “All Ages” line, as some carriers cannot provide this data by age. While the placement rate increased overall (i.e., all participants, all ages combined), the placement rate for the insurers that provided data by age decreased for ages above 40.
Low placement rates increase insurers’ cost per placed policy. More importantly, low placement rates discourage advisors from discussing LTCI with clients. In addition to not wanting to waste time and effort, advisors may fear that declined clients will be dissatisfied. In the Market Perspective section, we listed ways to improve placement rates. This is a critical issue for the industry. If readers have suggestions, they are invited to contact the authors.
Underwriting Tools Five insurers contributed data to Table 35, which divides the number of uses of each underwriting tool by the number of applications processed. For example, the number of requested medical records was 84 percent of the number of applications. Fewer than 84 percent of applications involved medical records, because some applications involved multiple medical records.
Year-to-year changes in distribution of sales among insurers significantly impact results. Lower maximum ages result in fewer face-to-face exams. Insurers might underreport the use of an underwriting tool because they may lack a good source for that statistic. For example, an insurer might not be able to split phone interviews by whether or not they include cognitive testing.
Underwriting Time Table 36 shows that for five insurers, the average processing time, from receipt of application to mailing the policy, decreased to 47 days. Rating Classification
Table 37 suggests continued overall trend to issue policies with an insurer’s “better,” lower priced underwriting classification. The percentage of decisions either declined or placed in the 3rd-Best or “less-attractive,” higher priced classifications reduced consistently. For each issue age group, Table 38 shows the percentages of policies issued in the most favorable category and Table 39 shows the decline rate. These tables do not exactly match Table 37 because some participants provide all-age data, rather than separating it by age. The percentage placed in the most favorable classification continues to generally improve within each issue age group, which may be at least partly attributable to fewer insurers offering preferred discounts compared to the past.
For each issue age group, Table 39 shows the percentages of policies declined. The decline rate dropped in 2023 for most age groups. For the past 4 years, the percentage placed in the most favorable classification has been higher for ages 75+ than for ages 70-74 and the decline rate has been lower. The age 75+ block is the smallest and most susceptible to statistical fluctuation, but the primary cause appears to be different distribution of insurers by age. For example, some insurers do not have a “preferred” health discount; the bulk of their policies are issued in their “most favorable” class.
CLOSING We thank insurance company staff for submitting the data and responding to questions promptly. We also thank Sophia Fosdick and Quentin Clemens of Milliman for managing the data expertly.
We reviewed data for reasonableness and insurers reviewed their product exhibit displays. Nonetheless, we cannot assure that all data is accurate.
If you have suggestions for improving this survey (including new entrants in the market), please contact one of the authors.
The 2023 Milliman Long Term Care Insurance Survey, published in the July issue of Broker World magazine, was the 25th consecutive annual review of long term care insurance (LTCI) published by Broker World magazine. It analyzed product sales, reported sales distributions, and detailed insurer and product characteristics.
From 2006-2009, Broker World magazine published separate group LTCI surveys, but discontinued those surveys when the availability of group LTCI policies shrank. In 2011, Broker World magazine began this August annual analysis of worksite (“WS”) sales to complement the July overall market analysis.
The WS market consists of individual policies and group certificates (“policies” comprises both henceforth) sold with employer support, such as permitting on-site solicitation and/or payroll deduction. If a business owner buys a policy for herself and pays for it through her business, participants likely would not report her policy as a WS policy because it was not part of a WS group. If an employer sponsors LTC/LTCI educational meetings, with employees pursuing any interest in LTCI off-site, sales would likely not be reported as WS sales.
We limit our analysis to US sales and exclude “combination” products, except where specifically indicated. (Combination products pay meaningful life insurance, annuity, or disability income benefits in addition to LTCI.)
As reported in Market Perspective, the bulk of worksite sales that cover support with activities of daily living (ADLs) or cognitive impairment do not qualify as LTCI under section 7702(B) and are not covered in this survey (except as specifically mentioned).
About the Survey Participants Seven participants (Bankers Life, Knights of Columbus, Mutual of Omaha, National Guardian Life, New York Life, Northwestern, and Thrivent) contributed broadly to stand-alone sales distributions reported herein. Total 2022 sales data includes one additional contributor (LifeSecure) and 2022 inforce data includes two additional contributors (LifeSecure and CalPERS).
Our survey includes stand-alone WS sales and statistical distributions from participants National Guardian Life, New York Life, and Northwestern, and WS sales data from contributor LifeSecure.
The following eleven insurers participated in our combination sales data: AFLAC, John Hancock, Mass Mutual, New York Life, Nationwide, Northwestern Mutual (Northwestern), OneAmerica, Pacific Life (2021 survey only), Securian, Trustmark and United of Omaha.
Comparisons of sales distributions We compare WS sales to individual LTCI policies that are not WS policies (NWS) and to total sales (Total).
Our WS stand-alone statistical distributions can vary significantly from year-to-year because insurers focusing on particular WS markets may be over- or under-represented. As has been the case for several years, our worksite sales distributions are dominated by executive sales. Carriers that provided 2022 distributions had an average worksite annual premium of $2,565, excluding FPOs, whereas the insurers that provided sales, but not distributions, had an average worksite premium of $1,876 annually. We believe this difference is narrower than in the past several years because of the inclusion of delayed Washington sales in our 2022 WS data.
Highlights from This Year’s Survey As explained in the July issue, a large number of 2021 applications were delayed by insurer backlog in 2021, eventually being issued in 2022. We successfully worked with most participants to reassign cases to 2021 so we could isolate the boost in 2021 sales driven by the Washington Cares Fund (WCF) exemption rules. Nonetheless, our total sales distributions are still somewhat impacted by delayed 2021 sales in the state of Washington.
Reassigning those policies was a lot of work for participants, so we chose not to reassign corresponding worksite policies to 2021. Thus, while our total distributions are largely adjusted for such lag, our WS distributions are not adjusted for such lag. Our NWS distributions are also not adjusted for such lag, because we calculated NWS distributions by subtracting unadjusted WS sales from unadjusted total sales. Readers should keep in mind that some results may be meaningfully different next year when all data will be on the same basis.
Table 1 shows the number of sales and premium in the total market and in the worksite market both nationally and in Washington for years 2020 to 2022. Including NAIC data for non-participants, it shows that Washington accounted for 75 percent of reported stand-alone LTCI policies sold in 2021 (an estimated 35 percent of premium) and 54 percent of combination life/LTCI policies (21 percent of premium).
Stand-alone worksite 2022 sales receded significantly from their higher, Washington-impacted 2021 sales. Participants reported worksite sales of 2,213 lives and $8.7 million in premium, compared to (for same companies) pandemic-influenced 2020 sales of 2,124 lives and $7.1 million of premium. Transamerica, which produced more 2020 worksite sales than all our participants combined, stopped selling in the first half of 2021 and is not included in the prior sentence. Thus, our participants appear to have, at best, absorbed a small portion of Transamerica’s share of the worksite market. As discussed in Market Perspective, many worksite sales with coverage for ADL-deficiency and cognitive impairment shifted to products that do not qualify as LTCI under section 7702(B).
As shown in Table 1, stand-alone WS sales (including Transamerica) dropped significantly from 2020 to 2022, but combo worksite reported sales increased by 13 percent (number of coverages) and 49 percent (annualized premium).
Worksite sales contributed eight percent of participants’ stand-alone sales in 2022 and seven percent of stand-alone annualized premium, as explained in the discussion of Table 3. Table 1 also shows that Washington accounted for 15 percent of the reported 2022 worksite cases and six percent of the worksite premium, indicating a low average premium for Washington sales compared to National. Washington’s higher market share in terms of policies is an indicator that our stand-alone worksite sales include many delayed 2021 sales. Our numbers reflect a significant drop in stand-alone LTCI sales in the worksite, which would be even greater had we adjusted worksite sales for the Washington sales lag.
As reported in our July issue, the number of 2021 Washington stand-alone LTCI sales was approximately 90 times the 2020 Washington sales. The ratio varies significantly between worksite insurers (483) and individual insurers (26).
In the combo market, worksite sales accounted for 39 percent of participants’ reported coverages sold and eight percent of annualized premium. Life/LTCI combo insurers sold 89 times as many coverages in Washington in 2021 than in 2020. The ratio also varies significantly between worksite insurers (578) and individual insurers (21). We include here some WS policies that qualified for exemption from the WCF tax even though they do not qualify under section 7702(B), which largely explains different results than some other reports. We have a good-sized sample of combo insurers, but a lower percentage of industry sales than in the stand-alone market.
MARKET PERSPECTIVE There are three segments of the WS market. A single WS case may involve different segments for different employee classes.
In “core” (also known as “core/buy-up”) programs, employers pay for a small amount of coverage for generally a large number of employees. Employees can buy more coverage. “Core” programs generally have low average ages, short benefit periods, low daily maximum benefits and a small percentage of spouses insured.
In “carve-out” programs, employers pay for robust coverage for key executives and usually their spouses. Generally, executives can buy more coverage for themselves or spouses. Compared to “core” programs, a higher percentage of insureds are married, more spouses buy coverage, the age distribution is older and average premium is higher.
In “voluntary” programs, employers pay none of the cost. The typical coverage is more robust than “core” programs, but less robust than “carve-out” programs. Voluntary programs tend to be most weighted toward female purchasers.
National Guardian, New York Life, and Northwestern write mostly executive carve-out programs and are the only insurers that provided statistical distributions; therefore, our data is heavily weighted to the executive carve-out market. If an employer purchases coverage for only one or two employees, the insurer may not recognize the case as executive carve-out, in which case we would under-report executive carve-out sales.
Because of tax savings, small executive carve-out issue dates are weighted toward the end of the year. On the other hand, large voluntary cases are traditionally weighted toward fall enrollments with January 1 effective dates. Large voluntary cases are probably more evenly distributed through the year than in the past, but differences remain.
Carrier and product shift: Last year, we noted that the future of the non-executive carve-out LTCI market was unpredictable with Transamerica’s departure. This year’s decline in the stand-alone WS market was not surprising.
WS programs have gravitated toward products that include life insurance, which is viewed as a more immediate potential need by young employees with families. The possibility of guaranteed issue also draws employee benefit advisors and employers to such products. Such products can allow 100 to 300 percent of the death benefit to be used for “chronic illness” (defined in terms of ADLs and cognitive impairment), typically using up to four percent of the death benefit each month. Alternatively, they can allow 100 to 200 percent of the death benefit to be used, restoring used death benefit each month so beneficiaries will receive the full death benefit.
These products do not qualify as LTCI under section 7702(B). As they have a fixed chronic illness benefit, the purchasing power of the coverage typically deteriorates over time. For example, if a 30-year-old employee buys a $100,000 death benefit, she will have a $4,000 maximum monthly benefit for chronic illness (assuming the benefit features described above). That $4,000 benefit would cover a much higher percentage of her cost of care if she needed care in the next few years compared to if she needs care 50 years from now.
Washington Cares Fund: Washington state’s “Washington Cares Fund” (WCF) imposes a 0.58 percent employee-paid payroll tax to fund a $36,500 lifetime pool (intended to inflate according to the Washington consumer price index) for care, as defined in the Revised Code of Washington 50B.04, received in Washington. People who purchased private stand-alone or combination LTCI by November 1, 2021 could file to be exempt from the tax. WCF received approximately 484,000 applications for exemption.1
Other states are interested in state-run LTCI programs. Examples include:
California: A task force identified alternative programs which are being priced in 2023. Recommendations will be made to the legislature for possible 2024 legislation.
New York SB 9082 did not pass in 2022 and no legislation was proposed in NY’s 2023 legislative session. However, Governor Hochul issued an executive order in November 2022 citing her “vision of a long-term care system that is accessible, effective, and affordable.”2
In Minnesota, bills for a state LTCI program have been introduced twice. The state has commissioned a study to be produced in 2023 to explore alternatives.
Pricing and Underwriting Considerations: Most people interpret Title VII of the 1964 Civil Rights Act to require that employer-involved LTCI programs use unisex pricing if the employer has had at least 15 employees for at least 20 weeks either in the current or previous year. Some states apply similar laws to employers with fewer employees. The expense of separate pricing, marketing and administration discourages insurers from serving both the WS and NWS markets.
Moreover, insurers fear anti-selection. Because women have higher expected future claims, unisex pricing saves women money compared to gender-distinct NWS pricing, whereas men pay much more with unisex pricing than with gender-distinct pricing. Insurers may vary pricing based on the employees’ gender distribution.
Insurers also fear health anti-selection (less-healthy people buying, while healthier people do not buy). Insurers are more vulnerable to health- or gender-anti-selection if the group has a large portion of young or less affluent employees as this group is generally less likely to buy LTCI. When the coverage has a life insurance component, more employees are likely to buy, which can help reduce the insurer’s anti-selection concerns.
Furthermore, because WS programs rarely offer “preferred health” discounts, healthy couples may pay more for WS coverage than for corresponding NWS coverage.
To control risk, most insurers will not accept a voluntary WS program if there are fewer than 100 employees. However, one insurer (which offers no health concessions) will accept voluntary LTCI programs with as few as 2 to 5 (varies by jurisdiction) employees buying.
Because of tax advantages when an employer pays the premium, a more expensive WS product can still produce after-tax savings compared to a cheaper NWS policy. The specter of future tax increases enhances the attractiveness of employer-paid premium.
Availability of coverage: As few people younger than age 40 buy stand-alone LTCI, some insurers have raised their minimum issue age to avoid anti-selection and to reduce exposure to extremely long claims. Such age restrictions can discourage employers from introducing a program, especially a carve-out program if they have executives or spouses too young to be covered.
With increased remote work, more employers have employees stretched across multiple jurisdictions and eligible non-household relatives might live anywhere. But insurers may not offer a product in jurisdictions with difficult laws, regulations or practices, such as slow policy form approval. So, it can be difficult to find a product which can cover everyone unless LTCI is sold on a group policy form and the employer does not have individuals in extra-territorial states.
One contributor no longer offers WS LTCI to non-household relatives. Reduced availability for such relatives does not have much impact on sales, because typically a small percentage (about one percent of 2022 sales) of WS buyers are not an employee or partner. If a program does help elder relatives, it is still not likely to meaningfully address the negative impact of employees being caregivers.
Prior to gender-distinct pricing, an executive carve-out for two partners of a company with more than 15 employees could have been serviced by any LTCI company, but now it is hard to find a carrier that offers unisex pricing under such circumstances. Such executives may buy policies with gender-distinct pricing either because they are unaware of the requirement under Title VII of 1964 Civil Rights Act; they may disagree with the interpretation that such policies should have unisex pricing to avoid the risk of a civil rights complaint; etc.
Some employee benefit brokers are reluctant to embrace LTCI because of declinations, the effort of enrollment, certification requirements, their personal lack of expertise, etc. WS sales gain from LTCI specialists forming relationships with employee benefit brokers.
Support for Employees who are Caregivers: Various programs offer LTC-related services to employees and their families. Regardless of whether the employee is insured or the relative is insurable, they may be able to access information, advice, services, and products that make caregiving more efficient, more effective, safer, and less expensive. Enabling employees and their families to have better LTC experiences and to use more (not necessarily 100 percent) commercial care should boost productivity at work. Some of these programs are packaged with WS LTCI.
STATISTICAL ANALYSIS As mentioned earlier, insurers’ sales distributions can vary greatly based on the submarket they serve (for example, in the WS market: core, voluntary, or carve-out). Therefore, in addition to fundamental changes in the industry, distributions may vary significantly from year to year due to a change in participating insurers, distribution within an insurer, and market share among insurers. Policies in the carve-out market are designed similarly to those in the NWS market. Our sales distributions reflect only stand-alone LTCI. Two insurers reported their number of new employer cases as well as the number of new worksite sales. Combined, they averaged 7 applications per new employer case, which seems to confirm the executive carve-out concentration in our data.
The aggregate sales section includes estimates for 2021 and 2020 to reflect a more accurate picture of the industry. Subsequent sections do not include sales estimates.
Aggregate Sales Table 1 shows the number of sales and premium in the total market and in the worksite market both nationally and in Washington for years 2020 to 2022. Table 1 spotlights the impact of Washington on 2021 sales and the drop in worksite sales in 2022.
Last year, to provide a clearer view of what happened in Washington in 2021, we estimated 2020 and 2021 sales from non-participants. A lot of 2021 sales, particularly worksite sales, were made by non-participants. However, the non-participant with the bulk of the 2021 sales stopping selling in mid-2021. In 2022, we did not estimate sales of non-participants, as our general observations of the market would be unchanged.
Table 2 shows historical WS sales over a longer period of time, including some estimates based on our review of NAIC data. It shows overall average WS premium for all carriers that reported sales compared to the average WS premium for the participants who contributed statistical data beyond sales. As shown in Table 2, our WS statistics likely represented the broad WS market reasonably until 2017 (the WS average premium for survey participants was similar to the total average premium before 2017). Average premiums plummeted last year because of the WA sales. We believe the full survey participant average premium was lowered by delayed Washington policies.
Table 3 shows WS sales as a percentage of total LTCI sales. As noted earlier, the WS percentage declined in 2022 due to an insurer dropping out of the market. The 2022 percentages would be significantly lower if we had removed the sales pushed into 2022 by the flood of 2021 applications.
Market Share Table 4 shows the insurers’ reported WS sales, including FPOs and additions to worksite cases issued in prior years. Excluding FPOs, New York Life would have been in the lead, followed by LifeSecure.
We also examined the distribution of new insureds by jurisdiction for both the total market and the WS market. The WS market share of five states (AK, IA, ND, VA and WA) was 50 percent or more greater than their overall market share (e.g., if they had a two percent overall market share, they had at least a three percent market share in WS). In 18 jurisdictions, the market share of total sales was at least 50 percent greater than the WS market share, suggesting that there may be opportunity for WS sales in these jurisdictions: AL, CO, IN, KS, ME, MD, MA, MI, MO, NE, NH, NM, PA, SC, TX, UT, VT, and WI. In five jurisdictions, our participants had no stand-alone WS sales at all (DC, RI, WV, WY, and Puerto Rico).
Average Premium Per Buyer Table 5 shows the average premium per new insured (NB Insured) and per buying unit (a couple comprise a single buying unit). For these two average sizes to be comparable, we must include only insurers which report sales for couples. The average premium per new insured including all insurers that reported sales is $3,556.
As always, the average premium per buying unit (a couple comprise a single buying unit) is higher because there are fewer buying units than insureds. Normally, the increase in average premium per buying unit compared to per insured is lower for WS sales, because more WS buyers are single and because spouses are less likely to buy in the WS. However, in the carveout market, more buyers are married and spouses are more likely to buy.
Issue Age In reviewing the balance of the statistical presentations, we urge you to be selective in how you use the data because it is not representative of the entire WS market as explained above.
Table 6 shows that the average age increased 6 to 7 years for both the NWS market and the WS market, which was generally expected due the influence of 2021 Washington sales.
Table 7 shows how much older the average NWS buyer has been compared to the average WS buyer.
Table 8 displays the relative age distribution of workers ages 16+ vs. the age distribution of purchasers in the WS market. It also shows the age distribution of adults 20-79 compared to the age distribution of purchasers in the NWS market. If the percentage of sales in a particular age group is higher than the percentage of population in that age group, we can conclude either that LTCI is more appealing to that age group or that the industry gets in front of that age group more. For whichever reason, the industry is particularly effective with ages 40-49 in the WS market. In the NWS market, the industry is particularly effective for ages 50-69.
Rating Classification Most WS sales are in the “best” underwriting class (see Table 9) because there generally is only one underwriting class. Insurers often do not get enough information in WS to determine whether a “preferred health” discount could be granted and use the additional revenue (from not having a “preferred health” discount) to fund extra cost resulting from gender or health anti-selection. Carve-out programs are more likely to offer a “preferred” discount, which means a higher percentage of carve-out policies are issued in the second-best underwriting class. The percentage of policies issued in the best underwriting class soared in the NWS market in 2021 because younger and healthier buyers were drawn to LTCI in WA.
Benefit Period The WS average benefit period is low for core/buy-up programs and somewhat low for voluntary programs. Executive carve-out programs sometimes have longer benefit periods than the NWS market. In 2022, the average benefit period returned to pre-2021 levels. The NWS market had an average benefit period of 3.70 years compared to 3.76 in 2020. The WS market had an average benefit period of 3.44 compared to 3.54 in 2020.
The difference in benefit periods between the markets is larger than these statistics indicate, because these statistics ignore Shared Care (the WS market issues much less Shared Care).
Table 11 shows corresponding data back to 2014. As noted elsewhere, this data can jump around based on which insurers provide such detail and whether large core/buy-up cases are written in a particular year.
Maximum Monthly Benefit In 2020, the average initial monthly maximum was about nine percent lower in the WS market than in the NWS market. In 2021, the difference tripled to 27 percent lower in the WS market. To calculate the average initial monthly maximum, we presume an average size in each size range. The $2,100/month we assume for the smallest size range seems to overstate dramatically in 2021 as many people opted for the minimum $1,500/month.
The Total Market average initial monthly maximum was the highest we have seen since 2015 partly due to a shift in distribution away from the WS market (see Table 13). The WS initial monthly maximum varies more over time than the whole market because of participant changes and how many core/buy-up plans were sold in a particular year.
Benefit Increase Features As shown in Table 14, 9.1 percent of 2022 WS sales had compounding of three percent or higher, compared to 2.8 percent in 2021 (and 5.6 percent in 2020). Of the 2022 WS sales, 24 percent had no increase feature and 63 percent had a FPO feature.
In the NWS market, 29.2 percent had three percent or higher compounding compared to 24.5 percent in 2021 (and a 35.5 percent in 2020).
Future Protection Based on a $27/hour cost for non-professional personal care at home ($27 is the median cost according to Genworth’s 2021 Cost of Care Survey), the average WS initial maximum daily benefit of $145 would cover 5.4 hours of such care per day at issue, whereas the typical NWS initial daily maximum of $169 would cover 6.2 hours of such care per day, as shown in Table 15.
The number of future home care hours that could be covered depends upon when care is needed (we have assumed age 80), the home care cost inflation rate between now (age 46 for WS and 58 for NWS) and age 80 (we have calculated with two, three, four, five and six percent inflation), and the benefit increases provided by the LTCI coverage between now and age 80.
Table 15 shows calculations for three different assumptions relative to benefit increase features:
The first line presumes that no benefit increases occur (either sold without any benefit increase feature or no FPOs were exercised).
The second line reflects the average benefit increase design using the methodology reported in the July article, except it assumes that 40 percent of FPOs are elected (intended to be indicative of “positive” election FPOs, in which the increase occurs only if the client elects it) and provide five percent compounding.
The third line is like the second line except it assumes 90 percent of FPOs are elected (intended to be indicative of “negative” election FPOs, in which the increase occurs unless the client rejects it). It also assumes the FPOs reflect five percent compounding.
Table 15 indicates that:
Without benefit increases, purchasing power deteriorates significantly, particularly for the WS purchaser as younger buyers have more years of future inflation prior to claim onset. For example, with a flat benefit, the number of covered hours of home care at age 80 drops to 2.0 hours for the average WS purchase age if there is three percent inflation and fewer than 2 hours if inflation is higher. The average NWS buyer would have 3.3 hours of care (rather than 2 hours) at age 80 if they had no benefit increases and inflation was three percent because the average NWS buys a larger daily benefit and is older.
The “composite” (average) benefit increase design assuming that 40 percent of FPO offers are exercised preserves purchasing power better than when no increases are assumed. The average WS buyer gains buying power over time if the inflation rate is two percent, being able to pay for 6.7 hours at age 80. But if the inflation rate is four percent, this drops approximately in half. The average NWS buyer does better because of a higher initial maximum daily benefit and a higher issue age.
Assuming that 90 percent of FPO offers are exercised, this buyer would have at least as much coverage at age 80 as at issue if the inflation rate is less than four percent. The average NWS buyer has increasing purchasing power until inflation averages more than 3.3 percent.
Table 15 underscores the importance of considering future purchasing power when buying LTCI. Please note:
The average 2022 WS buyer was 12 years younger at issue than the average 2022 NWS buyer, hence has 12 more years of inflation and benefit increases in the above table. The actual inflation rate to age 80 is not likely to be the same for today’s 46-year-olds as for today’s 58-year-olds.
Individual results vary significantly based on issue age, initial maximum monthly benefit, and benefit increase feature, as well as the inflation rate and the age at which the need for care occurs.
Between the median age of starting to need care (about age 83) and the median age of needing care (about age 85), more purchasing power could be gained or lost.
Table 15 does not reflect coverage for professional home care or facility care. According to the 2021 Genworth study, the average nursing home private room cost is $297/day, which is currently comparable to 11 hours of non-professional home care. However, the inflation rate for facility costs is likely to differ from the inflation rate for home care. From 2004-2021, Genworth’s studies showed the following compound growth rates: private room in a nursing home (3.0 percent), assisted living facility (3.8 percent), home health aide (2.2percent), and home care homemaker (2.6 percent).
Table 15 could be distorted by simplifications in our calculations. For example, we assumed that the FPO election rate does not vary by age, size of policy or market and that everyone buys a home care benefit equal to the average facility benefit.
FPO election rates might be different for policies purchased in 2021. How likely is it that 2021’s WA buyers will exercise FPOs?
Partnership Program Background When someone applies to Medicaid for long-term care services, most states with Partnership programs disregard assets up to the amount of benefits received from a Partnership-qualified policy (with some policies, IN and NY disregard all assets). Partnership programs exist in 44 jurisdictions (all but AK, DC, HI, MA, MS, UT, and VT), but MA has a similar program (MassHealth). The first four states to develop Partnerships (CA, CT, IN and NY) have different rules, some of which have become a hindrance to sales. We are not aware of a Partnership-qualified WS LTCI product in those four states, which is unfortunate because the WS market serves many people who could benefit from Partnership.
To qualify for a state Partnership program, a policy must have a sufficiently robust benefit increase feature. Many jurisdictions have lowered the minimum Partnership-eligible compounding benefit inflation rate to one percent. To facilitate Partnership sales in such jurisdictions, an insurer could lower its minimum size by 1/3 (e.g., from $1,500 to $1,000) if one percent compounding is included in a core program. The revenue from the core program would typically increase. The premium would be more level by issue age, shifting risk to younger ages which can be preferable for the insurer in a core program.
Jurisdictional Distribution The 2023 Milliman Long Term Care Survey includes a chart of the market share of each US jurisdiction relative to the total, WS and NWS markets, and the Partnership percentage by state. This chart indicates where relative opportunity may exist to grow LTCI sales.
Elimination Period More than 90 percent of the NWS market buys 90-day elimination periods (EPs). For that reason, many WS programs offer only a 90-day EP.
Table 16 shows distribution by EP and how many policies had a 0-day home care feature and a longer facility EP and how many policies had a calendar-day EP (as opposed to a service-day EP). We have reflected that all LifeSecure policies are 90-day EP with a calendar-day definition. Policies which have 0-day home care EP and define their EP as a service-day EP operate almost identically to a calendar-day EP, because people in facilities get daily care.
Gender Distribution and Sales to Couples and Relatives Insurers began gender-distinct LTCI pricing in 2013, but as explained above, unisex pricing continues in the WS market.
In the NWS market, the 2013-2015 percentages of females were high as insurers that still offered unisex pricing attracted single females. The next 5 years, the percentage of female buyers in the NWS was stable, fluctuating from 54.3 to 54.9 percent. In 2021, women constituted 50.5 percent of the US age 20-79 population3, but in 2021 the percentage of females dipped below 50 percent in both the WS and NWS markets because of the higher number of males purchasing coverage in WA.
In the WS market, the high percentage of female WS buyers from 2015-2018 suggests that women were particularly attracted to WS LTCI (presumably because of unisex pricing). To the degree that our more recent WS data is over-weighted to executive carve-out programs, it reflects less of the gender anti-selection that likely still exists. Although most executives are male, executive ranks are becoming more gender-balanced and many executive carve-out programs cover spouses. Women make up 47 percent of workers4 but accounted for 55 percent of our reported 2022 WS sales.
Table 18 digs deeper, exploring the differences between the WS and NWS markets in single female, couples and Shared Care sales. The percentage of NWS insureds who are female (49.9 percent) spotlights our statistical distribution difficulties this year. Insurers that reallocated sales from 2022 to 2021 probably moved a high percentage of males from total sales. As the worksite number of males was not adjusted, our method subtracted an unadjusted (high) number of WS males from an adjusted (low) number of total males, producing a misleading high number of NWS males, which explains our low 49.9 percent for females.
Our WS data had more single buyers, but a lower percentage of single buyers were female.
Slightly more than half the couples in the WS market insured both partners; slightly fewer than half of the couples in the NWS market did so.
Shared Care is less often offered in a WS program.
Our limited data with regard to relatives who buy shows that two spouses are insured for every three employees. That’s a high percentage reflective of executive carve-out data. Only about one percent of purchasers are relatives other than the employees and employees’ spouses.
Type of Home Care Coverage Table 19 summarizes sales by type of home care coverage. Historically, the WS market sold few policies with a home care maximum equal to the facility maximum. However, with increasing emphasis on home care and simplicity, that difference faded.
Table 19 also shows that monthly determination dominates both markets.
Because some insurers build these features into products automatically, we are able to include data from an insurer which did not provide sales distributions.
Many WS products embed a “partial cash alternative” feature (which allow claimants, in lieu of any other benefit that month, to use approximately 1/3 of their benefit for whatever purpose they wish, with the balance extending the benefit period) or a small informal care benefit.
Other Features Table 20 shows that almost all Return of Premium (ROP) features were embedded (automatically included) and phased out before death would be likely. ROP with expiring death benefits may provide an inexpensive way to encourage more young people to buy LTCI but does not address the buyer’s concern (what if I keep paying all my life, then die without qualifying for benefits?).
Table 21 shows lower Joint Waiver of Premium and Survivorship sales to couples in the WS market than in the NWS market, mostly due to differences in distribution by carrier. Some products automatically provide Joint Waiver of Premium if a couple buys identical coverage or if a couple buys Shared Care. Employers sometimes are disinclined to add an optional couples’ feature because they are already contributing more money to cover a married employee plus that employee’s spouse than the cost for a single employee the same age.
CLOSING We thank insurance company staff for submitting the data and responding to questions promptly. We also thank Sophia Fosdick and Quentin Clemens of Milliman for managing the data expertly.
We reviewed data for reasonableness. Nonetheless, we cannot assure that all data is accurate. If you have suggestions for improving this survey, please contact one of the authors.
The 2023 Milliman Long Term Care Insurance Survey is the 25th consecutive annual review of stand-alone long-term care insurance (LTCI) published by Broker World magazine. It analyzes the marketplace, reports sales distributions, and describes available products.
More discussion of worksite sales, including a comparison of worksite sales distributions vs. non-worksite sales distributions will be in Broker World magazine’s August issue.
Unless otherwise indicated, references are solely to U.S. stand-alone LTCI sales, excluding exercised future purchase options (FPOs) or other changes to existing coverage. “Stand-alone” refers to LTCI policies that do not include death benefits (other than returning premiums upon death or waiving a surviving spouse’s premiums) or annuity or disability income benefits. Where referenced, “combo” or “combination” products provide LTCI combined with life insurance or annuity coverage. “Linked benefit” policies are combo policies which can allow more than the death benefit or annuity account value to be used as LTCI.
All references to sales in terms of “premium” refer to “annualized” premium (1 x annual; 2 x semi-annual; 4 x quarterly; 12 x monthly), even if only one monthly premium was received before year-end. All references to “Washington” or “WA” refer to the state of Washington. “WCF” refers to the “WA Cares Fund,” explained in the Market Perspective section.
Highlights from this year’s survey
As reported last year, the WCF stimulated tremendous market demand in the state of Washington, causing sales distributions to vary greatly from recent history. Although the industry largely stopped accepting Washington applications in August 2021, a backlog resulted in some policies being issued in 2022. To get a better understanding of the impact of the backlog, we asked insurers to reclassify 2022 sales to 2021 if they were issued in 2022 due to the unusual lag. For the purpose of compiling results for this article, figures that display industry sales levels reflect our adjustments because of the backlog. However, all insurer-specific sales data ignores any backlog adjustment. In the sales distributions section of our report, some insurers’ data reflect the sales backlog (i.e., 2021 sales that lagged into 2022) while other insurers were able to remove them. For that reason, we generally anticipate that 2022 sales distributions are likely to differ from 2023 sales distributions.
Participants Seven insurers (Bankers Life, Knights of Columbus, Mutual of Omaha, National Guardian Life, New York Life, Northwestern, and Thrivent) contributed broadly to stand-alone sales distributions reported herein. Total 2022 sales data includes one additional insurer and 2022 inforce data includes two additional organizations.
Our worksite sales distributions do not reflect low-price worksite programs; however, the gap in average premiums was smaller than usual. Carriers that provided 2022 distributions had an average worksite annual premium of $2,565, whereas the insurers that provided sales, but not distributions, had an average worksite premium of $1,876 annually.
In 2021, we collected data on combination sales (life insurance with LTCI or Chronic Illness benefits) for the first time to evaluate the impact of the WCF exemption on sales. This year, we did so again. The following eleven insurers contributed to our combination sales data: AFLAC, John Hancock, Mass Mutual, New York Life, Nationwide, Northwestern Mutual (Northwestern), OneAmerica, Pacific Life (2021 data only), Securian, Trustmark and United of Omaha.
Sales Summary
We estimate total stand-alone LTCI annualized new premium sales of nearly $124 million in 2022 (including exercised FPOs except FPOs for insurers no longer selling LTCI and counting 10 percent of single premium), compared to $200 million in 2021 (same basis). The 2021 sales are influenced by the higher Washington sales and include estimated sales for one insurer for which we did not estimate sales this year. In addition, there was a $7 million drop in 2022 in new premium from FPOs.
Outside-of-Washington sales trends are likely to be more reflective of the future. Our participants’ outside-of-Washington 2022 premium (including FPOs) was eight percent higher than their outside-of-Washington 2021 new premium. However, compared to 2020 sales including insurers which have left the market, the sales dropped 23 percent. The continuing insurers have been able to maintain their own sales levels (2022 premium was 99 percent of 2020) but not replace the sales of departing insurers. On a lives basis, the 2022 sales data was roughly 88 percent of 2020 for continuing insurers (versus the 99 percent on a premium basis), reflective of the higher prices of today’s stand-alone LTCI policies.
Worksite sales receded significantly from their higher, Washington-impacted 2021 sales. All participants reported worksite sales of 2,213 lives and $8.7 million in premium, compared to pandemic-influenced 2020 sales of 2,124 lives and $7.2 million of premium. Transamerica, which produced more 2020 worksite sales than all our participants combined, stopped selling in the first half of 2021, depressing product availability, and is not included in the sales in this paragraph. Thus, our participants did not absorb Transamerica’s share of the worksite market.
Northwestern led in annualized new premium including FPO elections, selling 13 percent more than the #2 and #3 insurers combined (Mutual of Omaha and New York Life). Northwestern edged ahead of Mutual of Omaha in annualized premium from new policies although Mutual of Omaha still sold more new policies.
Reflecting nine entities’ data, the inforce number of cases dropped 1.4 percent while annualized premium increased 3.5 percent. Inforce premium rises due to sales, price increases, and benefit increases (including FPOs), and falls from lapses, reductions in coverage, deaths, and shifts to paid-up status. The number of people with stand-alone coverage increased through 2014, but, as shown in Table 1, has decreased annually since then except for the 2021 aberration. However, the inforce premium has increased each year because of inforce price increases and higher prices for new policies.
Collectively, eight participants paid five percent more in claims in 2022 than in 2021. Overall, the stand-alone LTCI industry incurred $13.6 billion in claims in 2021 based on companies’ statutory annual filings, a 5.4 percent increase over 2020, which raises the running total of incurred claims since 1991 to $180.9 billion (2021 claims of $13.6 billion plus total of $167.3 billion from our prior year’s article). Most of these claims were incurred by insurers that no longer sell LTCI.
About the Survey This article is arranged in the following sections:
Highlights provides a high-level view of results.
Market Perspective provides insights into the LTCI market.
Claims presents industry-level claims data.
Sales Statistical Analysis presents industry-level sales distributions reflecting data from 8 insurers.
Partnership Programs discusses the impact of the state partnerships for LTCI.
ONLY AVAILABLE AT WWW.BROKERWORLDMAG.COM:
Product Exhibit shows, for 6 insurers: financial ratings, LTCI sales and inforce policies, and product details.
Product Exhibit Details, a row-by-row definition of the product exhibit entries, with some commentary.
Premium Exhibit shows lifetime annual premiums for each insurer’s most common underwriting class, for issue ages 40, 50, 60, and 70 for single females, single males, and female/male couples (assuming both buy at the same age), based on $100 per day (or closest equivalent weekly or monthly) benefit, 90-day facility and most common home care elimination period, three-year and five-year benefit periods or $100,000 and $200,000 maximum lifetime buckets, with and without Shared Care and with flat benefits or automatic three or five percent annual compound benefit increases for life. Worksite premiums do not reflect any worksite-specific discount, though some carriers offer this.
Premium Adjustments (from our Premium Exhibit prices) by underwriting class for each participant.
Distribution by underwriting class for each participant. Depending upon the product shown for an insurer in the Product Exhibit, we sometimes adjust that insurer’s underwriting distribution to provide readers a better expectation of likely results if they submit an application in the coming year and to line up with the prices we display. For example, if the Product Exhibit shows only a new product which has only one underwriting class (hence one price), but the insurer’s data partly or solely reflect an older product with three underwriting classifications, we might choose to show “100 percent” in their best (only) underwriting class.
State-by-state results show the percentage of sales by state, average premium by state and percentage of policies qualifying for Partnership by state.
MARKET PERSPECTIVE (more detail in subsequent parts of the article) Washington State’s “Washington Cares Fund” (WCF) stimulated tremendous demand for private LTCI from individuals and businesses in Washington in 2021. WCF imposes a 0.58 percent payroll tax to fund a $36,500 lifetime pool (intended to inflate according to the Washington consumer price index) for care, as defined in the Revised Code of Washington 50B.04, received in Washington. People who purchased private stand-alone or combination LTCI by November 1, 2021 could file to be exempt from the tax. WCF received approximately 484,000 applications for exemption.1
Partly because the tax applies to all earned income, 2021 LTCI sales in Washington soared to unprecedented levels. Insurers quickly became backlogged with applications and were concerned about early lapses as the law provided a permanent WCF exemption based on only a one-time attestation. Insurers reduced design flexibility, and then discontinued sales in Washington before the November 1 deadline.
(Note: The WCF continues to contemplate further program changes. In particular, a future change may require retention of private LTCI coverage to maintain exemption from the WCF tax and some care outside of Washington might be covered.)
Last year, we estimated that Washington accounted for 75 percent of stand-alone LTCI policies sold in 2021. Of combination life/LTCI business with on-going premium (i.e., excluding single premium), we estimate Washington accounted for 60 percent of policies sold in 2021 but only 20 percent of premium. This year, even after adjusting with data from the NAIC and removing FPOs, the stand-alone policy percentage remains 75 percent. As shown in Table 3, the percentage of 2021 combo policies sold in WA is revised from 60 to 54 percent because we added a carrier with a relatively small percentage of its business in Washington.
Washington continued to account for a high percentage of business issued in 2022 because of delayed processing of third quarter 2021 applications. With participants’ help, we moved 76 percent of 2022 WA stand-alone policies issued (33 percent of premium) and 66 percent of 2022 WA combo policies (26 percent of premium) to 2021. Moving these policies increased 2021 Washington sales only by five percent (4 percent of premium).
(Note: Washington’s share on stand-alone LTCI premiums is generally a bit lower than its share by policy count. We believe that is partly because some insurers have higher prices in other states such as CA, FL, and NY.)
Table 2 reveals that the WCF exemption seems to have stimulated additional sales beginning in 2020, boosting Washington’s market share of stand-alone policies to three percent in 2020 compared to a steady 2.4 to 2.5 percent prior to 2020. Washington’s market share in 2022 returned close to pre-2021 levels on an adjusted basis, both with and without adjusting for the mix of insurers across years. This suggests that our adjusted Washington 2022 market share is at most slightly influenced by the WCF exemption, but we will continue to monitor in future surveys.
Last year, we reported that insurers (including estimates for insurers which did not report sales) sold 90 times as many stand-alone LTCI coverages in Washington in 2021 as in 2020. After reflecting re-classification from 2022 and reviewing the 2020 and 2021 NAIC LTCI Experience Reports, we conclude that the 2021 number of Washington stand-alone LTCI sales remained approximately 90 times 2020 Washington sales. The ratio varies significantly between the worksite (483) and individual markets (26).
Last year, we reported that Life/LTCI combo insurers also sold more than 90 times as many coverages in Washington in 2021 as in 2020. This year’s updated calculation found a similar 89 times the 2020 total. The ratio varies significantly between worksite (578) and individual insurers (21).
Combining both stand-alone and combo polices, 90 times as many coverages were sold in Washington in 2021 as in 2020 but only 12 times as much premium.
Compared to 2020, the 2022 number of Life/LTCi sales in Washington is high but the 2022 premium is low, suggesting that we did not reclassify all of the lag.
In its 2022 report (“The WA Cares Act: Impact on Long Term Care and Hybrid Life Sales”), LIMRA reported the following third- and fourth-quarter increases in WA production in 2021 compared to the same period the previous year.
As dramatic as the LIMRA data is, our data shows much larger increases in Washington sales in 2021. The difference is primarily attributable to our inclusion of insurers focused on the worksite market (including group insurance). There was a huge demand for LTCi-related programs from Washington’s employers. A second, much smaller reason is our re-characterization of delayed sales back to 2021.
Idaho and Oregon also were impacted by the WCF exemption. Because WCF has been amended to allow out-of-state residents who work in Washington to be exempt, those sales may be at higher risk of lapsing as out-of-state residents no longer need to have a qualifying LTCI policy to be exempt. Table 5 shows Idaho and Oregon market share for the past several years. Our Idaho data shows a doubling of sales in 2021, but nearly back to pre-2021 levels for 2022. Our participants’ Oregon sales show little impact. However, as noted above, our statistical distributions do not reflect the worksite insurers. We believe inclusion of their data could show an approximately 50 percent increase in OR in 2021.
LIMRA kindly shared some of its sales findings as shown in table 6 (with some columns we added based on their data). As you can see, linked-benefit policies (“LTC Extension of Benefits”) and stand-alone LTCI (“traditional LTCI”) accounted for 20.2 percent of the policies and 16.6 percent of the premium.
In terms of protecting people against the risk of needing LTC, the contributions of stand-alone LTCI and linked-benefit products compared to acceleration products are likely greater than one might guess from these sales results. Consider:
Linked-Benefit and Stand-alone LTCI policies have lower voluntary termination rates, hence are more likely to be available when care is needed.
Linked-Benefit and Stand-Alone LTCI policies often have benefits that increase over time to help maintain purchasing power. Conversely, the purchasing power of Chronic Illness (CI) and LTC Riders (ADB) dwindles over time. However, purchasing power is a combination of the initial benefit plus increases; a large flat benefit could be sufficient when care is needed.
According to LIMRA, 88 percent of the CI policies have benefits that are not fixed. The insured has to cover the time value of money until death or expected death and sometimes other factors such as foregone premiums.
People are most likely to make LTC-related claims against stand-alone LTCI (it is use-it-or-lose-it) and second-most-likely to do so against linked-benefit products (to access the extension of benefits). Those products are more often purchased with LTC coverage in mind. In contrast, it may be more attractive to wait for the death benefit of acceleration policies, especially if the death benefit would be discounted when accessed to cover a LTC need.
Washington sales influenced the characteristics of 2021 sales significantly, as we reported last year and can be seen in this year’s results. Our sales distributions for 2022 continue to be somewhat influenced by Washington sales due to the backlog of policies that were not issued until 2022. Although we removed some of those backlogged Washington sales from our statistical distributions, we were unable to remove all such sales.
The national placement rate of 58.2 percent in 2022 was lower than the 61.4 percent in 2021 (unusually high due to Washington sales) but 0.4 percent higher than the 57.8 percent placement rate in 2020, as well as 4.1 percent higher than 2021’s 54.1 percent placement rate outside Washington. Our 2022 data includes some delayed young Washington applicants with higher placement rates.
Higher placement ratios are critical to encourage financial advisors to mention LTCI to clients. The following opportunities can improve placement rates.
E-applications speed submission and reduce processing time, thus generally increasing placement.
Uploading medical records via human application program interface (API) also speeds processing time, generally improving placement.
Health pre-qualification effectively and efficiently decreases decline rates.
Education of distributors, such as drill-down questions in on-line underwriting guides, tends to improve placement.
Requiring cash with the application (CWA) led to about five percent more of the apps being placed according to our 2019 survey.
Improved messaging regarding the value of LTCI and of buying now (rather than in the future) typically improves the placement rate by attracting younger and healthier applicants.
Other states are considering state-run LTCI programs. Examples include:
During 2023, alternatives identified by a California task force will be priced and recommendations will be made to the legislature for possible 2024 legislation.
In New York, SB 9082 was submitted in 2022 and Governor Hochul issued an executive order in November 2022 citing her “vision of a long-term care system that is accessible, effective, and affordable.”2
Minnesota, which has twice had bills for a state LTCI program, intends to produce a report in 2023 regarding Minnesota’s options to finance LTC that will be provided to the legislature.
There is a proposal in Massachusetts to create a task force to consider alternatives.
Such programs will likely differ from Washington’s program in several respects. For example, draft laws and task force discussions indicate that future laws:
May not leave the window open for people to opt out by buying LTCI after the legislation has been signed.
May require that private LTCI policies remain in force to maintain exemption.
May narrow the range of private LTCI policies that qualify for exemption.
The FPO (future purchase option, a guaranteed, or a non-guaranteed board-approved, option, under specified conditions, to purchase additional coverage without demonstrating good health) election rate dropped from 78.2 percent in 2021 to 69.9 percent in 2022, the decrease being more than explained by one more entity reporting FPO elections in 2022. The same six insurers which reported 78.2 percent in 2021 reported 88.4 percent in 2022.
As both the additional coverage and unit price increase for FPOs as policies age, FPOs become increasingly expensive, even more so with inforce price increases. The high election rate reflects the effectiveness of annual (as opposed to triennial) negative-election FPOs and may reflect the importance of LTCI to policyholders. Negative-election FPOs activate automatically unless the client rejects them. Positive-election FPOs activate only if the client initiates a timely request. Considering such FPOs and other increased coverage provisions, we project a maximum benefit at age 80 of $310/day for an average 57-year-old purchaser in 2022, which is equivalent to an average 2.7 percent compounded benefit increase between 2022 and 2045. In 2020, the average 58-year-old purchaser anticipated an age 80 benefit (in 2042) of $305 (2.9 percent compounding). So, the average 2022 purchaser will have $5 more in coverage at age 80, despite facing 3 more years of inflation in the cost of care. This is the lowest effective rate of compounding that we have seen in the survey, yet inflation appears to be an increasing threat now. Purchasers may be disappointed if the purchasing power of their LTCI policies deteriorates over time.
Current premiums are much more stable than past premiums, partly because today’s premiums reflect much more conservative assumptions based on far more credible data as well as lower assumed investment yields. Two participants have never increased premiums on inforce policies and a third has had no increases on policies issued since 2003. None of the participants have raised rates on policies issued in 2016 or later. Even for new products, pricing changes are becoming rare. There have been no new prices (other than late state approvals) in the past two years. Nonetheless, financial advisors may presume new policies will face steep price increases, hence be reluctant to encourage clients to consider LTCI.
Linked benefit and other combination products’ coverage are attractive to consumers because if the insured never has a LTC claim, their beneficiary will receive a death benefit. They also are more likely to have indemnity benefits and guaranteed premiums and benefits.
However, such policies generally cost more than stand-alone LTCI without a return of premium feature (if there is comparable LTC coverage at age 85), although the difference may be less than in the past. Higher interest rates and competition appear to be driving linked-benefit premiums lower, which are also more available now with on-going premiums. Meanwhile, stand-alone LTCI new business prices have generally increased in recent years, especially for one-of-a-couple sales.
As explained above, stand-alone and linked-benefit products typically provide more LTC protection at age 85 than those combination policies which provide LTCI only through an accelerated death benefit.
All the insurers in our Product Exhibit offer coverage in all U.S. jurisdictions, except that two insurers do not offer policies in New York.
At the suggestion of a reader, we surveyed carriers regarding hospice provisions this year. Eight insurers responded.
Five insurers define “hospice services” as being within six months of expected death, while one insurer indicated that their definition varies between 6 and 12 months depending on jurisdiction. Two insurers use a more general definition (e.g., “persons who are in the last phases of life due to terminal illness”), which is more flexible and seems less likely to conflict with potential future changes in general usage or regulations.
All insurers cover hospice care at home. Two insurers cover hospice only as part of their home care benefits, six insurers cover hospice services in ALFs and nursing homes, and seven insurers cover hospice services in hospice facilities.
None of the insurers cover hospice services provided to the terminally ill person’s family.
Four insurers waive the elimination period (EP) for hospice services; the other four insurers require that the EP be satisfied prior to reimbursing for hospice care.
Of the four insurers that waive the EP for hospice services, one credits hospice days to the “non-hospice” EP if either the insurer or Medicare pays for such days. The other three do not do so.
CLAIMS Independent Third-Party Review (IR) is intended to help assure that LTCI claims are paid appropriately. Since 2009 (in some jurisdictions), if an insurer concludes that a claimant is not chronically ill as defined in the LTCI policy, the insurer must inform the claimant of his/her right to appeal to IR, which is binding on insurers.
In many states, IR is not effective, either because the law was not adopted or because regulators have not set up the required panel of independent reviewer organizations (IROs). Nonetheless, a claimant could ask an insurer to agree to IR.
The Product Exhibit shows that most participants extend IR beyond statutory requirements (e.g., to policies issued prior to the effective date of IR). Some insurers utilize IROs as part of the insurer’s internal appeal process.
A very small percentage of claims go to IR. Indeed, of seven insurers which provided claims information this year, at least three have never had a request for IR.
We are not aware of regulators who track IR results, but Steve LaPierre, President of LTCI Independent Eligibility Review Specialists, LLC (LTCIIERS), the largest IR organization, reports that the insurer’s decision was upheld 98 percent of the time in 2022.
For comparison, a National Nurses United study of CA acute health claims3 indicates that half of the denials referred to independent review were overturned. Acute health insurance and LTCI claims are denied for different reasons which likely explains much of the difference in the rate at which the insurers’ decisions are overturned.
The LTCI industry’s IR experience indicates that insurers, overall, are paying claims appropriately.
Eight participants reported 2022 claims. As some companies are not able to provide complete detailed data, some statistics reported below are more robust than others.
The eight insurers’ combined individual and multi-life claim payments were five percent higher than in 2021.
The LTCI industry has paid out benefits to policyholders far greater than indicated in the following statistics, because most claims are paid by insurers that do not currently sell LTCI.
LTCI claims paid by insurers no longer selling LTCI may differ significantly from the following statistics as their claimants are more likely to have facility-only coverage, be older, and/or have other different policy or demographic characteristics.
In Tables 7 and 8, one insurer, representing 17 percent of inception-to-date claims, was unable to report the number claims since inception and their distribution by venue. “Since inception” means since the insurer first started selling LTCI or as far back as they can report these results (for example, they may have changed claims administration systems and not be able to go all the way back to when they first processed claims).
Table 7 shows the total dollar and number of reported individual and multi-life (not group) LTCI claims. As noted above, total paid claims were up five percent.
Table 8 shows that, for insurers reporting claims data, claims shifted away from nursing homes to assisted living facilities (ALFs). Different insurers contributing data from one year to another and/or contributing differently makes it harder to identify trends. For example, we learned in 2021 that one insurer previously assigned all of a claimant’s benefits based on the venue in the claimant’s first month of claim. Their 2021 and 2022 data is based on the venue for each claim payment, pushing Table 8 toward nursing homes, which implies that the shift from NH to ALF since 2020 and prior years is greater than the table indicates.
In the distribution based on number of claims, a person who received care in more than one venue is counted once for each venue, but not double-counted in the total line. The average claimant is in 1.5 types of venues during the course of the claim; this does not recognize multiple providers within a single type of revenue (e.g., two nursing homes).
Five carriers reported open individual claims at year-end, averaging 70 percent of paid claims, the same as last year.
Table 9 shows average size individual claims since inception: that is, including older claims and reflecting all years of payment. Assisted Living Facility (ALF) claims and Home Care claims showed lower average sizes this year, related to the change in reporting mentioned above. Because 48 percent of claimants since inception have submitted claims from more than one type of venue, the average total claim might be expected to exceed the average claim paid for any particular venue. Individual ALF claims stand out as high each year (albeit not as much this year), probably because:
a) ALF claims appear to have a longer duration compared with other venues.
b) Nursing home costs are most likely to exceed the policy daily/monthly maximum, hence nursing home claims are most likely to understate the cost of care.
c) People who maximize the use of their maximum monthly benefits can generally spend as much in an ALF as in a nursing home.
d) Although some surveys report that on average ALFs cost about half as much as nursing homes, ALFs may have an extra charge for a memory unit or for levels of assistance that align more closely with nursing home care.
Several insurers extend ALF coverage to policies which originally did not include ALF coverage, providing policyholders with significant flexibility at the time of claim but contributing to the insurers’ need for rate increases.
The following factors contribute to a large range of average claim by insurer (see Table 9):
Different markets (by affluence; worksite vs. individual; geography; etc.)
Demographic differences (distribution by gender and age)
Distribution by benefit period, benefit increase feature, shared care, and elimination period. For example, one carrier has a higher average home care claim than its average facility claims because home care was a rider and people who added the home care rider were more likely to add compound inflation also.
Distribution by facility-only policies vs. 50 percent home care vs. 100 percent home care vs. home care only.
Different lengths of time in the business.
Differences in the ways insurers report claims.
*The following factors cause our average claim sizes to be understated.
Approximately 16 percent of inception-to-date individual claims are still open and our data does not include reserve estimates for future payments on open claims.
People who recover, then go on claim again, are counted as multiple insureds, rather than adding their various claims together.
Some of our insurers are unable to report how many claimants were paid for care in multiple venues. Because we therefore overstate their number of claimants, we estimate that our overall average claim is understated by roughly $7,000. That is, the average claim has likely been closer to $61,000 than the $54,000 shown in the table above.
Besides being understated, average claim data does not reflect the value of LTCI benefits from some purchasers’ perspectives, because the many small claims drive down the average claim. LTCI provides significant financial yield for most people who need care one year or longer. A primary purpose of insurance is to protect against adverse results, so the amount of protection, as well as average claim, is important.
Six insurers provided their current individual monthly LTCI claim exposure (note: reflects only initial monthly maximum for one insurer). As shown in Table 10, this figure is 29 times their corresponding monthly LTCI premium income and 46.5 times their 2022 LTCI monthly paid claims. Eight insurers contributed data regarding their inforce distribution by benefit period. Treating endless (lifetime benefit periods) as a 15-year benefit period, we found that their average inforce benefit period has reduced to 6.44 years Increasing the assigned value of the endless benefit period by one year has an impact of approximately 0.22 years on the average inforce benefit period. With annual exposure 29 times annual premium and assuming an average benefit period of 6.44 years, we estimate that total exposure is 184 times annual premium. The average benefit period dropped from 7.14 last year to 6.44 this year because one more insurer contributed data and it has by far the lowest average benefit period.
Five insurers reported their current average individual maximum monthly maximum benefit for claimants, with results ranging from $5,393 to $8,309.
Nursing home (NH) claims are more likely to use the policy’s maximum daily/monthly benefit than ALF claims because ALF daily/monthly costs are generally lower and because policies sometimes have lower maximums for ALFs. ALF claims correspondingly are more likely to use the policy maximum than are adult day care and home care claims.
SALES STATISTICAL ANALYSIS Bankers Life, Knights of Columbus, Mutual of Omaha, National Guardian, New York Life, Northwestern and Thrivent contributed significant background stand-alone LTCI sales data, but some were unable to contribute some data. LifeSecure provided only total stand-alone sales, not distributions.
Sales characteristics vary significantly among insurers based on market differences (individual vs. worksite, affluence, gender distribution, etc.). Year-to-year variations in policy feature distributions may reflect industry trends but may also reflect changes in participants, participant practices and designs, participant or worksite market shares, etc. In 2021, we had major variance from historical results, and we still have some distortion in 2022 as some participants’ distributions include delayed Washington sales from 2021. Statistical differences between the worksite and non-worksite sales will be reported in the August issue of Broker World.
Market Share We include purchased increases on existing policies as new premium because new coverage is being issued. Table 11 shows 2022 new premium, both including and excluding FPOs. In Table 11, no sales were re-characterized from 2022 to 2021. Total sales levels are remarkably similar to 2020.
Northwestern ranks #1 in new premium both when including FPOs and, for the first time, when excluding FPOs. Mutual of Omaha still ranks #1 in the number of new policies (see Policy Exhibit). Together, Northwestern and Mutual of Omaha account for 65 percent of the market, in terms of premium. When paired with New York Life’s growth, the three top carriers represent 81 percent of the market. The premium below includes 100 percent of recurring premiums plus 10 percent of single premiums.
Worksite Market Share After a high year in 2021 due to the WCF exemption, worksite sales dropped in 2022 as shown in Table 12.
Worksite sales normally consist of three different markets as outlined below, the first two of which produce a higher percentage of new insureds than of new premiums. Worksite 2021 sales were largely voluntary but had the age and premium characteristics of core/buy-up due to Washington sales.
Voluntary group coverage generally is less robust than individual coverage.
Core/Buy-Up programs have particularly young age distributions and modest coverage because a lot of people do not buy-up and are less likely to insure spouses.
Executive carve-out programs generally provide the most robust coverage. One-or two-couple executive carve-out sales may not qualify for a multi-life discount with some insurers, hence may not be labeled as worksite sales in submissions to our survey.
The amount of worksite sales reported and its distribution among the sub-markets significantly impact sales characteristics. Unfortunately, our sales distributions do not reflect the insurers focusing in the group voluntary and core/buy-up markets. More information about worksite sales will appear in the August issue of Broker World magazine.
We noted last year that the future of the non-executive carve-out LTCI market is unpredictable with Transamerica’s departure. Other insurers with stand-alone LTCI products did not absorb Transamerica’s market share. It seems likely that combination worksite products are picking up market share.
Affinity Market Share Affinity groups (non-employers such as associations) produced 5.0 percent of 2022 premium (a relatively low percentage as shown in Table 13) and 7.6 percent of 2022 policies. The percentages in Table 13 reflect only participants’ sales.
Characteristics of Policies Sold Average Premium Per Sale To determine the average premium for new sales, we exclude FPOs. As shown in Table 14, the average premium per new insured and per new buying unit increased substantially over 2020 and prior averages. The key contributor was the reduced percentage of small worksite policies resulting from Transamerica’s departure. Higher prices instituted in late 2020 and early 2021 also contributed to the increase.
The influence of small worksite policies is greatly reduced now. Removing the primary insurer in that market produces an average premium per insured of $3,618, as shown in table 14. Including this carrier produces an average premium of $3,556.
The jurisdiction with the lowest average new premium for participants in 2022 (including FPOs and counting 10 percent of single premiums) was Puerto Rico ($1,270), followed by Alaska ($2,759), which in turn was significantly lower than the third-lowest (Kansas, $3,224). The jurisdiction with the highest average premium was West Virginia ($7,497, a spike caused by two single premium sales; with those removed, West Virginia average would have been $4,952). West Virginia was followed by New England states (which typically have high average premiums)—Connecticut ($5,865), Massachusetts ($5,850), Rhode Island ($5,755), and New Hampshire ($5,611).
Data for 2017 and earlier years included FPOs in these calculations, overstating the average premium per new insured and buying unit.
Issue Age Table 15 shows that 5.8 percent of 2022’s policies were sold to people under age 40, which reflects that delayed Washington sales likely affected our distribution of business when comparing to 2020 levels. The reduction in worksite business does not impact this distribution because starting in 2017, we stopped getting sales distributions from insurers focused on the worksite market.
Last year, we estimated that our participants’ average issue age in Washington was about 15 years lower than outside Washington.
Note: one survey participant has a minimum issue age of 40, one will not issue below 30, and one will not issue below 25.
Benefit Period Table 16 summarizes the distribution of sales by benefit period. The average benefit period rebounded to near 2020 levels but there were still more policies issued with 3-year or shorter benefit periods than any year prior to 2021. Delayed Washington sales likely had some impact here; although, insurers instituted minimum premium rules in Washington in 2021 that likely avoided some short benefit period sales.
Monthly Benefit Monthly determination rebounded to 78 percent of policies sold (Table 17). With monthly determination, low-expense days leave more benefits to cover high-expense days, offering more flexibility for insureds. One insurer offers only daily determination; one insurer offers a choice; and the other insurers automatically have monthly (or weekly) determination.
Despite including some delayed Washington policies, the 2022 sales set the record for the highest average maximum monthly benefit ($5,028) (as shown in Table 18). Sales with an initial monthly maximum less than $3,000 ranged from 2.4 percent of an insurer’s sales to 14.7 percent.
Benefit Increase Features Perhaps because of the reduced amount of worksite business or perhaps because general inflation increased, Table 19 shows that there was an increase in the percentage of policies with 4.5+ percent compounding of benefits. However, despite the general inflation experienced in 2022, protection against future inflation generally decreased, compared to 2020, except for the bounce at 4.5+ percent compounding.
“Indexed Level Premium” policies are priced to have a level premium, but the benefit increase is tied to an index such as the consumer price index (CPI).
As shown in Table 20, we project the age 80 maximum daily benefit by increasing the average initial daily benefit from the average issue age to age 80, according to the distribution of benefit increase features, using current future purchase option (FPO) election rates and a five percent per year offer for fixed FPOs. The maximum benefit at age 80 (in 2045) for our 2022 average 57-year-old purchaser projects to $310/day (equivalent to 2.7 percent compounding). Had our average buyer bought an average 2020 policy two years ago at age 55, her/his age 80 benefit would have been $335/day.
In Table 20, the 2022 figure of $310 might look comparable to the 2020 ($305) and 2019 ($306) figures but note that the 2020 and 2019 projections were to 2042 and 2041, respectively. We project only $4 to $5 more daily benefit to offset inflation to 2045 (3 or 4 more years).
Pandemic protocols are likely to increase facility costs and there are a variety of inflationary pressures which apply to LTC staff salaries at all types of venue. Yet, despite greater awareness of inflation, 2022 purchasers, on average, will have 7.5 percent less coverage at age 80 than would have been the case if they had bought an average 2020 policy in 2020. People are likely to be disappointed by the purchasing power of their policies when they need care if actual cost of care trends exceed the protection built into policies. Policies with flat benefits will experience even greater erosion of purchasing power.
FPOs (Table 21) are important to insureds in order to maintain purchasing power, and 70 percent of our participants’ 2022 FPOs were exercised. The high election rate is noteworthy, considering that the cost increases each year due to larger coverage increases each year, increasing unit prices due to age, and additional price increases due to rate increases.
One participant had an election rate of 96 percent, two had 63 to 68 percent, two had 42 to 51 percent, and one had 12.5 percent. The company with the lowest election rate did not contribute data last year. Participants that reported FPO election rates in both 2021 and 2022 had an increase in election rate from 78.2 percent in 2021 to 88.4 percent in 2022, but the average new premium per FPO election dropped.
Higher election rates occur if FPOs are more frequent (i.e., every year vs. every three years), if elections are “negative-election” (i.e., activate automatically unless the client rejects them) as opposed to “positive-election” (i.e., which activate only if the client makes a request), and if policyholders must exercise FPOs to continue to receive future offers.
FPOs can also be important to insurers. Two insurers got a large percentage of their new premium (42 percent for one; 39 percent for the other) from FPO elections.
Elimination Period Table 22 summarizes the distribution of sales by facility elimination period (EP). The percentage of people buying 84-100 day EP rebounded to more than 91 percent. Two insurers saw 9.6 and 12.2 percent of their buyers choose EPs of longer than 100 days.
Table 23 shows the percentage of participant policies with zero-day home care elimination period (but a longer facility elimination period). The purchase rate of an additional-cost zero-day home care EP option is sensitive to the price. Table 23 shows a drop in 0-day home care EP influenced by Transamerica’s departure from the market.
Table 23 also shows the percentage of participant policies with a calendar-day EP. It is important to understand that most calendar-day EP provisions do not start counting until a paid-service day has occurred. The drop in calendar-day EP results from a change in distribution between carriers.
Sales to Couples and Gender Distribution As shown in Table 24, which summarizes the distribution of sales by gender and partner status, a majority of 2022 purchasers (54.1 percent) were once again female, reversing from 2021.
The percentage of accepted applicants who purchase coverage when their partner is declined dropped below 80 percent for the first time since 2018. It varies significantly by insurer based on their couples pricing and their distribution system. Only two insurers were able to report this data. Their results were similar (77 and 80 percent, respectively) for the percentage of accepted applicants who purchased coverage after a partner’s denial.
Shared Care and Other Couples’ Features Table 25 summarizes sales of Shared Care and other couples’ features.
Shared Care allows one spouse/partner to use the other’s available benefits if their own coverage has been depleted or offers a third independent pool the couple can share.
Survivorship waives a survivor’s premium after the first death if specified conditions are met (such as having been inforce for 10 or more years).
Joint waiver of premium (WP) waives both insureds’ premiums if either insured qualifies for benefits.
Changes in distribution by carrier can greatly impact year-to-year comparisons (Table 25). Some insurers embed survivorship or joint waiver automatically (sometimes only for particular circumstances such as if Shared Care is purchased), while others offer it for an extra premium or do not offer the feature.
In the top half of Table 25, percentages are based on the number of policies sold to couples who both buy (only limited benefit, for Shared Care). The bottom half of Table 25 shows the percentage of policies that results from dividing by sales of insurers that offer the outlined feature. Joint WP and Survivorship had high election rates this year but Shared Care lagged. For insurers reporting Shared Care sales, the percentage of both-buying couples who opted for Shared Care varied from four to 77 percent. The corresponding percentage of couples with Joint WP varied from 10 to 100 percent and for Survivorship ranged from 2.4 to 12.5 percent. Tables 26 and 27 provide additional breakdown on the characteristics of Shared Care sales. Table 26 shows that, for every benefit period except two year, Shared Care was less common than in 2020. The “other” category represents two insurers which reported a few Shared Care sales with benefit periods shorter than two years.
Table 27 looks only at Shared Care policies and reports their distribution across benefit period, so the percentages must total 100 percent. As most policies have three-year benefit periods, most Shared Care policies had a three-year benefit period (Table 27).
Table 26 shows a low percentage of policies having Shared Care, partly because its denominator includes all policies, even those sold to single people or one of a couple. Table 26 denominators are couples who both bought coverage with the particular benefit period. Table 27’s denominator is the number of Shared Care policies.
Shared Care is generally more concentrated in two- to four-year benefit periods than are all sales. Couples are likely to buy shorter benefit periods because couples plan to help provide care to each other and expect the male partner to not need care for a long time. If the female provides care and the male does not need LTC for a long time, more coverage is available for the surviving female when she needs care. As shown in Table 24, single buyers are more likely to be female and females are more likely to opt for a longer benefit period.
Existence and Type of Home Care Coverage Three participants reported sales of facility-only policies, which accounted for 0.3 percent of total sales. One insurer was responsible for 89 percent of such sales. Nearly 96 percent of the comprehensive policies included home care benefits equal to the facility benefit. The other sales all had a home care benefit of at least 50 percent of the nursing home benefit. The last home-care-only sale in our survey was sold in 2018.
Other Characteristics As shown in Table 28, partial cash alternative features (which allowed claimants, in lieu of any other benefit that month, to use between 10 and 40 percent of their benefits for whatever purpose they wish) were included in fewer of our participants’ policies due to a change in market share among participants. One insurer sold 89 percent of such features, which demonstrates how a shift in distribution between insurers can change sales distributions.
Return of premium (ROP) features were included in 7.6 percent of policies. ROP returns some or all premiums (usually reduced by paid LTCI benefits) when a policyholder dies. Roughly 69 percent of ROP features were embedded automatically in the product. Embedded features are designed to raise premiums minimally, typically decreasing the ROP benefit to $0 by age 75. Table 28 shows a large drop in sales with ROP from historical percentages, which reflects not only a change of distribution between insurers but also a change in distribution between products within an insurer. Correspondingly, the percentage of ROP features that were automatically embedded dropped from nearly 90 percent in 2021. The drop is entirely due to one insurer. Collectively, the other insurers had approximately the same percentage as last year.
Restoration of Benefits (ROB), which restores used benefits when the insured has not needed services for, typically at least six months, was included in 17.6 percent of policies with limited benefit periods. Roughly 90 percent of ROB features were automatically embedded.
Insurers must offer shortened benefit period (SBP) coverage, which makes limited future LTCI benefits available to people who stop paying premiums after three or more years. The insurers able to report SBP sales, sold SBP to 4.1 percent of buyers.
Only one insurer issued non-tax-qualified (NTQ) policies, which accounted for 0.1 percent of total industry sales.
“Captive” (dedicated to one insurer) agents produced 58.8 percent of the sales, a large drop from last year’s Washington-driven share (68.6 percent). Brokers produced the balance. Some direct-to-consumer sales were made but not by our participants. At one time, “captive” agents who sold LTCI tended to specialize in LTCI. Now many are agents of mutual companies.
Sales distribution by jurisdiction is posted on the Broker World website.
Limited Pay and Paid-Up Policies In 2022, two insurers in the survey sold policies that become paid-up in 10 years or less, accounting for 1.2 percent of sales.
Because today’s premiums are more stable compared to policies sold years ago, premium increases are less likely. One of the key reasons for buying 10-year-pay (avoidance of rate increases after the 10th year) is greatly reduced, while the cost of 10-year-pay has increased, making it less attractive for consumers than in the past. Nonetheless, limited-pay and single-pay policies are attractive to minimize post-retirement outflow and to accommodate §1035 exchanges. Limited pay sales have been increasing slowly as a percentage of total sales since 2019.
Seven participants reported that 3.6 percent of their inforce policies are paid-up, an increasing percentage as the number of paid-up policies is increasing while the total number of policies is decreasing.
PARTNERSHIP PROGRAM BACKGROUND When someone applies to Medicaid for long-term care services, most states with Partnership programs disregard assets up to the amount of benefits received from a Partnership-qualified policy (some Indiana and New York policies disregard all assets). Except for California, states with Partnership programs grant reciprocity to Partnership policies issued in other jurisdictions. Partnership programs are approved in 44 jurisdictions, all but AK, DC, HI, MA, MS, UT, and VT. However, MA has a similar program (MassHealth).
Four states (CA, CT, IN and NY) blazed the trail for Partnership programs in the early 1990s. Other states were allowed to adopt simplified and more standardized Partnership regulations as a result of the Deficit Reduction Act of 2005 (DRA).
Approximately 60 percent of Partnership states now allow one percent compounding to qualify for Partnership, which can help low-budget buyers qualify for Partnership and also enable worksite core programs to be Partnership-qualified. A higher percentage of policies will qualify for Partnership in the future if insurers and advisors leverage these opportunities. However, currently only three insurers offer one percent compounding.
Partnership programs could be more successful if:
Advisors offer small maximum monthly benefits more frequently to middle-income individuals. For example, a $1,500 initial maximum monthly benefit covers about four hours of home care every two days and, with compound benefit increases, may maintain buying power. Many middle-income individuals would like LTCI to help them stay at home while not “burning out” family caregivers and could be motivated further by Partnership asset disregard. (This approach does not work in CA, CT, IN and NY because of their high Partnership minimum daily benefit requirements.)
Middle-income prospects were better educated about the importance of benefit increases to maintain LTCI purchasing power and qualify for Partnership asset disregard.
The four original Partnership states migrate to DRA rules.
More jurisdictions adopt Partnership programs.
Programs that privately finance direct mail educational LTCI content from public agencies were adopted more broadly.
Financial advisors were to press reluctant insurers to certify their products and offer one percent compounding.
More financial advisors were certified. Some people argue that certification requirements should be loosened. At a minimum, the renewal certification process could be improved.
Linked benefit products became Partnership-qualified.
PARTNERSHIP PROGRAM SALES Participants reported Partnership sales in 41 states, all authorized states except CA, CT and NY. One carrier sold a Partnership policy in each of the 41 states. One has chosen not to certify Partnership conformance.
Insurance brokers do not have access to Partnership policies in CA, CT and NY and from only one insurer in IN. However, consumers may be able to purchase Partnership-qualified coverage from another entity.
Participants’ Partnership-qualified policies in DRA states rose from 34.6 to 49.9 percent, short of 2020’s 55 percent, presumably influenced by benefit increase provisions being less popular. Minnesota (83.5 percent) leads each year. Wyoming was second (79.5 percent), followed by Maine (73.7 percent) and Wisconsin (70.2 percent). Ten states had between 60 and 70 percent and 23 had at least 50 percent of their policies qualify. Once again, Indiana (5.9 percent) and New Mexico (14.7 percent) were the only states with participant Partnership sales in which fewer than 20 percent qualified.
UNDERWRITING DATA Case Disposition Five insurers contributed application case disposition data to the survey (Table 30). Case resolutions in 2022 were similar to 2020. In 2022, 58.2 percent of applications were placed. One insurer placed 74 percent of its cases; the others placed 50 to 56 percent.
Of cases which were resolved, 28.7 percent were declined or deferred, with the percentage varying from 14.6 to 32.7 percent, depending on insurer. To the degree that a declined applicant got coverage elsewhere or a deferred applicant was ultimately approved, the eventual placement rate for applicants is higher than our data indicates.
Overall, 16.1 percent of cases were suspended or withdrawn during underwriting or not accepted or dropped during the free look period. That is the lowest percentage since 2019. Factors such as age distribution, distribution system, market, underwriting requirements, and underwriting standards affect these results.
Table 31 shows the placement rate by applicant age. This data is a subset of the placement data in Table 30 as some carriers cannot provide this data by age.
Low placement rates increase insurers’ cost per placed policy. More importantly, low placement rates discourage advisors from discussing LTCI with clients. In addition to not wanting to waste time and effort, advisors may fear that declined clients will be dissatisfied. In the Market Perspective section, we listed ways to improve placement rates. This is a critical issue for the industry. If readers have suggestions, they are invited to contact the authors.
Underwriting Tools Five insurers contributed data to Table 32, which divides the number of uses of each underwriting tool by the number of applications processed. For example, the count of instances where medical records were requested was 88 percent of the number of applications. That does not mean that 88 percent of the applications involved medical records, because some applications resulted in more than one set of medical records being requested.
Year-to-year changes in distribution of sales among insurers significantly impact results. Lower maximum ages result in fewer face-to-face exams. Insurers might underreport the use of an underwriting tool because they may lack a good source for that statistic. For example, an insurer might not be able to split phone interviews by whether or not they include cognitive testing.
Underwriting Time Table 33 shows that for six insurers, the average processing time, from receipt of application to mailing the policy, was 49 days. As with other statistics, we believe that our underwriting data overstates the percentage of policies with long underwriting periods because of Washington cases.
Rating Classification Table 34 shows that more than half of 2022 policies were issued in the most favorable rating classification. The table suggests that the percentage of decisions that are either declined or placed in the 3rd or less-attractive classification is reducing slowly, but Table 36 shows that the decline rate was higher in 2022 than in 2020 for each age group. The discrepancy is related to different carriers contributing to the two tables and changing distributions of business.
Tables 35 and 36 show the 2022 percentages of policies issued in the most favorable category and decline decisions by issue age. These tables do not exactly match Table 34 because some participants provide all-age data, rather than separating it by age. The percentage placed in the most favorable classification increased for all ages from 2020 to 2022, at least partly due to changing distribution by age.
The decline rate was higher in 2022 than in 2020 for each age group, even though the younger ages still reflect some 2021 lagged sales. For the past 3 years, the percentage placed in the most favorable classification has been higher for ages 75+ than for ages 70-74 and the decline rate has been lower. The age 75+ block is the smallest and most susceptible to statistical fluctuation, but the primary cause appears to be different distribution of insurers by age. For example, some insurers do not have a “preferred” health discount; the bulk of their policies are issued in their “most favorable” class.
Product Exhibit shows, for 6 insurers: financial ratings, LTCI sales and inforce policies, and product details.
Product Details, a row-by-row definition of the product exhibit entries, with commentary.
Premium Exhibit, which shows lifetime annual premiums for each insurer’s most common underwriting class, for issue ages 40, 50, 60, and 70 for single females, single males, and female/male couples (assuming both are the same age), based on $100 per day (or closest equivalent monthly) benefit, 90-day facility and default home care elimination period (other aspects vary), three-year and five-year benefit periods or $100,000 and $200,000 maximum lifetime buckets, with and without Shared Care and with flat benefits or automatic three and five percent annual compound benefit increases for life. The exhibit includes facility-only policies, as well as comprehensive policies. Worksite products do not reflect any worksite-specific discount.
Premium Adjustments (from our published prices) by underwriting class for each participant.
State-by-state results: percentage of sales by state, average premium by state and percentage of policies qualifying for Partnership by state.
CLOSING We thank insurance company staff for submitting the data and responding to questions promptly. We thank our reader, Ellen Atkins, who suggested we explore the differences in hospice benefits among our participants. We also thank Sophia Fosdick and Quentin Clemens of Milliman for managing the data expertly.
We reviewed data for reasonableness and insurers reviewed their product exhibit displays. Nonetheless, we cannot assure that all data is accurate.
If you have suggestions for improving this survey (including new entrants in the market), please contact one of the authors.
The 2022 Milliman Long Term Care Insurance Survey, published in the July issue of Broker World magazine, was the 24th consecutive annual review of long-term care insurance (LTCI) published by Broker World magazine. It analyzed product sales, reported sales distributions, and detailed insurer and product characteristics.
From 2006-2009, Broker World magazine published separate group LTCI surveys, but discontinued those surveys when the availability of group LTCI policies shrank. In 2011, Broker World magazine began this August annual analysis of worksite (“WS”) sales to complement the July overall market analysis.
The WS market consists of individual policies and group certificates (“policies” comprises both henceforth) sold with employer support, such as permitting on-site solicitation and/or payroll deduction. If a business owner buys a policy for herself and pays for it through her business, participants likely would not report her policy as a WS policy because it was not part of a WS group. If an employer sponsors general LTC/LTCI educational meetings, with employees pursuing any interest in LTCI off-site, sales would not be reported as WS sales.
We limit our analysis to US sales and exclude “combination” products, except where specifically indicated. (Combination products pay meaningful life insurance, annuity, or disability income benefits in addition to LTCI.)
About the Survey Our survey includes WS sales and statistical distributions from National Guardian Life, New York Life, and Northwestern, and WS sales data from LifeSecure. We estimated sales from four other stand-alone LTCI insurers and compare WS sales to individual LTCI policies that are not WS policies (NWS) and to total sales (Total).
Highlights from This Year’s Survey
As we reported in our July 2022 article, results are heavily influenced by the state of Washington’s “Washington Cares Fund” (WCF, see the “Market Perspective” section for more info). To study the impact of the WCF, we surveyed combination product life insurers in addition to our typical survey of stand-alone LTCI companies. Approximately 60 percent of sales in each line occurred in Washington (“WA”). The industry sold more than 90 times as many stand-alone LTCI policies sales in WA in 2021 than in 2020 and, based on a significant sampling of combination (life and LTCI) policies, that product line also experienced in WA more than 90 times as many sales in 2021 than in 2020.
Driven by WCF’s exemption for private LTCI coverage, we estimate about 9.3 times as many stand-alone WS sales in 2021 (approximately 90,000 in 2021) compared to 2020, while NWS sales increased 47 percent. However, we estimate that new annualized premium grew at a slower pace compared to policy counts—WS premium tripled in 2021 (approximately $60 million in 2021), while NWS premium increased by six percent. The smaller growth in premium arises because the 2021 sales had a higher mix of younger age individuals and a higher mix of less-expensive policies, which was driven by WA sales where individuals sought lower cost policies that would earn exemption from WCF. Our data does not allow us to estimate how much stand-alone LTCI WS sales increased in WA.
Our WS stand-alone statistical distributions can vary significantly from year-to-year because insurers focusing on particular WS markets may be over- or under-represented. We estimate that our statistical distributions reflect only about five percent of WS policies. The carriers providing 2021 statistical data had an average WS annual premium of $2,077 (less than half as much as last year, due to WA sales), whereas the others had an estimated average WS premium of $600, which indicates that our statistical analysis continues to be overly weighted toward executive carve-out programs.
Ten insurers contributed combination sales data: AFLAC, John Hancock, Mass Mutual, New York Life, Nationwide, Northwestern Mutual, OneAmerica, PacLife, Securian, and Trustmark. 64.9 percent of their national combined 300,000 sales and 13.4 percent of their national $1.1 billion of new annualized premium were WS sales. Of national WS combined Life/LTCI sales, 73 percent of both the new policies and new premium were in WA. Within WA, 79 percent of new policies and 50 percent of new premium came from WS sales.
Although we have a significant sample, full industry life/LTCI combination sales may differ significantly if our data is over-weighted (or under-weighted) toward WS business, as the WS market grew in WA much more than the NWS market did.
MARKET PERSPECTIVE The three segments of the WS market (which may apply to different employee classes in a single case):
In “core” (also known as “core/buy-up”) programs, employers pay for a small amount of coverage for generally a large number of employees. Employees can buy more coverage. “Core” programs generally have low average ages, short benefit periods, low daily maximum benefits and a small percentage of spouses insured.
In “carve-out” programs, employers pay for robust coverage for key executives and usually their spouses. Generally, executives can buy more coverage for themselves or spouses. Compared to “core” programs, a higher percentage of insureds are married, more spouses buy coverage, the age distribution is older and average premium is higher.
In “voluntary” programs, employers pay none of the cost. The typical coverage is more robust than “core” programs, but less robust than “carve-out” programs. Voluntary programs tend to be most weighted toward female purchasers.
National Guardian, New York Life, and Northwestern write mostly executive carve-out programs and are the only insurers that contributed to our statistical distributions; therefore, our data is heavily-weighted to the executive carve-out market.
Because of tax savings, small executive carve-out issue dates are weighted toward the end of the year. On the other hand, large voluntary cases are traditionally weighted toward fall enrollments with January 1 effective dates. Large voluntary cases are probably more evenly distributed through the year than in the past, but differences remain.
Carrier and product shift: The future of the non-executive carve-out LTCI market is unpredictable with Transamerica’s departure. Even if LifeSecure, Mutual of Omaha, and National Guardian pick up market share, WS stand-alone LTCI sales might drop, at least temporarily because it takes time for competitors to fill in after an insurer drops out.
Particularly for young and less-affluent groups, voluntary programs may gravitate toward products that include life insurance, which is viewed as a more immediate potential need by young employees with families. The possibility of guaranteed issue also draws employee benefit advisors and employers to such products. Such products can allow 100 to 300 percent of the death benefit to be used for LTC, at a typical rate of four percent of the death benefit per month. Unfortunately, combination WS products’ LTCI benefits can lose substantial purchasing power by retirement years because the benefit typically does not increase.
WCF: WA state’s “Washington Cares Fund” imposes a 0.58 percent employee-paid payroll tax to fund a $36,500 lifetime pool (intended to inflate according to the WA consumer price index) for care received in WA as defined in the Revised Code of WA 50B.04. However, people who purchased qualifying private stand-alone or combination LTCI by November 1, 2021 could file to be exempt from the tax. (Note: WCF had received 478,173 applications for exemption as of June 13, 2022.1)
Other jurisdictions may create state-run LTCI programs, but they may not create a window for people to become exempt by buying insurance after the law has passed.
COVID: COVID-19 (COVID) continues to impact the employee benefit market in many ways. As LTCI is generally not perceived to be an urgently-needed benefit, LTCI may be more impacted than some other benefits. Employers potentially have various existential issues that may take precedence over offering LTCI. Staff turn-over is generally higher and more positions are vacant. Shifting of the workforce to remote can be harder to enroll, all else equal.
Nonetheless, COVID did not appear to deter the WA WS sales and, as a result of COVID, there is increased awareness of the LTC risk and of personal exposure and increased interest in staying out of nursing homes. More workers may have elders living in their homes and, if they are remote workers, the needs of those elders are more likely to interfere with their productivity.
Pricing and Underwriting Considerations: Most people interpret Title VII of the 1964 Civil Rights Act to require that employer-involved LTCI programs use unisex pricing if the employer has had at least 15 employees for at least 20 weeks either in the current or previous year. Some states apply similar laws to employers with fewer employees. Thus, for WS sales, insurers must create a separate unisex-priced product. The expense of separate pricing, marketing and administration discourages insurers from serving both the WS and NWS markets.
Moreover, insurers fear anti-selection. Because women have higher expected future claims, unisex pricing saves women money compared to gender-distinct NWS pricing, whereas men pay much more for WS than for NWS policies. The higher the percentage of female buyers in the WS, the more unisex pricing is likely to approach gender-distinct female pricing levels.
Insurers also fear health anti-selection (less-healthy people buying, while healthier people do not buy). Insurers are more vulnerable to health- or gender-anti-selection if the group has a large portion of young or less affluent employees as this group is generally less likely to buy LTCI.
Furthermore, because WS programs rarely offer “preferred health” discounts, healthy couples may pay more for WS coverage than for corresponding NWS coverage. Although there are few health concessions in the stand-alone WS market at this time, some combination products offer guaranteed issue if participation requirements are satisfied.
To control risk, most insurers will not accept a voluntary WS program if there are fewer than 100 employees. However, one insurer (which offers no health concessions) will accept voluntary LTCI programs with as few as 2 to 5 (varies by jurisdiction) employees buying.
In the carve-out market, a more expensive WS product can still produce after-tax savings compared to a cheaper NWS policy, because of tax advantages when an employer pays the premium. The specter of future tax increases enhances the attractiveness of employer-paid premium.
Availability of coverage: Some insurers have raised their minimum issue age to avoid anti-selection (few people buy below age 40) and to reduce exposure to extremely long claims. Such age restrictions can discourage employers from introducing a program, especially a carve-out program if they have executives or spouses under age 40.
With increased remote work, more employers have employees stretched across multiple jurisdictions and eligible non-household relatives might live anywhere. But insurers are less likely than in the past to offer LTCI in jurisdictions with difficult laws, regulations or practices. So, it can be difficult to find an insurer which can cover everyone unless LTCI is sold on a group policy form and the employer does not have individuals in extra-territorial states.
One insurer no longer offers WS LTCI to non-household relatives. Reduced availability for such relatives does not have much impact on sales, because only about one percent of WS sales are to non-household relatives. However, it undermines the suggestion that WS LTCI programs might reduce the negative impact of employees being caregivers.
Prior to gender-distinct pricing, an executive carve-out for two partners of a company with more than 15 employees could have been serviced by any LTCI company, but now it is hard to find a carrier that offers unisex pricing under such circumstances. Such executives may buy policies with gender-distinct pricing either because they are unaware of the requirement under Title VII of 1964 Civil Rights Act; they may disagree with the interpretation that such policies should have unisex pricing to avoid the risk of a civil rights complaint, etc.
Some employee benefit brokers are reluctant to embrace LTCI because of declinations, the effort of enrollment, certification requirements, their personal lack of expertise, etc. WS sales gain from LTCI specialists forming relationships with employee benefit brokers.
Support for Employees who are Caregivers: Various programs offer LTC-related services to employees and their families. Regardless of whether the employee is insured or the relative is insurable, they may be able to access information, advice, services, and products that make caregiving more efficient, more effective, safer, and less expensive. Enabling employees and their families to have better LTC experiences and to use more (not necessarily 100 percent) commercial care should boost productivity at work. Some of these programs are packaged with WS LTCI.
STATISTICAL ANALYSIS As mentioned earlier, insurers’ sales distributions can vary greatly based on the submarket they serve (for example, in the WS market: core, voluntary, or carve-out). Therefore, in addition to fundamental changes in the industry, distributions may vary significantly from year to year due to a change in participating insurers, distribution within an insurer, and market share among insurers. Policies in the carve-out market are designed similarly to those in the NWS market. Our sales distributions reflect only stand-alone LTCI and only about five percent of stand-alone WS policies issued in 2021, unless otherwise noted. The distributions mostly represent the executive carve-out market, as these insurers averaged 10.6 issues per case.
Sales and Market Share Table 1 shows historical WS sales, including some estimates. It shows overall average WS premium for all carriers which reported sales compared to the average WS premium for the participants who contributed statistical data beyond sales. As shown in the table, until 2017, our WS statistics likely represented the broad WS market reasonably. Average premiums plummeted this year because of the WA sales.
Table 2 shows WS sales as a percentage of total LTCI sales, both including estimates. WA sales caused WS sales to be larger percentage of the total compared to past survey data.
Table 3 and the following tables do not include estimates. Thus, Transamerica, which was the #1 insurer in 2020 and 2021, is not included. LifeSecure leapfrogged to the top.
Average Premium Per Buyer Table 4 shows that, in 2021, the average premium per insured in the WS market dropped twice as much from 2020 levels than did the average premium in the NWS market.
As always, the average premium per buying unit (a couple comprise a single buying unit) is higher because there are fewer buying units than insureds. Normally, the increase in average premium per buying unit compared to per insured is significantly lower for WS sales, because more WS buyers are single and because spouses are less likely to buy in the WS. Those factors are muted materially because our data is weighted toward the carveout market. In 2021, the reported differences are small, perhaps influenced by the WA sales.
The average premium per new insured (NB Insured) reflects all participants, but the average premium per buying unit is determined solely by the participants who report sales based on marital status. The WS ratio is probably overstated because participants who reported premium by marital status for the WS are not characteristic of the entire market.
Issue Age In reviewing the balance of the statistical presentations, we urge you to be selective in how you use the data because it is not representative of the entire WS market as explained above.
Table 5 shows that WA sales dropped the average age in the NWS market by 7 years, but only by 3 years in the WS market. If our data included more of the WS market, our WS average age might have dipped more.
Table 7 displays the relative age distribution of workers ages 16+ vs. the age distribution of purchasers in the WS market. It also shows the age distribution of adults 20-79 compared to the age distribution of purchasers in the NWS market. If the percentage of sales in a particular age group is higher than the percentage of population in that age group, the LTCI industry penetrates that age group well. As was the case last year, when we instituted this table, the industry is particularly effective with ages 30-49 in the WS market. In the NWS market, the industry was particularly effective for ages 50-69 last year, but this year broadened the effective range down to 30 because of WA sales.
Rating Classification Most WS sales are in the “best” underwriting class (see Table 8) because there generally is only one underwriting class. Insurers often do not get enough information in WS to determine whether a “preferred health” discount could be granted and use the additional revenue (from not having a “preferred health” discount) to fund extra cost resulting from gender or health anti-selection. Carve-out programs are more likely to offer a “preferred” discount, which means a higher percentage of carve-out policies are issued in the second-best underwriting class. The percentage of policies issued in the best underwriting class soared in the NWS market in 2021 because younger and healthier buyers were drawn to LTCI in WA. The impact on the WS market was smaller, because so few people did not qualify in the best category in 2020. In each market, about 35 percent of buyers who did not qualify for the best price in 2020 shifted into the best category in 2022.
Benefit Period The WS average benefit period is low for core/buy-up programs and somewhat low for voluntary programs. Executive carve-out programs sometimes have longer benefit periods than the NWS market. In 2021, the average benefit period in each market dropped by about a half-year due to WA sales.
The difference in benefit periods between the markets is actually larger than these statistics indicate, because these statistics ignore Shared Care (and the WS market issues much less Shared Care).
Table 10 shows corresponding data back to 2014. As noted elsewhere, this data can jump around based on which insurers provide such detail and whether large core/buy-up cases are written in a particular year.
Maximum Monthly Benefit In 2020, the average initial monthly maximum was about nine percent lower in the WS market than in the NWS market. In 2021, the difference tripled to 27 percent lower in the WS market. To calculate the average initial monthly maximum, we presume an average size in each size range. The $2,100/month we assume for the smallest size range seems to overstate dramatically in 2021 as many people opted for the minimum $1,500/month.
Table 12 shows that the WS initial monthly maximum has varied more over time than the whole market, because of participant changes and how many core/buy-up plans were sold in a particular year.
Benefit Increase Features As shown in Table 13, 95.5 percent of 2021 WS sales had no benefit increase feature or a future purchase option (FPO), hence no first-year premium for benefit increases. The corresponding NWS percentage was 64.1 percent. The corresponding 2020 sales percentages were 86.4 percent and 47.5 percent.
Future Protection Based on a $27/hour cost for non-professional personal care at home ($27 is the median cost according to Genworth’s 2021 Cost of Care Survey), the average WS initial maximum daily benefit of $100 would cover 3.7 hours of such care per day at issue, whereas the typical NWS initial daily maximum of $137 would cover 5.1 hours of such care per day, as shown in Table 14. This year’s higher cost (the hourly cost was $24 in 2020) and lower initial monthly maximums contributed to the 40 percent decrease in WS hours (from 6.2 WS hours) and 25 percent decrease in NWS hours (from 6.8 NWS hours) from last year.
The number of future home care hours that could be covered depends upon when care is needed (we have assumed age 80), the home care cost inflation rate between now (age 39 for WS and 51 for NWS) and age 80 (we have calculated with two, three, four, five and six percent inflation), and the benefit increases provided by the LTCI coverage between now and age 80.
Table 14 shows calculations for three different assumptions relative to benefit increase features:
The first line presumes that no benefit increases occur (either sold without any benefit increase feature or no FPOs were exercised).
The second line reflects the average benefit increase design using the methodology reported in the July article, except it assumes that 40 percent of FPOs are elected (intended to be indicative of “positive” election FPOs, in which the increase occurs only if the client elects it) and provide five percent compounding.
The third line is like the second line except it assumes 90 percent of FPOs are elected (intended to be indicative of “negative” election FPOs, in which the increase occurs unless the client rejects it). It also assumes the FPOs reflect five percent compounding.
Table 14 indicates that:
Without benefit increases, purchasing power deteriorates significantly, particularly for the WS purchaser as younger buyers have more years of future inflation prior to claim onset. With four percent inflation and no benefit increases, the number of covered hours of home care at age 80 dropped from 1.8 for the average 2019 WS buyer to 1.4 for the average 2020 WS buyer, then to 0.7 (only 42 minutes) for the average 2021 WS buyer. For the average NWS buyer, the corresponding hours of home care at age 80 were 3.0 in 2019, 2.9 in 2020, and 1.6 in 2021.
The “composite” (average) benefit increase design assuming that 40 percent of FPO offers are exercised preserves purchasing power better than when no increases are assumed, but still generally leads to significant loss of purchasing power. The average 2021 WS buyer would have 2.1 hours of covered home care at age 80 rather than the 0.7 hours in #1. The average 2021 NWS buyer would have 3.4 hours of covered home care at age 80 rather than the 1.6 hours in #1.
With 90 percent FPO election rates, the average WS and NWS buyers would experience increased purchasing power over time with 3 percent or less inflation but would lose purchasing power with four percent or more inflation.
Table 14 underscores the importance of considering future purchasing power when buying LTCI. Please note:
a) The average 2021 WS buyer was 12 years younger at issue than the average 2021 NWS buyer, hence has 12 more years of inflation and benefit increases in the above table. The actual inflation rate to age 80 is not likely to be the same for today’s 39-year-olds as for today’s 51-year-olds.
b) WS sales have more FPOs, so WS results are more sensitive to FPO election rates.
c) Individual results vary significantly based on issue age, initial maximum monthly benefit, and benefit increase feature, as well as the inflation rate and the age at which the need for care occurs.
d) By the median age of starting to need care (about age 83) and the median age of needing care (about age 85), more purchasing power could be gained or lost.
e) Table 14 does not reflect coverage for professional home care or facility care. According to the aforementioned 2021 Genworth study, the average nursing home private room cost is $297/day, which is currently comparable to 11 hours of non-professional home care. However, the inflation rate for facility costs is likely to differ from the inflation rate for home care. From 2004-2021, Genworth’s studies showed the following compound growth rates: private room in a nursing home (3.0 percent), assisted living facility (3.8 percent), home health aide (2.2 percent), and home care homemaker (2.6 percent).
f) Table 14 could be distorted by simplifications in our calculations. For example, we assumed that the FPO election rate does not vary by age, size of policy or market and that everyone buys a home care benefit equal to the average facility benefit.
g) FPO election rates might be different for policies purchased in 2021. How likely is it that 2021’s WA buyers will exercise FPOs?
Partnership Program Background When someone applies to Medicaid for long-term care services, most states with Partnership programs disregard assets up to the amount of benefits received from a Partnership-qualified policy (some IN and NY policies disregard all assets). Partnership programs exist in 44 jurisdictions (all but AK, DC, HI, MA, MS, UT, and VT), but MA has a similar program (MassHealth). The first four states to develop Partnerships (CA, CT, IN and NY) have different rules, some of which have become a hindrance to sales. We are not aware of a Partnership-qualified WS LTCI product in those four states, which is unfortunate because the WS market serves many people who could benefit from Partnership.
To qualify for a state Partnership program, a policy must have a sufficiently robust benefit increase feature. Many jurisdictions have lowered the minimum Partnership-eligible compounding benefit inflation rate to one percent. To facilitate Partnership sales in such jurisdictions, an insurer could lower its minimum size by 1/3 (e.g., from $1,500 to $1,000) if one percent compounding is included in a core program. The revenue from the core program would typically increase. The premium would be more level by issue age, shifting risk to the younger ages which can be preferable for the insurer in a core program.
Jurisdictional Distribution Click here for a chart of the market share of each US jurisdiction relative to the total, WS and NWS markets, and the Partnership percentage by state. This chart indicates where relative opportunity may exist to grow LTCI sales.
Elimination Period Approximately 90 percent of the NWS market buys 90-day elimination periods (EPs). For that reason, many WS programs offer only a 90-day EP.
Table 15 shows distribution by EP and how many policies had a 0-day home care feature and a longer facility EP and how many policies had a calendar-day EP (as opposed to a service-day EP). We have reflected that all LifeSecure policies are 90-day EP with a calendar-day definition. Policies which have 0-day home care EP and define their EP as a service-day EP operate almost identically to a calendar-day EP, because people in facilities get daily care.
The large drop in WS 0-day home care EP reflects that Transamerica was in our data last year, but not this year.
Gender Distribution and Sales to Couples and Relatives Insurers began gender-distinct LTCI pricing in 2013, but as explained above, unisex pricing continues in the WS market.
In the NWS market, the 2013-2015 percentages of females were high as insurers that still offered unisex pricing attracted single females. The next 5 years, the percentage of female buyers in the NWS was stable, fluctuating from 54.3 to 54.9 percent. In 2020, women constituted 50.8 percent of the US age 20-79 population2, but in 2021 the percentage of females in the NWS market dipped below 50 percent (49 percent) because of the higher number of males purchasing coverage in WA.
In the WS market, the high percentage of female WS buyers from 2015-2018 suggests that women were particularly attracted to WS LTCI (presumably because of unisex pricing). To the degree that our more recent WS data is over-weighted to executive carve-out programs, it reflects less of the gender anti-selection that likely still exists. Although most executives are male, executive ranks are becoming more gender-balanced and many executive carve-out programs cover spouses. Women make up 47 percent of workers3 but accounted for a bit less (46 percent) of our reported 2021 WS sales. For the third straight year, our data (overly weighted toward executive carveout) has indicated negative gender anti-selection in the WS market, as the 2021 shift to males was stronger in our WS data than in our NWS data.
Table 17 digs deeper, exploring the differences between the WS and NWS markets in single female, couples and Shared Care sales.
Our WS data had fewer single buyers. Despite having more married buyers, there were fewer one-of-a-couple sales and “both buy” couples increased from 45.6 percent of sales to 52.6 percent.
In contrast, the percentage of single people and one-of-a-couple both increased in the NWS market.
Shared Care sales dropped but are likely to rebound in 2021.
Our limited data with regard to relatives who buy shows that two spouses are insured for every three employees. That’s a high percentage reflective of executive carve-out data. Only about one percent of purchasers are relatives other than the employees and employees’ spouses.
Type of Home Care Coverage Table 18 summarizes sales by type of home care coverage. Historically, the WS market sold few policies with a home care maximum equal to the facility maximum. However, with increasing emphasis on home care and simplicity, that difference faded.
Table 18 also shows that monthly determination dominates both markets. The low 2020 monthly determination percentage in the WS was caused primarily by a change in distribution of WS sales among participants.
Many WS products embed a “partial cash alternative” feature (which allow claimants, in lieu of any other benefit that month, to use approximately 1/3 of their benefit for whatever purpose they wish, with the balance extending the benefit period) or a small informal care benefit.
Other Features Table 19 shows that almost all Return of Premium (ROP) features were embedded (automatically included) and phased out before death would be likely. ROP with expiring death benefits may provide an inexpensive way to encourage more young people to buy LTCI but does not address the buyer’s concern (what if I keep paying all my life, then die without qualifying for benefits?).
Table 20 shows lower Joint Waiver of Premium and Survivorship sales to couples in the WS market than in the NWS market, mostly due to differences in distribution by carrier. Some products automatically provide Joint Waiver of Premium if a couple buys identical coverage or if a couple buys Shared Care. Employers sometimes are disinclined to add an optional couples’ feature because they are already contributing more money to cover a married employee plus that employee’s spouse than the cost for a single employee the same age.
CLOSING We thank insurance company staff for submitting the data and responding to questions promptly. We also thank Sophia Fosdick, Rachelle Jacobs, and Zane Truesdell of Milliman for managing the data expertly.
We reviewed data for reasonableness. Nonetheless, we cannot assure that all data is accurate. If you have suggestions for improving this survey, please contact one of the authors.
The 2022 Milliman Long Term Care Insurance Survey is the 24th consecutive annual review of stand-alone long-term care insurance (LTCI) published by Broker World magazine. It analyzes the marketplace, reports sales distributions, and describes available products.
More discussion of worksite sales, including a comparison of worksite sales distributions vs. non-worksite sales distributions will be in Broker World magazine’s August issue.
Unless otherwise indicated, references are solely to U.S. stand-alone LTCI sales, excluding exercised future purchase options (FPOs) or other changes to existing coverage. “Stand-alone” refers to LTCI policies that do not include death benefits (other than returning premiums upon death or waiving a surviving spouse’s premiums) or annuity or disability income benefits. Where referenced, “combo” products provide LTCI combined with life insurance or annuity coverage. “Linked benefit” policies are combo policies which can allow more than the death benefit or annuity account value to be used as LTCI.
All references to sales in terms of “premium” refer to “annualized” premium (1 x annual; 2 x semi-annual; 4 x quarterly; 12 x monthly), even if only one monthly premium was received before year-end. All references to “Washington” or “WA” refer to the state of Washington. “WCF” refers to the “WA Cares Fund,” explained in the Market Perspective section.
Highlights from this year’s survey
Participants Seven insurers (Bankers Life, Knights of Columbus, Mutual of Omaha, National Guardian Life, New York Life, Northwestern, and Thrivent) contributed broadly to the stand-alone sales distributions reported herein. Total industry sales include, for seven additional companies, either reported sales (without sales distribution data) or the authors’ estimates of sales.
Our statistical distributions reflect non-worksite LTCI sales well. However, our worksite sales distributions do not reflect low-price worksite programs. Carriers that provided 2021 distributions had an average worksite annual premium of $2,077, whereas the insurers that provided sales, but not distributions, had an average worksite premium of $674 annually. Auto-Owners, MassMutual and Transamerica all stopped selling stand-alone LTCI in 2021. The following ten insurers contributed to our combination sales data: AFLAC, John Hancock, Mass Mutual, New York Life, Nationwide, Northwestern Mutual (Northwestern), OneAmerica, Pacific Life, Securian, and Trustmark.
Sales Summary
We estimate total stand-alone LTCI annualized new premium sales of nearly $200 million1 in 2021 (including exercised FPOs, except FPOs for insurers no longer selling LTCI), almost 1/3 more than our 2020 estimate of $150 million.1 However, premium outside the state of Washington decreased 6.0 percent, based on the insurers that reported sales.
We estimate that 140,000 to 150,000 people purchased stand-alone LTCI coverage in 2021, more than triple the 2020 numbers. Outside of WA, the number of new insureds dropped 9.4 percent based on the insurers that reported sales.
Worksite sales soared. We estimate that new annualized premium from worksite sales tripled in 2021, while non-work-site premium increased by 6.0 percent. We estimate that there were about 9.3 times as many worksite sales in 2021 compared to 2020, while non-worksite sales increased 47 percent.
Insurers providing sales information to this survey reported approximately $155 million1 in 2021 annualized new premium sales (including exercised FPOs) and 75,162 new policies, 25 percent more premium and 2.18 times more policies than the same insurers sold in 2020. The balance of the new premium sales in the previous bullets reflects our estimates for insurers not providing sales information.
For the first time ever in our survey, more males purchased LTCI than females, which appears to have been driven by the WCF exemption.
As noted in the Market Perspective section, the number of policies sold combining life insurance with LTCI or Chronic Illness benefits soared. Premium increased significantly as well, but because WA sales had a young average age and a small average face amount, the second half of 2021 average size combination life premium was only about one-quarter of the corresponding 2020 average premium.
Among carriers currently issuing LTCI, Northwestern had a large lead in annualized new premium including FPO elections, selling slightly more than the #2 and #3 insurers combined (Mutual of Omaha and New York Life, respectively). However, similar to last year’s survey, Mutual of Omaha led Northwestern in annualized premium from new policies sold.
Reflecting nine companies’ data, the inforce number of cases increased for the first time since 2014, by 3.6 percent, because of WA sales. Annualized premium rose 6.7 percent. Inforce premium rises due to sales, price increases, and benefit increases (including FPOs), and falls from lapses, reductions in coverage, deaths, and shifts to paid-up status.
Collectively, seven participants paid about one percent less in claims in 2021 than in 2020, despite having about 15 percent more claimants.
Overall, the stand-alone LTCI industry incurred $12.9 billion in claims in 2020 (essentially the same as 2019) based on companies’ statutory annual filings, raising total incurred claims from 1991 through 2020 to $167.3 billion. (Note: 2020 was the most recent year available from statutory filings when this article was written.) Most of these claims were incurred by insurers that no longer sell LTCI.
About the Survey This article is arranged in the following sections:
Highlights provides a high-level view of results.
Market Perspective provides insights into the LTCI market.
Claims presents industry-level claims data.
Sales Statistical Analysis presents industry-level sales distributions reflecting data from 8 insurers.
Partnership Programs discusses the impact of the state partnerships for LTCI.
Available only online:
Product Exhibit shows, for 6 insurers: financial ratings, LTCI sales and inforce business, and product details.
Product Exhibit Details, a row-by-row definition of the product exhibit entries, with some commentary.
Premium Exhibit shows lifetime annual premiums for each insurer’s most common underwriting class, for issue ages 40, 50, 60, and 70 for single females, single males, and female/male couples (assuming both buy at the same age), based on $100 per day (or closest equivalent weekly or monthly) benefit, 90-day facility and most common home care elimination period, three-year and five-year benefit periods or $100,000 and $200,000 maximum lifetime buckets, with and without Shared Care and with flat benefits or automatic three or five percent annual compound benefit increases for life. Worksite premiums do not reflect any worksite-specific discount, though some carriers offer this.
Premium Adjustments (from our Premium Exhibit prices) by underwriting class for each participant.
Distribution by underwritingclass for each participant. Depending upon the product shown for an insurer in the Product Exhibit, we sometimes adjust that insurer’s underwriting distribution to provide readers a better expectation of likely results if they submit an application in the coming year and to line up with the prices we display. For example, if the Product Exhibit shows only a new product which has only one underwriting class (hence one price), but the insurer’s data partly or solely reflect an older product with three underwriting classifications, we might choose to show “100 percent” in their best (only) underwriting class.
State-by-state results show the percentage of sales by state, average premium by state and percentage of policies qualifying for Partnership by state.
MARKET PERSPECTIVE (more detail in subsequent parts of the article) Washington State’s “Washington Cares Fund” (WCF) stimulated a tremendous demand for private LTCI from individuals and businesses within WA. WCF imposes a 0.58 percent payroll tax to fund a $36,500 lifetime pool (intended to inflate according to the Washington consumer price index) for care received in WA as defined in the Revised Code of Washington 50B.04. However, people who purchased qualifying private stand-alone or combination LTCI by November 1, 2021 could file to be exempt from the tax. Partly because the tax applies to all earned income, LTCI sales in Washington soared to unprecedented levels. Insurers quickly became backlogged with applications and were concerned about early lapses as the law provided a permanent WCF exemption based on only a one-time attestation. Insurers reduced design flexibility, and then discontinued sales in WA before the November 1 deadline. Nonetheless, as shown in the WA table, WA accounted for 60 percent of reported stand-alone LTCI policies sold and 60 percent of combination life/LTCI on-going premium (i.e., excluding single premium) policies sold in 2021 after having accounted for 3.0 percent of stand-alone LTCI sales in 2020 and only 1.6 percent of combination life/LTCI sales in 2020. Including estimated sales, we think more than 70 percent of the stand-alone policies sold in 2021 were sold in WA. (Note: WA had received 470,000 applications for exemption as of March 2022.)
As shown in the WA Table, insurers reported 44 times as many stand-alone policies sold in WA in 2021 as in 2020 but only 12 times as much new annualized premium. The WA table also shows the highest and lowest insurer results for the statistics in this and following bullets. Outside WA, insurers reported 6.0 percent less premium and 9.4 percent fewer policies in 2021 than in 2020. As mentioned earlier, our participants sold 2.18 times as many policies but only 25 percent more premium in 2021 than the same insurers sold in 2020. Total industry growth was higher than participant growth because the worksite market is substantially under-represented in the sales reported in the survey.
As shown in the WA Table, insurers reported 92 times as many combination on-going premium policies sold in WA in 2021 as in 2020 but only 9.8 times as much new annualized premium. Outside WA, insurers reported 0.6 percent more policies and 18 percent more premium in 2021 than in 2020. As a result, our national data for such combination policies shows 2.5 times as many new policies and 1.4 times as much annualized new premium. We collected single premium information as well, but we are reporting only the on-going premium results as WA sales had a much smaller impact in the single premium market.
As reflected in the table, reported data suggested that combination policies grew much faster in WA than stand-alone LTCI. However, including our estimates, the stand-alone sales grew a little more than the reported combination sales, and full-market combination sales may have grown less than 92 times as our data may reflect a higher percentage of the worksite combination market than of the individual combination market.
The bottom row in the combination portion of the table reflects a statistical “anomaly.” Combining data for the 10 combination insurers, the 2021 average premium was 10.6 percent of the 2020 average premium. However, the insurer with the minimum ratio had a 2021 average premium equal to 26.1 percent of its 2020 average premium. That is, the overall ratio was 10.6 percent but no insurer had a ratio less than 26.1 percent. That happened because the distribution of the business among insurers shifted significantly between 2020 and 2021. The company with the 88.5 percent ratio had low average premiums in both 2020 and 2021 and had a much bigger market share in 2021, driving down the average premium. If that company is removed from the data, the combined ratio of 2021 average size to 2020 average size would increase from 10.6 to 22.4 percent which would fall within the range of the minimum (26.1 percent) and the revised maximum (48.5 percent).
LIMRA’s U.S. Life Combination Products Sale Survey, 2020 (above we cited 2021 results) saw seven percent fewer policies and 23 percent less annualized new premium combined across whole life, universal life, variable universal life and term, with variable life performing the best (four percent more policies than in 2019 but two percent less new premium). The stand-alone LTCI industry performed better during that time period, as we estimated last year, with 13 percent less premium than in 2019.
However, LIMRA reports that the combination market rebounded in the first six months of 2021, enjoying 10 percent growth in policies and nine percent growth in premium, before significant increases driven largely by the WCF exemption. Based on 17 insurers’ contributions, LIMRA reports the following quarterly nationwide gains in 2021 over 2020. Note that a growth of 3,813 percent means that 39.13 times as many policies were sold. It is hard to compare LIMRA data to our survey data. LIMRA had more contributors than we did and a different representation of the individual market vs. worksite. We reported year-over-year results compared to LIMRA’s quarterly results below. Our data seems to show more growth but lower average premium, probably due to different data contributors and our inclusion of more worksite business in the estimates.
WA sales distorted the characteristics of sales significantly, as will be explained throughout this report. Given the observed sales in WA, it appears likely consumers generally sought the least expensive way to opt out of WCF.
The national placement rate increased from 57.8 percent in 2020 to 61.7 percent in 2021 (as shown in Table 24), driven by WA sales. WA had a 72.7 percent placement rate, which appears to be influenced by healthy and young applicants. Outside WA, the placement rate was 54.1 percent. Only 13.3 percent of WA business was declined (27.4 percent elsewhere) and declines were lower in WA for all age bands. Only 14.1 percent of WA business was incomplete, suspended, not taken out or returned during the free look period (18.5 percent elsewhere). Our surveys have never found placement rates parallel to 2021 WA experience. (Note: One survey participant sold a short-term care policy that they stated qualified for WCF exemption. Had we included it in this paragraph’s statistics, the WA placement ratio would have been even higher)
Higher placement ratios are critical to encourage more financial advisors to mention LTCI to clients. The following opportunities can improve placement rates.
E-applications speed submission and reduce processing time, thus generally increasing placement.
Health pre-qualification effectively and efficiently decreases decline rates.
Education of distributors, such as drill-down questions in on-line underwriting guides, tends to improves placement.
Requiring cash with the application (CWA) led to about five percent more of the apps being placed according to our 2019 survey.
Improved messaging regarding the value of LTCI and of buying now (rather than in the future) typically improves the placement rate by attracting younger and healthier applicants.
Future private LTCI sales in WA will be watched closely to determine the impact of WCF. For example:
Will WCF cause consumers to become more attentive to their potential LTC needs?
Will consumers feel a need to supplement WCF coverage? If so, what products and designs will consumers favor to supplement WCF?
Will WCF messaging promote private LTCI purchases?
How will explaining WCF and its differences from private LTCI (such as different claim triggers, lack of portability outside WA, and/or lack of Partnership qualification) impact the sales process and attitudes regarding selling and buying LTCI?
Will the insurance industry develop new products to fit a market with WCF coverage?
Will the rush of 2021 private LTCI sales dry up future demand for private LTCI in WA?
Will future legislation modify WCF? If so, how will that impact private LTCI sales?
Will consumer, insurance agent, and/or insurer attitudes be affected by the possible perception that WCF benefits will be made more generous in the future?
Other states are considering state-run LTCI programs. For example, California has completed an initial feasibility study and established a task force to explore the possibility of a state LTCI program.
Will insurers be interested in complementing state programs if those programs vary by jurisdiction?
Will brokers consider such complexity worth their effort?
Will employers and employee benefit advisors consider LTCI programs if they must vary by employee resident state?
What will happen to individuals who move from one state to another?
Will inconsistencies increase pressure for a uniform national program?
Will consumers, employers, brokers and insurers sit on the sidelines in what they might view as a turbulent short-term market?
How might reactions parallel or contrast with reactions to the original Robert Woods Johnson Partnerships and the partnership provisions of the Deficit Reduction Act of 2005?
The COVID-19 (COVID) pandemic may have driven increased consumer interest in life insurance. LIMRA reported a five percent increase in life insurance policies sold in 2021 over 2020 with a 20 percent increase in annualized premium and projects a 10 percent premium increase for whole life policies in 2022, with an additional increase in 2023.2 Thirty percent of survey responders say they are more likely to buy life insurance as a result of the pandemic2.
Above, we reported much larger increases because we focused on LTC-related policies, whereas these results include life insurance policies that lack LTC-related features.
Last year, we published (in a separate article in the June issue of Broker World) our survey participants’ reaction to the pandemic. This year, we asked for updated responses.
Insurers still do not anticipate any change in LTCI pricing due to the pandemic. It remains to be seen whether having had COVID will impact the future incidence, length, or severity of LTCI claims.
Insurers also do not anticipate permanent changes to procedures due to the COVID pandemic. Some insurers temporarily liberalized claims adjudication (e.g., waiving face-to-face assessments, broadening alternative plan of care) and underwriting (e.g., waiving face-to-face assessments, less insistence on current medical records) but anticipate restoration of previous protocols.
Having had COVID without being hospitalized generally seems to require a 30-to-60 day wait after full recovery before an application will be considered. With hospitalization, a 180-day wait is typically imposed from the date of recovery. Having been in contact with someone who had COVID or having travelled abroad is generally a non-issue, although one insurer mentioned a 14-day wait for contact (without having to supply a new application) and one insurer mentioned a 30-day wait for having traveled abroad.
The FPO (future purchase option, a guaranteed, or a non-guaranteed board-approved, option, under specified conditions, to purchase additional coverage without demonstrating good health) election rate dipped from 81.8 to 78.2 percent in 2021. As both the additional coverage and unit price increase for FPOs as policies age, FPOs become increasingly expensive, even more so with inforce price increases. The high election rate may reflect the importance of LTCI to policyholders and the effectiveness of annual (as opposed to triennial) negative-election FPOs. Negative-election FPOs activate automatically unless the client rejects them. Positive-election FPOs activate only if the client initiates a timely request. Considering such FPOs and other increased coverage provisions, we project a maximum benefit at age 80 of $292/day for an average 51-year-old purchaser in 2021, which is equivalent to an average 2.7 percent compounded benefit increase between 2021 and 2050. In 2020, the average 58-year-old purchaser anticipated an age 80 benefit (in 2042) of $305. So, the average 2021 purchaser will have four percent less coverage, despite facing eight more years of inflation in the cost of care. WA sales’ lower initial monthly maximum benefit and less robust compounding contributed to this reduction in estimated coverage. This is the lowest effective rate of compounding that we’ve seen in the survey, yet inflation appears to be an increasing threat now. As noted in the initial monthly maximum and benefit increase feature discussions below, 2021 WA sales might be more exposed to voluntary reductions, which could drop future coverage from 2021 sales even lower. Purchasers may be disappointed if the purchasing power of their LTCI policies deteriorates over time.
Current premiums are much more stable than past premiums, partly because today’s premiums reflect much more conservative assumptions based on far more credible data3 and lower assumed investment yields. Three participants have never increased premiums on policies issued under “rate stabilization” laws, one of whom has had no increases on policies issued since 2003. Four other participating insurance companies have not raised rates on policies issued since 2015 (going back to 2013 for a couple of them). A financial advisor who is not aware of the price stability of new policies may be reluctant to encourage clients to consider LTCI.
Stand-alone LTCI without a return of premium feature can be sold for a lower premium than a linked-benefit product that adds a death benefit. However, that price advantage of stand-alone LTCI has reduced for partnered individuals. Not long ago, partnered people buying alone typically got a 15 percent discount compared to the single-person price of stand-alone LTCI, which was a bigger percentage discount than the typical linked-benefit product savings for partnered individuals. Now, partnered people buying alone typically get only a five percent discount with stand-alone LTCI, which is lower than the typical linked-benefit savings. Both-buy couples’ discounts typically provide more of an advantage for stand-alone LTCI as the linked-benefit price saving for married people is often the same whether or not the spouse purchases. However, that advantage has also reduced because both-buy discounts for stand-alone LTCI have dropped.
Linked benefit products tend to be attractive to consumers because if the insured never has a LTC claim, their beneficiary will receive a death benefit and because they often have guaranteed premiums and benefits. As noted above, stand-alone LTCI’s price advantage for couples has reduced. Furthermore, in an increasing interest rate environment, products with the ability to reflect higher non-guaranteed interest rates are likely to have a cost advantage.
However, it is important to remember that typical stand-alone and linked-benefit products provide much more significant LTC protection than combination policies which provide LTCI only through an accelerated death benefit.
Accelerated Death Benefit (ADB) provisions do not increase over time. By the time claim payments are made, stand-alone and linked-benefit policies’ maximum monthly benefit (on policies with benefit increase features) will have risen significantly.
Stand-alone and linked-benefit policies have lower renewal termination rates than policies with ADB. Thus, they are much more likely to pay LTCI benefits.
Because stand-alone policies are usually “use-it-or-lose it,” stand-alone policies might be more likely to be used to pay for care, whereas policies with ADB features might be held for the death benefit. On the other hand, ADB features are more likely to be cash benefits and fully paid.
Four participants offer coverage in all U.S. jurisdictions, but only two participants issued in all 50 states plus the District of Columbia. Insurers are reluctant to sell in jurisdictions which have unfavorable legislation or regulations, restrict rate increases, or are slow to approve new products. Lack of product availability in a jurisdiction can complicate or thwart a worksite case.
Life insurers generally have a retention limit (i.e., how much risk they’ll retain for a particular individual), an issue limit (i.e., their retention limit plus the amount of reinsurance they have arranged) and a participation limit. Even if an application requests coverage below their issue limit, insurers don’t typically issue coverage that causes a client’s total coverage to exceed their participation limit. Insurers are concerned when total coverage exceeds the apparent need for insurance.
A large death claim hits earnings soon after the insurer learns about the death. In contrast, a LTCI claim is often large because it lasts a long time. In the year of death, a typical LTCI claim reserve is established, so there is not a sudden “hit” to earnings. Over time, the claim reserve may turn out to be insufficient, which can result in spreading the impact of the large claim over multiple years. Thus, LTCI carriers may be less concerned about the impact of a single claim on current earnings. However, LTCI carriers have strong reasons to be concerned about over-insurance, especially if clients can profit from being on claim. So, we queried about participation limits this year and got seven responses.
Three insurers lower their LTCI issue limit to offset other inforce or applied-for stand-alone LTCI, considering current coverage not future increases. Two of those insurers adjust for LTCI that is issued as part of a combination product and one of them lowers its issue limit if other coverage including Chronic Illness riders exceeds $50,000/month or $2,000,000/lifetime. The other four respondents have no participation limit.
CLAIMS Independent Third-Party Review (IR) is intended to help assure that LTCI claims are paid appropriately.
Since 2009 (in some jurisdictions), if an insurer concludes that a claimant is not chronically ill as defined in the LTCI policy, the insurer must inform the claimant of his/her right to appeal to IR, which is binding on insurers. As shown in our Product Exhibit, most participants have extended IR beyond statutory requirements, most commonly to policies issued prior to the effective date of IR.
In some states, regulators have not set up the required panel of independent reviewer organizations (IROs), and there has been no consumer pressure for those states to do so, which may suggest that insurers are doing a good job.
Indeed, of seven insurers which provided claims information this year, three have never had a request for IR and a fourth does not seem to track IR.
We are not aware of regulators who track IR results, but Steve LaPierre, President of LTCI Independent Eligibility Review Specialists, LLC (LTCIIERS), the largest IR organization, reports a moderate volume of IRs in 2021, with fewer than three percent of insurer denials being partially or fully reversed. LTCIIERS’ data, which include information from insurers that no longer sell LTCI and insurers that offer IR even in the absence of an implemented state IR requirement, appears to demonstrate that insurers are not inappropriately denying claims. Seven participants reported 2021 claims. As some companies are not able to provide detailed data, some statistics are more robust than others.
Those seven insurers’ combined claim payments were about one percent lower in 2021 than in 2020. However, insurers reported 15 percent more claimants, so the average number of dollars paid per claimant in 2021 dropped about 16 percent from the previous year. This drop could reflect:
A shift from facility claims to less expensive home care claims (or family care), perhaps triggered by the pandemic.
An unusually high number of claim terminations, possibly due to the pandemic.
An unusual distribution of new claims weighted toward the end of the year and/or terminated claims weighted more toward the beginning of the year, either of which would cause fewer claim payments to be made on average in a particular year.
The LTCI industry has paid out benefits to policyholders far greater than indicated in the results of our survey, because many claims are paid by insurers that do not currently sell LTCI or did not submit claims data to us.
LTCI claims paid by insurers no longer selling LTCI may differ significantly from the following statistics as their claimants are more likely to have facility-only coverage, be older, and/or have other different policy or demographic characteristics.
Table 1 shows the total dollar and number of reported individual and multi-life (not group) LTCI claims. It reflects the same carriers for both years. As noted above, total paid claims were down one percent, although the number of claimants rose 15 percent.
The pandemic likely contributed to the lower average 2021 expenditure per claim by reducing the number of facility claims. A reduced payout per claim could also result from new claims being more weighted toward the end of the year or claim terminations being more weighted toward the beginning of the year.
As mentioned above, Table 2 shows that, for insurers reporting claims data, claims shifted away from assisted living facilities (ALFs) and to a lesser degree away from home care, dramatically so on an inception-to-date basis. Different insurers contributing data from one year to another and/or contributing differently makes it harder to identify trends. The Table 2 dollars of claims data include one additional company this year. Another insurer previously assigned all of a claimant’s benefits based on the venue in the claimant’s first month of claim. This year, they reported based on the venue for each claim payment, pushing Table 2 toward nursing homes. “Since inception” means since the insurer first started selling LTCI or as far back as they can report these results (for example, they may have changed claims administration systems and not be able to go all the way back to inception easily).
In the distribution based on number of claims, a person who received care in more than one venue is counted once for each venue, but not double-counted in the total line.
Four carriers reported open individual claims at year-end ranging between 53 percent and 81 percent of the number of claims paid during the year, averaging 70 percent overall.
Table 3 shows average size individual claims since inception: that is, including older claims and reflecting all years of payment. Assisted Living Facility (ALF) claims and Home Care claims showed lower average sizes this year, related to the change in reporting mentioned above. Because 40 percent of claimants since inception have submitted claims from more than one type of venue, the average total claim might be expected to exceed the average claim paid for any particular venue. Individual Assisted Living Facility (ALF) claims stand out as high each year (albeit not as much this year), probably because:
a) ALF claims appear to have a longer duration compared with other venues.
b) Nursing home costs are most likely to exceed the policy daily/monthly maximum, hence nursing home claims are most likely to understate the cost of care.
c) People who maximize the use of their maximum monthly benefits can generally spend as much in an ALF as in a nursing home.
d) Although some surveys report that ALFs cost about half as much as nursing homes on average, ALFs may charge more for a memory unit or for levels of assistance that align more closely with nursing home care.
Several insurers extend ALF coverage to policies which originally did not include ALF coverage, providing policyholders with significant flexibility at the time of claim but contributing to the insurers’ need for rate increases.
The following factors contribute to a large range of average claim by insurer (see Table 3):
Different markets (by affluence; worksite vs. individual; geography; etc.)
Demographic differences (distribution by gender and age)
Distribution by benefit period, benefit increase feature, shared care, and elimination period. For example, one carrier has a higher average home care claim than its average facility claims because home care was a rider and people who added the home care rider were more likely to add compound inflation also.
Distribution by facility-only policies vs. 50 percent home care vs. 100 percent home care vs. home care only.
Different lengths of time in the business.
Differences in the ways insurers report claims.
The following factors cause our average claim sizes to be understated.
For insurers reporting claims this year, 16.0 percent of inception-to-date individual claims are still open. Our data does not include reserve estimates for future payments on open claims.
People who recover, then claim again, are counted as multiple insureds, rather than adding their various claims together.
Besides being understated, average claim data does not reflect the value of LTCI benefits from some purchasers’ perspectives, because the many small claims drive down the average claim. LTCI provides significant financial yield for most people who need care one year or longer. A primary purpose of insurance is to protect against adverse results, so the amount of protection, as well as average claim, is important.
Four insurers provided their current individual (excludes group) monthly LTCI claim exposure, which increased by nine percent in 2021 (note: reflects only initial monthly maximum for one insurer). As shown in Table 4, this figure is 29 times their corresponding monthly LTCI premium income and 37 times their 2021 LTCI monthly paid claims. Seven insurers contributed data regarding their inforce distribution by benefit period. Treating endless (lifetime benefit periods) as a 15-year benefit period, we found that their average inforce benefit period is 7.14 years. Changing the assigned value of the endless benefit period by one year has an impact of approximately 0.27 years on the average inforce benefit period. With annual exposure 29 times annual premium and assuming an average benefit period of 7.14 years, we estimate that total exposure is 206 times annual premium.
Four insurers reported their current average individual maximum monthly maximum benefit for claimants, with results ranging from $5,928 to $7,982.
Nursing home (NH) claims are more likely to use the policy’s maximum daily/monthly benefit than ALF claims because ALF daily/monthly costs are generally lower and because policies sometimes have lower maximums for ALFs. ALF claims correspondingly are more likely to use the policy maximum than are adult day care and home care claims.
SALES STATISTICAL ANALYSIS Bankers Life, Knights of Columbus, Mutual of Omaha, National Guardian, New York Life, Northwestern and Thrivent contributed significant background statistical data, but some were unable to contribute some data.
Sales characteristics vary significantly among insurers based on market differences (individual vs. worksite, affluence, gender distribution, etc.) and this year, with the concentration of LTCI sales in WA. Year-to-year variations in policy feature distributions may reflect industry trends but may also reflect changes in participants, participant practices and designs, participant or worksite market shares, etc. and this year, the WCF. The statistical differences between the worksite and non-worksite sales will be reported in the August issue of Broker World.
Market Share We include purchased increases on existing policies as new premium because new coverage is being issued. Table 5 lists the eight insurers that reported the most 2021 new premium, both including and excluding FPOs. Seven of the eight insurers had increases in annualized premium of 12 percent or more due to WA sales. Northwestern ranks #1 including FPOs and Mutual of Omaha ranks #1 when looking only at new policies, but Northwestern has reduced Mutual of Omaha’s lead. Together, they account for 60 percent of the market, which, when paired with New York Life’s strong growth, resulted in a 74 percent market share for the top three insurers. The premium below includes 100 percent of recurring premiums plus 10 percent of single premiums.
Worksite Market Share As demonstrated by LifeSecure (see Table 5), worksite sales soared in 2021 due to WA sales. Overall, we estimate that worksite annualized premium tripled in 2021, contributing 30 percent of total new annualized premium. Worksite sales were approximately 9.3 times those recorded in 2020, accounting for more than 60 percent of coverages sold.
Worksite sales normally consist of three different markets as outlined below, the first two of which produce a higher percentage of new insureds than of new premiums. Worksite 2021 sales were largely voluntary but had the age and premium characteristics of core/buy-up due to WA sales.
Voluntary group coverage generally is less robust than individual coverage.
Core/Buy-Up programs have particularly young age distributions and modest coverage because a lot of people do not buy-up and are less likely to insure spouses.
Executive carve-out programs generally provide the most robust coverage. One- or two-couple executive carve-out sales may not qualify for a multi-life discount with some insurers, hence may not be labeled as worksite sales in submissions to our survey.
The amount of worksite sales reported and its distribution among the sub-markets significantly impact sales characteristics. Table 6 is indicative of the full market (including our estimates for insurers that did not report sales), but this year’s sales distributions do not reflect the insurers focusing in the group voluntary and core/buy-up markets. More information about worksite sales will appear in the August issue of Broker World magazine.
As we noted last year, the future of the non-executive carve-out LTCI market is unpredictable with Transamerica’s departure. LifeSecure, Mutual of Omaha, and National Guardian may pick up market share; combination worksite products are likely to pick up market share; and/or worksite LTCI-related sales might drop.
Affinity Market Share Affinity groups (non-employers such as associations) produced $7.51 million in new annualized premium based on 2,494 new policies (average premium of $3,011) compared to $7.47 million on 2,762 policies (average premium: $2,706). We do not have WA-specific data for affinity coverage, but the decrease in the number of policies suggests that affinity group sales were not influenced much by the WCF exemption given the sales increases observed for other coverage. The higher average premium reflects price increases for new sales. The percentages in Table 7 reflect only participants’ sales.
Characteristics of Policies Sold Average Premium Per Sale To determine the average premium for new sales, we exclude FPOs. Due to WA sales, our participants’ average new business (NB) premium per insured and per buying unit (a couple comprise a single buying unit) each plunged 25 percent in 2021, as shown in Table 8.
Participants’ combined average premium per insured outside WA was $3,785, a five percent increase over 2020’s $3,646 because some carriers raised prices in late 2020 and early 2021. (These numbers are slightly overstated because they do include FPOs.)
Three participants had average WA premiums ranging from $522 to $762 per year. On the other hand, one insurer had an average premium of more than $2,000 per year.
Average WA premium ranged, by insurer, from 21 to 80 percent of average premium outside WA. The two insurers for whom the ratio exceeded 36 percent both doubled their minimum size and required three percent compound inflation in WA, which kept their WA premium from dropping as much as for other insurers. One insurer also raised their minimum issue age in WA significantly. At least one other insurer took all three steps, yet still had a much lower average premium in WA than outside WA.
The jurisdiction with the lowest average new premium for participants in 2021 (including FPOs and counting 100 percent of single premiums) was Washington ($1,089), followed by Puerto Rico ($1,349), and Idaho ($2,137). Indiana and Oregon followed with a more typical $2,912 annual premium. The jurisdiction with the highest average premium was Maine ($5,722), followed by Connecticut ($5,174), New Hampshire ($5,039) and Massachusetts ($5,009).
If we include data from, and estimates for, non-participants, the average premium per insured was $2,557 in the non-worksite market, $661 in the worksite market, and $1,371 overall.
Data for 2017 and earlier years included FPOs in these calculations, overstating the average premium per new insured and buying unit.
Issue Age Table 9 shows that WA sales dropped our participants’ average age from 57.7 to 50.6, as 31.1 percent of buyers were below age 45 compared to 7.2 percent in 2020.
The shift to younger ages seems understated because some major worksite carriers did not provide age distribution. Some insurers raised their minimum issue age in WA to 40. That shifted young age business to other insurers and to combination products.
A special column in this table shows the percentage of participants’ placed policies that came from WA, based on age. Not surprisingly, 88.9 percent of the policies for people ages 18-29 came from WA, dropping to 87.8 percent for ages 30-39 and 76.3 percent for ages 40-49. At higher ages, the percentage in WA was much lower, but in each age group it exceeded WA’s 2020 three percent market share.
We estimate that our participants’ average issue age in WA was about 15 years lower than outside WA.
The age distributions for 2016 and earlier had more worksite participants than recent years. Note: one survey participant has a minimum issue age of 40, one will not issue below 30, and one will not issue below 25.
Benefit Period Table 10 summarizes the distribution of sales by benefit period. The average benefit period for limited benefit period policies dropped more than half a year from 3.75 to 3.23. The reduction in length of coverage is even larger; WA sales were less likely to include Shared Care because there were a lot of single and one-of-a-couple sales and because couples trying to minimize cost were less likely to buy Shared Care. Two-year benefit periods accounted for 21.2 percent of the sales, despite not reflecting the major worksite carriers.
Monthly Benefit A change in distribution by carrier led to the reduction in policies sold with monthly determination (Table 11). With monthly determination, low-expense days leave more benefits to cover high-expense days. One insurer offers only daily determination; one insurer offers a choice; and the other insurers automatically have monthly (or weekly) determination. WA sales included a significant number of small policies, causing the average initial maximum monthly benefit to drop to $4,045 (as shown in Table 12), the lowest in the history of our survey despite increasing costs for care. Two insurers accounted for 87.4 percent of the sales that had an initial monthly maximum less than $3,000.
Benefit Increase Features Table 13 summarizes the distribution of sales by benefit increase feature. WCF permitted policies to qualify for exemption even if there were no benefit increases. This contributed to a rise in the percentage of policies nationwide with no benefit increases, from 14.6 to 24.3 percent. Also, the percentage of FPO sales increased from 34.6 to 41.7 percent, presumably because FPOs do not require first-year premium outlay. Future FPO election rates might drop if a meaningful percentage of these buyers have no intention of exercising such options.
“Indexed Level Premium” policies are priced to have a level premium, but the benefit increase is tied to an index such as the consumer price index (CPI).
As shown in Table 14, we project the age 80 maximum daily benefit by increasing the average initial daily benefit from the average issue age to age 80, according to the distribution of benefit increase features, using current future purchase option (FPO) election rates and a five percent per year offer for fixed FPOs. The maximum benefit at age 80 (in 2050) for our 2021 average 51-year-old purchaser projects to $292/day (equivalent to 2.7 percent compounding). Had our average buyer bought an average 2020 policy a year ago at age 50, her/his age 80 benefit would be $394/day. The lower initial maximums and reduced benefit increases driven by WA sales caused this drop in coverage. It is even more striking considering that the 2021 buyers are less likely to exercise FPO options and more likely to reduce the monthly maximum or drop the benefit increase feature and that inflation is a growing concern. Pandemic protocols are likely to increase facility costs and there are a variety of inflationary pressures which apply to LTC staff salaries at all types of venue. Most policyholders seem likely to experience eroding purchasing power over time if cost of care trends exceed three percent.
FPOs are important to insureds in order to maintain purchasing power, and 78.2 percent of our participants’ 2021 FPOs were exercised. The high election rate is noteworthy, considering that the cost increases each year due to larger coverage increases each year, increasing unit prices due to age, and additional price increases due to rate increases.
One insurer had an election rate of 88 percent, two insurers had 67 to 68 percent, one insurer had 47 percent, and two insurers had 25 to 29 percent. It seems clear that higher election rates occur if FPOs are more frequent (i.e., every year vs. every three years) and are “negative-election” (i.e., activate automatically unless the client rejects them) as opposed to “positive-election” (i.e., which activate only if the client makes a request). At least some blocks of business demonstrate that policyholders will exercise FPOs if they must do so to continue to receive future offers.
FPOs can also be important to insurers. Two insurers got a large percentage of their new premium (42 percent for one; 51 percent for the other) from FPO elections.
Elimination Period Table 16 summarizes the distribution of sales by facility elimination period (EP). The percentage of people buying 84-100day EP dropped arithmetically by 2.2 percent, nearly evenly divided between people opting for shorter EPs and those opting for longer EPs. Five insurers saw between 2.75 and six percent of their new buyers opt for roughly six-month EPs and two of those insurers saw between eight and 11 percent of their new buyers opt for one-year EPs. One insurer mentioned that 20 percent of WA purchasers selected a one-year EP.
Table 17 shows the percentage of participant policies with zero-day home care elimination period (but a longer facility elimination period). For insurers offering an additional-cost zero-day home care EP option, the purchase rate is sensitive to the cost. Table 17 shows a shift away from the zero-day home care EP option due to WA sales, as individuals generally sought out lower cost coverage to qualify for the WCF exemption.
Table 17 also shows the percentage of participant policies with a calendar-day EP. It is important to understand that most calendar-day EP provisions do not start counting until a paid-service day has occurred. A significant part of the drop in calendar-day EP is a change in distribution between carriers.
Sales to Couples and Gender Distribution Since inception, the LTCI industry has struggled to attract the attention of male consumers. As shown in Table 18, which summarizes the distribution of sales by gender and single/couple status, a majority of 2021 purchasers (51.4 percent) were male, largely influenced by WA sales. Among single purchasers, the male percentage increased from 34.4 to 44.5 percent.
WA sales also spurred an increase in the percentage of one-of-a-couple sales, from 23.9 to 27.5 percent in 2021. The percentage of one-of-a-couple sales to men increased from 44.3 to 58.7 percent in 2021.
The percentage of accepted applicants who purchase coverage when their partners are declined dropped slightly. It varies significantly by insurer based on their couples pricing and their distribution system. Only two insurers (both large and active in WA) were able to report this data. Their results were almost identical (80.3 and 80.9 percent, respectively) for the percentage of accepted applicants who purchased coverage after a partner’s denial.
Shared Care and Other Couples’ Features Table 19 summarizes sales of Shared Care and other couples features.
Shared Care allows one spouse/partner to use the other’s available benefits if their own coverage has been depleted or offers a third independent pool the couple can share.
Survivorship waives a survivor’s premium after the first death if specified conditions are met.
Joint waiver of premium (WP) waives both insureds’ premiums if either insured qualifies for benefits.
Changes in distribution by carrier can greatly impact year-to-year comparisons (Table 19), as some insurers embed survivorship or joint waiver automatically (sometimes only for particular circumstances. For example, joint waiver of premium might be automatic if Shared Care is purchased) while others offer it for an extra premium, offer it only under some circumstances, or do not offer the feature.
In the top half of Table 19, percentages are based on the number of policies sold to couples who both buy (only limited benefit, for Shared Care). The bottom half of Table 19 shows the percentage of policies that results from dividing by sales of insurers that offer the outlined feature.
Because WA buyers appeared to minimize their cost (as observed by lower reported average premiums), these features were less popular in 2021. Of couples who both bought limited benefit period, only 22.6 percent added Shared Care, compared to previous percentages of 33.4 to 43.0 percent.
For insurers reporting Shared Care sales, the percentage of both-buying couples who opted for Shared Care varied from four percent to 64 percent. The corresponding percentage of couples with Joint WP varied from four to 100 percent and for Survivorship ranged from 2.7 to 9.0 percent.
Tables 20 and 21 provide additional breakdown on the characteristics of Shared Care sales. Table 20 shows that couples buying four-year benefit period policies became the most likely to add Shared Care, presumably because people seeking a minimal premium might buy a 3-year benefit period but without Shared Care. Each benefit period can have anywhere from zero to 100 percent Shared Care among its couples.
Table 21 looks only at Shared Care policies and reports their distribution across benefit period, so the percentages must total 100 percent. As many policies have three-year benefit period, more than half the Shared Care policies had a three-year benefit period (Table 21) even though a higher percentage of four-year benefit period policies had Shared Care (Table 20).
Table 19 shows a low percentage of policies having Shared Care, partly because its denominator includes all policies, even those sold to single people or one of a couple. Table 20 denominators are couples who both bought coverage with the particular benefit period. Table 21’s denominator is the number of Shared Care policies.
Shared Care is generally more concentrated in two- to four-year benefit periods than are all sales. Couples are more likely to buy short benefit periods because couples plan to help provide care to each other and Shared Care makes shorter benefit periods more acceptable. Single buyers are more likely to be female and opt for a longer benefit period.
Existence and Type of Home Care Coverage Three participants reported sales of facility-only policies, which accounted for 0.4 percent of total sales. One insurer was responsible for 85 percent of such sales. Nearly ninety-six percent of the comprehensive policies included home care benefits equal to the facility benefit. The other sales all had a home care benefit of at least 50 percent of the nursing home benefit. The last home-care-only sale in our survey was sold in 2018.
Other Characteristics As shown in Table 22, partial cash alternative features (which allowed claimants, in lieu of any other benefit that month, to use between 10 and 40 percent of their benefits for whatever purpose they wish) were included in fewer of our participants’ policies due to a change in market share among participants.
Return of premium (ROP) features were included in 14.2 percent of policies, a surprising increase due to a market share change. ROP returns some or all premiums (usually reduced by paid LTCI benefits) when a policyholder dies. Ninety (90 percent) of ROP features were embedded automatically in the product. Embedded features are designed to raise premiums minimally, typically decreasing the ROP benefit to $0 by age 75.
Due to market share change, 22 percent of policies with limited benefit periods included a restoration of benefits (ROB) provision, which typically restores used benefits when the insured has not needed services for at least six months. Approximately 90 percent of ROB features were automatically embedded.
Insurers must offer shortened benefit period (SBP) coverage, which makes limited future LTCI benefits available to people who stop paying premiums after three or more years. The insurers able to report SBP sales, sold SBP to 4.0 percent of buyers, a small increase due to market share change.
Only one insurer issued non-tax-qualified (NTQ) policies, which accounted for 0.1 percent of total industry sales.
“Captive” (dedicated to one insurer) agents produced 68.6 percent of the sales, their highest percentage since we have been reporting this data. Brokers produced 31.4 percent of the sales. Some direct-to-consumer sales were made but not by our participants. At one time, “captive” agents who sold LTCI tended to specialize in LTCI. Now many are agents of mutual companies. Sales distribution by jurisdiction is posted on the Broker World website.
Limited Pay and Paid-Up Policies In 2021, two insurers in the survey sold policies that become paid-up in 10 years or less, accounting for 1.2 percent of sales.
Because today’s premiums are more stable compared to policies sold years ago, premium increases are less likely. One of the key reasons for buying 10-year-pay (avoidance of rate increases after the 10th year) is greatly reduced, while the cost of 10-year-pay has increased, making it less attractive for consumers than in the past. Nonetheless, limited-pay and single-pay policies are attractive to minimize post-retirement outflow and to accommodate §1035 exchanges.
Seven participants reported that 2.9 percent of their inforce policies are paid-up, a lower percentage than last year because an additional insurer participated.
PARTNERSHIP PROGRAM BACKGROUND When someone applies to Medicaid for long-term care services, most states with Partnership programs disregard assets up to the amount of benefits received from a Partnership-qualified policy (some Indiana and New York policies disregard all assets). Except for California, states with Partnership programs grant reciprocity to Partnership policies issued in other jurisdictions. Partnership programs are approved in 44 jurisdictions, all but AK, DC, HI, MA, MS, UT, and VT, but MA has a similar program (MassHealth).
Four states (CA, CT, IN and NY) blazed the trail for Partnership programs in the early 1990s. Other states were allowed to adopt Partnership regulations (which were simplified and more standardized) as a result of the Deficit Reduction Act of 2005 (DRA).
Approximately 60 percent of Partnership states now allow one percent compounding to qualify for Partnership, which can help low-budget buyers qualify for Partnership and also enables worksite core programs to be Partnership-qualified. A higher percentage of policies would qualify for Partnership in the future if insurers and advisors leverage these opportunities. However, currently only three insurers offer one percent compounding.
Partnership programs could be more successful if:
Advisors offer small maximum monthly benefits more frequently to middle-income individuals. For example, a $1,500 initial maximum monthly benefit covers about four hours of home care every two days and, with compound benefit increases, may maintain buying power. Many middle-income individuals would like LTCI to help them stay at home while not “burning out” family caregivers and could be motivated further by Partnership asset disregard. (This approach does not work in CA, CT, IN and NY because of their high Partnership minimum daily benefit requirements.)
Middle-income prospects were better educated about the importance of benefit increases to maintain LTCI purchasing power and qualify for Partnership asset disregard.
The four original Partnership states migrate to DRA rules.
More jurisdictions adopt Partnership programs.
Programs that privately finance direct mail educational LTCI content from public agencies were adopted more broadly.
Financial advisors were to press reluctant insurers to certify their products and offer one percent compounding.
More financial advisors were certified. Some people argue that certification requirements should be loosened. At a minimum, the renewal certification process could be improved.
Linked benefit products became Partnership-qualified.
PARTNERSHIP PROGRAM SALES Participants reported Partnership sales in 41 states, all authorized states except CA, CT and NY. One carrier sold a Partnership policy in each of the 41 states. One has chosen not to certify Partnership conformance.
Insurance brokers do not have access to Partnership policies in CA, CT and NY and from only one insurer in IN. However, consumers may be able to purchase Partnership-qualified coverage from another entity.
As only 23.4 percent of participants’ WA policies qualified for the Partnership, participants’ Partnership-qualified policies in DRA states dropped from 55 to 34.6 percent. Other states saw some slippage in Partnership sales, presumably because benefit increase provisions are less popular. Minnesota (76.6 percent, down from 81.4 percent in 2020) leads each year. Wisconsin was second (67.5 percent) and six states had between 60 and 64 percent. Indiana (3.7 percent) and New Mexico (8.3 percent) were the only states with participant Partnership sales in which fewer than 20 percent qualified.
UNDERWRITING DATA Case Disposition Seven insurers contributed application case disposition data to the survey (Table 24). In 2021, 61.4 percent of applications were placed due to WA sales. In 2020, 57.8 percent were placed. Two insurers placed 71 to 78 percent of their applications and five insurers placed 45 to 60 percent. One insurer had a lower placement rate than in 2020.
Declines were down in 2021, to 24.6 percent from 29.0 percent in 2020. Decline rates varied by insurer, ranging from 12.0 to 35.1 percent (based on decisions).
The percentage of suspended and withdrawn policies dropped but free look and not-taken (NTO) increased about as much. Our participants experienced between 6.6 and 15.6 percent terminated cases for such reasons. In WA, suspended, withdrawn, and NTOs more often resulted from the applicant finding a less expensive solution, sometimes through their employer. Thus, from a consumer standpoint, the placement rate was likely higher than stated above.
Seven insurers contributed to our WA placement data. They had a 72.7 percent placement rate in WA with a 54.1 percent placement rate outside WA. Their decline rate was 13.3 percent in WA vs. 27.4 percent elsewhere. Their combined withdrawn/suspended/NTO rate was 14.1 percent in WA vs. approximately 18.5 percent outside WA.
The WA placement rate was higher primarily for applicants under age 50. Factors such as age distribution, distribution system, market, underwriting requirements, and underwriting standards affect these results.
Table 25 shows that the placement rate increased at all ages. The improvements under age 50 resulted from WA sales. One insurer sold a product with a short benefit period that qualifies as LTCI in WA. Had we included that product, placement rates would have been higher at older bands represented in the table.
This data is a subset of the placement data in Table 24.
Low placement rates increase insurers’ cost per placed policy. More importantly, low placement rates discourage advisors from discussing LTCI with clients. In addition to not wanting to waste time and effort, advisors may fear that declined clients will be dissatisfied. In the Market Perspective section, we listed ways to improve placement rates. This is a critical issue for the industry. If readers have suggestions, they are invited to contact the authors.
Underwriting Tools Four insurers contributed data to Table 26, which divides the number of uses of each underwriting tool by the number of applications processed. For example, the count of instances where medical records were requested was 93 percent of the number of applications. That does not mean that 93 percent of the applications involved medical records, because some applications resulted in more than one set of medical records being requested.
Year-to-year changes in distribution of sales among insurers significantly impact results. Lower maximum ages result in fewer face-to-face exams. Insurers might underreport the use of an underwriting tool because they may lack a good source for that statistic. For example, an insurer might not be able to split phone interviews by whether or not they include cognitive testing.
Medical, phone interviews, and prescription profiles all increased, signs of more thorough underwriting. The 2021 changes all reflect the impact of WA sales, with fewer apps needing face-to-face exams or phone interviews with a cognitive test due to the mix of younger applicants.
Underwriting Time Table 27 shows an average processing time, from receipt of application to mailing the policy, of 60 days. The increase in sales due to the WCF exemption swamped insurers, adding significantly to processing time. The issue appeared to be significantly more severe for some insurers marketing combination products.
Rating Classification Table 28 shows that almost two-thirds of 2021 policies were issued in the most favorable rating classification due to WA sales.
Table 28 shows the percentage of decisions which were either declined or placed in the 3rd or less-attractive classification is reducing. We conclude that the industry made more favorable decisions rather than declining applicants in lieu of giving them a substandard rating.
Tables 29 and 30 show the 2020 percentages of policies issued in the most favorable category and decline decisions by issue age. Tables 29 and 30 do not exactly match Table 28 because some participants provide all-age rating or decline data. The percentage placed in the most favorable classification increased for all ages, except 18-29.
The overall decline rate reduced because, as explained earlier, WA sales included younger and likely healthier applicants. The lower decline rate was most noticeable under age 50. Above age 60, where increased WA sales had less impact, the decline rate increased (except for a likely statistical fluctuation at ages 75+).
CLOSING We thank insurance company staff for submitting the data and responding to questions promptly. We also thank Sophia Fosdick, Rachelle Jacobs, and Zane Truesdell of Milliman for managing the data expertly.
We reviewed data for reasonableness and insurers reviewed their product exhibit displays. Nonetheless, we cannot assure that all data is accurate.
If you have suggestions for improving this survey (including new entrants in the market), please contact one of the authors.
Footnotes:
Single premium sales are counted at 10 percent for the annualized premium calculations herein.
The 2021 Milliman Long Term Care Insurance Survey, published in the July issue of Broker World magazine, was the 23rd consecutive annual review of long-term care insurance (LTCI) published by Broker World magazine. It analyzed product sales, reporting sales distributions and detailed insurer and product characteristics.
From 2006-2009, Broker World published separate group LTCI surveys, but discontinued those surveys when the availability of group LTCI policies shrank. In 2011, Broker World began this August annual analysis of worksite (“WS”) sales to complement the July overall market analysis.
The WS market consists of individual policies and group certificates (“policies” henceforth) sold with employer support, such as permitting on-site solicitation and/or paying or collecting premiums. If a business owner buys a policy for herself and pays for it through her business, participants likely would not report her policy as a WS policy because it was not part of a WS group. If a business sponsors general LTC/LTCI educational meetings, with employees pursuing any interest in LTCI off-site, sales would not be reported as WS sales.
We limit our analysis to US sales and exclude “combination” products, except where specifically indicated. (Combination products pay meaningful life insurance, annuity, or disability income benefits in addition to LTCI.)
About the Survey Our survey includes WS sales and statistical distributions from National Guardian Life, New York Life, and Northwestern and WS sales data from LifeSecure and Transamerica. We estimated sales from some other insurers and compare WS sales to individual LTCI policies that are not WS policies (NWS) and to total sales (Total).
The July issue included data for the California Public Employees Retirement System (CalPERS) program. CalPERS eligibility is based on California public employment, but the program operates more like an affinity group than a WS group, so it was counted as affinity sales in July and is in the NWS data, not the WS data, in this article. Ten percent of single premiums are included as annualized premiums.
Highlights from This Year’s Survey
We estimate 2020 WS sales of 9,700 policies (approximately 20 percent of total sales) for $19.75 million (nearly 15 percent of total new annualized premium) which is a about a 15 percent decrease in both premium and number of sales from 2019. The premium includes 2020 future purchase options exercised on policies issued in the past.
In 2019, WS sales had rebounded from low 2018 sales. 2020 appeared likely to be another good year until the pandemic struck, hampering sales activities from April through year-end. As different WS markets have different seasonal sales patterns, the pandemic can impact statistical characteristics as well as sales.
We estimate that our WS sales total includes more than 95 percent of the stand-alone WS LTCI market, but our statistical distributions reflect only about 15 percent of WS policies. Our WS statistical distributions can vary significantly from year-to-year because insurers focusing on particular WS markets may be over- or under-represented. The carriers that provided 2020 statistical data had an average WS annual premium of $4,218 whereas the ones that provided only total sales had an average WS premium of $1,665, which indicates that our statistical analysis, like last year, is overly weighted toward executive carve-out programs. While these averages are quite close to the previous year’s numbers ($4,568 and $1,627), they can vary greatly year over year. The corresponding 2018 averages were $2,015 and $1,561. In 2017, the difference was in the other direction ($1,015 vs. $1,441).
MARKET PERSPECTIVE The three segments of the WS market (which may apply to different employee classes in a single case):
In “core” (also known as “core/buy-up”) programs, employers pay for a small amount of coverage for generally a large number of employees. Employees can buy more coverage. “Core” programs generally have low average ages, short benefit periods, low daily maximum benefits and a small percentage of spouses insured.
In “carve-out” programs, employers pay for robust coverage for key executives and usually their spouses. Generally, executives can buy more coverage for themselves or spouses. Compared to “core” programs, a higher percentage of insureds are married, more spouses buy coverage, the age distribution is older and the average premium is higher.
In “voluntary” programs, employers pay nothing toward the cost of coverage. The typical coverage is more robust than “core” programs, but less robust than “carve-out” programs. Voluntary programs tend to be most weighted toward female purchasers.
National Guardian, New York Life, and Northwestern write mostly executive carve-out programs, whereas Genworth, LifeSecure, Mutual of Omaha, and Transamerica have significant voluntary and core buy-up business. Because we received statistical distributions from the former but not the latter, our 2020 and 2019 statistical distributions are more representative of the executive carve-out subset of the market.
Because of tax savings, small executive carve-out plans are weighted toward the end of the year. On the other hand, large voluntary cases were traditionally weighted toward fall enrollments with January 1 effective dates. Large voluntary cases are probably more evenly distributed through the year than in the past, but differences remain.
Carrier Changes: MassMutual ceased sales, hence will have, at most, negligible WS sales in 2021. Transamerica ceased accepting new cases at the end of March 2021 and ceased accepting new apps on June 30. However, Transamerica’s sales might be strong in 2021 because some employers sought WS programs in advance of the November 1 deadline in order for employees to qualify to opt out of the Washington Cares Fund tax, as explained below. In 2020, Genworth temporarily ceased sales, but has since resumed. These developments will impact total industry WS sales and change insurers’ market shares as well as the statistical characteristics of WS sales.
The WCF: The State of Washington created the Washington Cares Fund (WCF) through passage of the LTSS Trust Act. In January 2022, the state will begin collecting 0.58 percent payroll tax on wages to fund a $36,500 lifetime pool of money starting in 2025. The pool of money is intended to inflate thereafter according to the WA consumer price index. Coverage applies for vested individuals receiving care in WA and is not portable out-of-state.
The law allows people to opt out of the program and not pay the tax if they purchase LTCI by 11/1/2021. Therefore, 2021 private LTCI sales could be impacted if some people choose to opt out for reasons such as: Intend to retire outside of Washington; believe they will not obtain enough vesting credits; have high wages; want more robust coverage; want to cover unemployed spouses; or want to benefit from the state Partnership program. We understand some employers either instituted WS programs or educated their employees so they could seek individual coverage if appropriate. Even employers outside WA were stimulated to act if they had WA-based employees.
COVID-19: In 2020, most scheduled enrollments were canceled or delayed, and it was obviously not a good time for employers to consider implementing a new WS program.
Enrollments of newly-eligible employees continued in 2020 for existing programs, being performed in web meetings.
Early 2021 was also not a good time for enrollments, due to COVID-19, focus on “re-opening”, continued high unemployment and volatility in the work force.
Pricing Considerations: Most people interpret Title VII of the 1964 Civil Rights Act to require that employer-involved LTCI programs use unisex pricing if the employer has had at least 15 employees for at least 20 weeks either in the current or previous year. Some states apply similar laws to employers with fewer employees. Thus, for WS sales, insurers must create a separate unisex-priced product. The expense of separate pricing, marketing and administration discourages insurers from serving both the WS and NWS markets.
Moreover, insurers fear anti-selection. Because women have higher expected future claims, unisex pricing saves women money compared to gender-distinct NWS pricing, whereas men pay much more for WS than for NWS policies. The higher the percentage of female buyers in the WS, the more unisex pricing is likely to approach sex-distinct female pricing levels.
The recent evolution of couples’ discounts (discussed in our July article) might impact WS programs directly or indirectly.
Because healthy, young, and less affluent people are less likely to buy LTCI, insurers also fear health anti-selection (less-healthy people buying, while healthier people do not buy). Furthermore, because WS programs rarely offer “preferred health” discounts, healthy heterosexual couples may pay more for WS coverage than for corresponding NWS coverage. Therefore, there are few health concessions in the stand-alone WS market at this time. However, some combination products offer guaranteed issue if participation requirements are satisfied.
In the carve-out market, a more expensive WS product can still produce after-tax savings compared to a cheaper NWS policy, because of tax advantages when employers pay the premium.
In addition to health and gender distribution, insurers are also careful about age and income distributions of WS cases they accept. Insurers are more vulnerable to health- or gender-anti-selection if the group has a lot of young or less affluent employees.
Some insurers have raised their minimum issue age to avoid anti-selection (few people buy below age 40) and to reduce exposure to extremely long claims. Such age restrictions can discourage employers from introducing a program, especially a carve-out program if they have executives or spouses under age 40.
To control risk, most insurers will not accept a voluntary WS program if there are fewer than 100 employees. However, one insurer (which offers no health concessions) will accept voluntary LTCI programs with as few as two to five employees buying (minimum varies by jurisdiction).
Availability of coverage: With increased remote work, more employers have employees stretched across multiple jurisdictions and eligible non-household relatives might live anywhere. But insurers are less likely than in the past to offer LTCI in jurisdictions with difficult laws, regulations or practices. So, it can be difficult to find an insurer which can cover everyone unless LTCI is sold on a group chassis and the employer does not have individuals in extra-territorial states.
One insurer no longer offers WS LTCI to non-household relatives. Reduced availability for such relatives does not have much impact on sales, because only about one percent of WS sales are to non-household relatives. However, it undermines the suggestion that WS LTCI programs might reduce the negative impact of employees being caregivers.
Prior to sex-distinct pricing, an executive carve-out for two partners of a company with more than 15 employees could have been serviced by any LTCI company, but now it is hard to find a carrier that offers unisex pricing under such circumstances. Such executives may buy policies with sex-distinct pricing either because they are unaware of the requirement under Title VII of 1964 Civil Rights Act, they are confident that no female will file a civil rights complaint, or they disagree with the interpretation that such policies should have unisex pricing to avoid the risk of a civil rights complaint, etc.
Some employee benefit brokers are reluctant to embrace LTCI because of declinations, the effort of enrollment, certification requirements, their personal lack of expertise, etc. WS sales gain from LTCI specialists forming relationships with employee benefit brokers.
Positive Factors: Despite the above problems, there are positives for the WS market.
As a result of COVID-19, there is increased awareness of the LTC risk and of personal exposure. In addition, there is increased interest in staying out of nursing homes. More workers may have elders living in their homes and, if they are remote workers, the needs of those elders are more likely to interfere with their productivity.
Potential future tax increases would increase the tax advantages of employer-paid premium.
Voluntary WS LTCI sales lack the tax advantages of employer-paid coverage. Therefore, voluntary programs for young and less-affluent groups may gravitate toward products that include life insurance, which is viewed as a more immediate potential need by young employees with families.
As most jurisdictions now permit policies with one percent compounding to qualify as Partnership policies, the WS should be a great venue to serve people who can benefit from state Partnership programs. Two insurers in the WS market currently offer one percent compounding. As explained in the Partnership section, sales of Partnership policies could likely be increased if more insurers offered one percent compounding and if they lowered the minimum monthly maximum for core/buy-up programs with one percent compounding.
Another potentially positive factor is the increased availability of combination products in the WS market. From the perspective of insurers and advisors selling stand-alone LTCI in this market, competition from combination products might be a negative. Furthermore, such combination products may produce relatively little purchasing power during retirement years because the monthly LTCI benefit is constrained to a portion (typically four percent) of the death benefit and because the benefit does not compound. However, combination products should expand the WS market.
Yet another positive are programs which offer free LTC-related services to employees and their families. Regardless of whether the employee is insured or the relative is insurable, they can access information, advice, services and products that make caregiving more efficient, more effective, safer and less expensive. Enabling employees and their families to have better LTC experiences and to use more (not necessarily 100 percent) commercial care should boost productivity at work.
With all of the above changes, it will be particularly interesting to see how 2021 sales develop.
STATISTICAL ANALYSIS As mentioned earlier, insurers’ sales distributions can vary greatly based on the submarket they serve (for example, in the WS market: core, voluntary or carve-out). Therefore, distributions may vary significantly from year to year due to a change in participating insurers, in distribution within an insurer or in market share among insurers. Policies in the carve-out market are designed similarly to those in the NWS (non-worksite) market. Our sales distributions reflect only about 15 percent of WS policies and certificates issued in 2020 and are mostly representative of the executive carve-out market. For example, one insurer’s average WS case consisted of 5 policies being issued and another averaged 7 policies. One of the 3 insurers sold 61 more policies than it did in 2019, whereas the other two insurers sold about 35 percent fewer policies, which resulted in one insurer comprising 76 percent of the WS sales on which our distributions are based.
Sales and Market Share Table 1 shows historical WS sales for all insurers reporting sales, including some estimates in 2020. As there are several WS markets and some have long lead times, there may be a lag before competitors can fill in after an insurer drops out.
Table 1 also shows the overall average WS premium compared to the average WS premium for the participants who contributed statistical data beyond sales. As shown in the table, until 2017, our WS statistics likely represented the broad WS market well.
Table 2 shows WS sales as a percentage of total LTCI sales. For the most part, this percentage has stayed relatively level in the past five years and much higher than prior to 2016.
As shown in Table 3, two insurers wrote 60 percent or more of their 2020 new premium in the WS, while the other insurers wrote 15 percent or less of their business in that market. The percentage of each insurer’s new premium that comes from WS sales did not change dramatically from 2019 to 2020.
Average Premium Per Buyer Table 4 shows that, in 2020, the NWS average premium per buying unit (a couple comprise a single buying unit) was 42.8 percent higher than the average premium per insured. This dropped to 29.9 percent for WS sales, because more WS buyers are single and because spouses are less likely to buy in the WS. The average premium per new insured (NB Insured) reflects all participants, but the average premium per buying unit is determined solely by the participants who report sales based on marital status. The WS ratio is probably overstated because participants who reported premium by marital status for the WS are not characteristic of the entire market.
Issue Age The balance of the statistical presentations are not representative of the entire WS market as explained above. We report the results we have available, though we urge you to be selective in how you use the data.
Not surprisingly, Table 5 shows the WS market is much more weighted to the younger ages, even with data that is disproportionately weighted to executive carve-out programs. The total industry average age and the NWS average age both rounded to the exact same age as in 2019. The WS average fell a bit.
Table 7 displays the relative age distribution of the workers ages 18+ to purchasers in the WS market and all adults 18-79 to purchasers in the NWS markets. In the WS market, the LTCI industry is particularly successful selling to ages 30-59; ages 40-49 represent 38.4 percent of sales but only 21.2 percent of employees. In the NWS market, the industry is particularly successful with 50-70 year-olds.
Rating Classification Most WS sales are in the “best” underwriting class (see Table 8) because there generally is only one underwriting class. Insurers often do not get enough information in WS to determine whether a “preferred health” discount could be granted and use the additional revenue (from not having a “preferred health” discount) to fund extra cost resulting from gender or health anti-selection. Carve-out programs are more likely to offer a “preferred” discount, which means a higher percentage of carve-out policies are issued in the second-best underwriting class. The percentage of policies issued in the best underwriting class dropped in the NWS market in 2020 from 44.9 to 43.6 percent. However, it was higher than in either 2018 (43.1 percent) or 2017 (40.5 percent). Meanwhile the percentage in the WS market increased from 81.7 to 89.4 percent, partly due to a change in market share among insurers. The 2020 WS was lower than in either 2018 (93.9 percent) or 2017 (91.9 percent), but in 2017-18, our data included more large group business with significant health concessions.
Benefit Period The WS average benefit period is low for core/buy-up programs and somewhat low for voluntary programs. Executive carve-out programs sometimes have longer benefit periods than the NWS market. Our 2020 WS and NWS average benefit periods are similar, with WS having significantly more two-year benefit periods this year. Last year, the average benefit period was the same in the WS and NWS markets.
Table 10 shows corresponding data back to 2013. As noted elsewhere, this data can jump around based on which insurers provide such detail and whether large core/buy-up cases are written in a particular year.
As discussed later, the WS market issues much less Shared Care.
Maximum Monthly Benefit Even with a lot of executive carve-out business, Table 11 shows that the WS market has many core programs sold with a $50/day or $1500/month initial maximum benefit. In 2020, both the WS and NWS markets had more business concentrated between $3,000 and $5,999 initial monthly maximums.
Table 12 shows that the WS initial monthly maximum has varied more over time than the whole market, because of participant changes and how many core/buy-up plans were sold in a particular year.
Benefit Increase Features As shown in Table 13, the WS market has more future purchase options (FPO), because of its core programs. The high indexed FPO WS percentage is caused by a change in carrier market share based on policy count.
Both the NWS market (15.9 to 14.5 percent) and the WS market (20.8 to 16.5 percent) saw decreases in the percentage of policies sold with no benefit increase feature.
Future Protection Based on a $24/hour cost for non-professional personal care at home ($24 is the median cost according to Genworth’s 2020 Cost of Care Survey), the average WS initial maximum daily benefit of $148.90 would cover 6.2 hours of such care per day at issue, whereas the typical NWS initial daily maximum of $163.60 would cover 6.8 hours of such care per day, as shown in Table 14. This year’s higher cost (the hourly cost was $23 in 2019) contributed to the decrease in the number of initial covered hours from 6.8 (WS) and 7.1 (NWS) last year.
The number of future home care hours that could be covered depends upon when care is needed (we have assumed age 80), the home care cost inflation rate between now (age 42 for WS and 58 for NWS) and age 80 (we have calculated with two, three, four, five and six percent inflation), and the benefit increases provided by the LTCI coverage between now and age 80.
Table 14 shows calculations for 3 different assumptions relative to benefit increase features:
The first line presumes that no benefit increases occur (either sold without any benefit increase feature or no FPOs were exercised).
The second line reflects the average benefit increase design using the methodology reported in the July article, except it assumes that 40 percent of FPOs are elected (intended to be indicative of “positive” election FPOs, in which the increase occurs only if the client elects it) and provide five percent compounding.
The third line is like the second line except it assumes 90 percent of FPOs are elected (intended to be indicative of “negative” election FPOs, in which the increase occurs unless the client rejects it). It also assumes the FPOs reflect five percent compounding.
Table 14 indicates that:
Without benefit increases, purchasing power deteriorates significantly, particularly for the WS purchaser because there are more years of future inflation for a younger buyer. With four percent inflation and no benefit increases, the number of covered hours of home care at age 80 dropped from 1.8 in 2019 to 1.4 in 2020 for the WS market and from 3.0 in 2019 to 2.9 in 2020 for the NWS market.
The “composite” (average) benefit increase design assuming that 40 percent of FPO offers are exercised preserves purchasing power better than when no increases are assumed, but still generally leads to significant loss of purchasing power. The exceptions: both WS and NWS purchasers gain a bit of purchasing power if the inflation rate is only two percent (with a 40 percent FPO election rate, the composite is greater than two percent compounding). With three percent inflation, the NWS clients gain purchasing power but the WS clients lose a slight bit of purchasing power.
With 90 percent FPO election rates, the average WS buyer would experience increased purchasing power with four percent or less inflation but would lose purchasing power with five percent or more inflation. The average NWS buyer gains purchasing power with three percent or less inflation but loses purchasing power with four percent or more inflation.
Table 14 also underscores the importance of considering future purchasing power when buying LTCI. Please note:
a) The average WS buyer was 16 years younger at issue, hence has 16 more years of inflation and benefit increases in the above table. The effective inflation rate to age 80 is not likely to be the same for 42-year-olds versus 58-year-olds purchasing today.
b) WS sales have more FPOs, so WS results are more sensitive to FPO election rates.
c) Results vary significantly based on an insured’s issue age, initial maximum daily benefit, and benefit increase feature, as well as the inflation rate and the age at which the need for care occurs.
d) By the median age of starting to need care (about age 83) and the median age of needing care (about age 85), more purchasing power could be gained or lost.
e) Table 14 does not reflect the cost of professional home care or a facility. According to the aforementioned 2020 Genworth study, the average nursing home private room cost is $290/day, which is currently comparable to 12.1 hours of non-professional home care. However, the inflation rate for facility costs is likely to differ from the inflation rate for home care. From 2004-2020, Genworth’s studies showed the following compound growth rates: private room in a nursing home (3.1 percent), assisted living facility (3.7 percent), home health aide (1.6 percent), and home care homemaker (2.2 percent).
f) Table 14 could be distorted by simplifications in our calculations. For example, we assumed that the FPO election rate does not vary by age, size of policy or market and that everyone buys a home care benefit equal to the average facility benefit.
Partnership Program Background When someone applies to Medicaid for long-term care services, most states with Partnership programs disregard assets up to the amount of benefits received from a Partnership-qualified policy (some IN and NY policies disregard all assets). Partnership programs exist in 44 jurisdictions (all but AK, DC, HI, MA, MS, UT, and VT), but MA has a somewhat similar program (MassHealth). The first four states to develop Partnerships (CA, CT, IN and NY) have different rules, some of which have become a hindrance to sales. We are not aware of a Partnership-qualified WS LTCI product in those states, which is unfortunate because the WS market serves many people who could benefit from Partnership.
To qualify for a state Partnership program, a policy must have a sufficiently robust benefit increase feature. Many jurisdictions have lowered the minimum Partnership-eligible compounding benefit inflation rate to one percent. To facilitate Partnership sales in such jurisdictions, an insurer could lower its minimum size by 1/3 (e.g., from $1500 to $1000) if one percent compounding is included in a core program. The revenue from the core program would typically increase. The premium would be more level by issue age, shifting risk to the younger ages which is preferable for the insurer in a core program.
Jurisdictional Distribution Broker World’s website (Click here) has a chart of the market share of each US jurisdiction relative to the total, WS and NWS markets, and the Partnership percentage by state. This chart indicates where relative opportunity may exist to grow LTCI sales.
Elimination Period More than 90 percent of the NWS market buys 90-day elimination periods (EPs). For that reason, many WS programs offer only a 90-day EP. Yet, probably because we lack data for some insurers which sell almost entirely 90-day WS EP, our WS data shows many more WS policies with 180-day or longer EPs (7.8 percent) than in the NWS market (5.0 percent).
Table 15 also shows how many policies had a 0-day home care feature and a longer facility EP and how many policies had a calendar-day EP (as opposed to a service-day EP). We have reflected that all LifeSecure policies are 90-day EP with a calendar-day definition and all Transamerica sales have 0-day home care EP. Policies which have 0-day home care EP, but define their EP as a service-day EP operate almost identically to a calendar-day EP.
The significant differences in 0-day home care EP and in calendar-day EP by market reflect specific insurers’ design preferences; they do not appear to be driven by the market.
Gender Distribution and Sales to Couples and Relatives Insurers began sex-distinct LTCI pricing in 2013, but, as explained above, unisex pricing continues in the WS market. The 2013-2015 percentages of females in the NWS market were high as insurers which still offered unisex pricing attracted single females.
In the past five years, the percentage of female buyers in the NWS has been stable, fluctuating from 54.3 to 54.9 percent.
From 2015-2018, the high percentage of WS buyers who are female suggested that women were particularly attracted to voluntary WS LTCI (presumably because of unisex pricing). Our WS results are heavily distributed to executive carve-out programs, and many executive carve-out programs cover spouses.
The low 2019 percentage of female sales in the WS was mostly attributable to a drop in female sales for a major insurer. That insurer’s percentage of female sales bounced partly back in 2020.
In 2020, women constituted 50.5 percent of the USA age 20-79 population1, but a slightly higher 54.3 percent of total LTCI purchases. Women were only 46.8 percent of workers2 but accounted for 53.9 percent of WS sales.
Table 17 digs deeper, exploring the differences between the WS and NWS markets in single female, couples and Shared Care sales.
It shows that the bounce-back in female sales at the WS was primarily among single people. Insuring one spouse became more common in the WS market, but when both spouses were insured, Shared Care became more common. Shared Care is less common in the WS market because it often is not offered and because spouses often don’t buy. Also, executive carve-out programs may feel that insuring spouses favors married personnel and that adding Shared Care does so to an undesirable degree.
The NWS market saw a shift to more couples-both-buying sales, but among sales to single people, the percentage of females increased.
Our limited data with regard to relatives who buy shows that two spouses are insured for every three employees. That’s a high percentage reflective of executive carve-out data. Only about one percent of purchasers are relatives other than the employee and employees’ spouses.
Type of Home Care Coverage Table 18 summarizes sales by type of home care coverage. Historically, the WS market sold few policies with a home care maximum equal to the facility maximum. But with increasing emphasis on home care and simplicity, that difference faded. Yet, in 2020, there was a small drop in WS sales with a 100 percent home care benefit.
Table 18 also shows that monthly determination dominates the NWS market, but daily determination still dominates the WS market. The particularly low 2020 monthly determination percentage in the WS was caused primarily by a change in distribution of WS sales among participants.
Many WS products embed a “partial cash alternative” feature (which allow claimants, in lieu of any other benefit that month, to use approximately 1/3 of their benefit for whatever purpose they wish, with the balance extending the benefit period) or a small informal care benefit.
Other Features Table 19 suggests that Return of Premium (ROP) became more common in the WS market in 2020 but a bit less common in the NWS market. In each market, the percentage of ROP features actively chosen by purchasers increased. The percentage of ROP riders that expire increased even though embedded ROP almost always expires. ROP with expiring death benefits can provide an inexpensive way to encourage more young people to buy LTCI but may not provide a meaningful benefit.
Table 20 shows significant drops in WS sales of Joint Waiver of Premium and Survivorship to couples, but and a significant increase in Restoration of Benefits (ROB). These changes are significantly related to changes in market share by insurer. All WS sales are tax-qualified. Our 2019 percentages are corrected in Table 20.
CLOSING We thank insurance company staff for submitting the data and responding to questions promptly. We also thank Sophie Fosdick, Margaret Liang, Nicole Gaspar, and Alex Geanous of Milliman for managing the data expertly.
We reviewed data for reasonableness. Nonetheless, we cannot assure that all data is accurate.
If you have suggestions for improving this survey, please contact one of the authors.
The 2021 Milliman Long Term Care Insurance Survey is the 23rd consecutive annual review of stand-alone long-term care insurance (LTCI) published by Broker World magazine. It analyzes the marketplace, reports sales distributions, and describes available products.
More discussion of worksite sales, including a comparison of worksite sales distributions vs. non-worksite sales distributions will be in Broker World magazine’s August issue.
Unless otherwise indicated, references are solely to U.S. stand-alone LTCI sales, excluding exercised future purchase options (FPOs) or other changes to existing coverage. “Stand-alone” refers to LTCI policies that do not include death benefits (other than returning premiums upon death or waiving a surviving spouse’s premiums) or annuity or disability income benefits. Where referenced, “combo” products provide LTCI combined with life insurance or annuity coverage. “Linked benefit” policies are combo policies which can allow more than the death benefit or annuity account value to be used as LTCI.
Highlights from this year’s survey
Participants Eight carriers participated broadly in this survey. Four others provided sales information so we could report more accurate aggregate industry individual and multi-life sales.
We estimate our statistical distributions reflect about 75 percent of total industry policies sold (85 percent of premium) and about 15 percent of worksite policies sold (30 percent of premium). Total industry sales and total worksite sales (the denominators) include authors’ estimates of sales for three companies.
Our worksite statistical distributions can vary significantly from year-to-year because insurers focusing on particular worksite markets may be over- or under-represented. Our worksite statistical analysis is overly weighted toward executive carve-out programs. The carriers which provided 2020 statistical data had an average worksite annual premium of $4,218 whereas the insurers which did not provide statistical data had an average worksite premium of $1,634.
CalPERS, Northwestern and the six insurers displayed in the Product Exhibit provided broad statistical information. Auto-Owners, Country, LifeSecure, and Transamerica contributed total and worksite sales (new premium and lives insured) but did not provide other information. However, in a few places we were able to reflect some of their product designs in our statistical distributions. We estimate approximately $10 million of sales for those insurers which did not contribute their sales data.
Country Life, Genworth and CalPERS stopped selling stand-alone LTCI in 2020; however, Genworth has since resumed sales and CalPERS intends to resume sales. MassMutual and Transamerica discontinued selling stand-alone LTCI early in 2021 but Transamerica continued to accept new worksite applications until mid-year and may be experiencing last minute sales as a result.
Sales Summary
After having reported an increase in new premiums in 2019 (for the first time since 2012), twelve insurers reported $139,562,096* in 2020 annualized new premium sales (including exercised FPOs) and 41,440 new policies, 9.7 percent less premium and 11.9 percent fewer policies than the same insurers sold in 2019. However, some insurers with limited 2020 activity did not report 2020 sales to us. Including estimated sales for those insurers we peg total stand-alone LTCI industry sales at about $150 million*, which is nearly 13 percent less than the 2019 sales of $171,634,536 (restated upward by nearly $900,000 from our report last year). As noted in the Market Perspective section, sales of policies combining life insurance with LTCI or Chronic Illness benefits dropped eight percent in the first half of 2020 and corresponding premium dropped 19 percent. *Single premium sales are counted at ten percent for the annualized premium calculations herein.
Although we are not able to quantify the magnitude, the COVID-19 pandemic could have had a material impact on sales.
Three insurers sold more new premium than in 2019.
The pandemic may have had a greater impact on worksite sales. We estimate worksite new annualized LTCI premium dropped 15 percent in 2020 (18 percent fewer new sales).
With FPO elections included in new premium, Northwestern retained the number one spot in sales. Mutual of Omaha was a strong second and again had a large lead in annualized premium from new policies sold. Together, these two insurers combined for 60 percent of new premium including FPOs, compared to 59 percent last year.
The number of policies inforce increased each year through 2014 but has decreased each year since, decreasing 0.9 percent in 2020. However, inforce premium continued to increase (1.9 percent) despite fewer policies inforce and more policies in paid-up status. Inforce premium rises due to sales, price increases, and benefit increases (including FPOs), and reduces from lapses, reductions in coverage, deaths, and shifts to paid-up status for various reasons. A major carrier did not report inforce data, likely suppressing the percentage of inforce premium increase.
Collectively, the seven participants which reported claims saw claims increase only 1.6 percent in 2020, partly because two insurers reported a reduction in claims. The other five insurers experienced a 5.2 percent increase in claims in 2020. Overall, the stand-alone LTCI industry incurred $12.9 billion in claims in 2019 based on companies’ statutory annual filings, raising total incurred claims from 1991 through 2019 to $154.4 billion. (Note: 2019 was the most recent year available when this article was written.) Most of these claims were incurred by insurers that no longer sell LTCI. The reported 2019 incurred claims are 11.2 percent higher than the $11.6 billion of incurred claims reported in 2018.
The placement rate dropped from 59.2 percent in 2019 to 57.8 percent in 2020, which is also lower than the 59.0 percent and 58.8 percent placement rates in 2017 and 2018, respectively. Difficulty in collecting underwriting information during the pandemic may have contributed to lower placement rates. Table 23 shows that three-fourths of the reduction in placement rate can be attributed to suspended and withdrawn applications and Table 26 shows that underwriting averaged about 3 days longer. The longer average underwriting time was also likely caused by the pandemic. However, due to 2020 pending applications that will be reported in 2021, as well as the 2019 applications that were pending at the end of that year, some of our statistics such as underwriting processing time do not fully reflect the impact of the pandemic.
About the Survey This article is arranged in the following sections:
Highlights provides a high-level view of results. Market Perspective provides insights into the LTCI market. Claims presents industry-level claims data. Sales Statistical Analysis presents industry-level sales distributions reflecting data from 8 insurers. Partnership Programs discusses the impact of the state partnerships for LTCI.
Available here at www.BrokerWorldMag.com:
Product Exhibit shows, for 6 insurers: financial ratings, LTCI sales and inforce, and product details.
Product Details, a row-by-row definition of the product exhibit entries, with some commentary.
Premium Exhibit shows lifetime annual premiums for each insurer’s most common underwriting class, for issue ages 40, 50, 60, and 70 for single females, single males, and heterosexual couples (assuming both buy at the same age), based on $100 per day (or closest equivalent weekly or monthly) benefit, 90-day facility and most common home care elimination period, three-year and five-year benefit periods or $100,000 and $200,000 maximum lifetime buckets, with and without Shared Care and with flat benefits or automatic three or five percent annual compound benefit increases for life. Worksite premiums do not reflect any worksite-specific discount, though some carriers offer this.
Premium Adjustments (from our Premium Exhibit prices) by underwriting class for each participant.
State-by-state results: percentage of sales by state, average premium by state and percentage of policies qualifying for Partnership by state.
MARKET PERSPECTIVE (more detail in subsequent parts of the article)
“Both buy” and married discounts are reaching stable points. In the past year, some insurers lowered couples’ discounts significantly, to the 15 to 20 percent range. One-of-a-couple discounts are also dropping, to the zero to five percent range. The histories of these discounts are related.
When all LTCI had unisex prices, insurers’ single-person prices reflected that single buyers were predominantly female. Couples who bought policies were nearly 50 percent male; insurers did not have to charge them two prices weighted toward females, so they raised the couples’ discount. When the industry converted to gender-distinct pricing, the justification for couples’ discounts decreased substantially; however, large couples’ discounts continued to be common until now.
As an example, a single person price of $1,500 led to a couples’ combined price of $1,800 when couples’ discounts were 40 percent. If insurers took away the couples’ discount when one spouse was declined, consumers would be disappointed that the spouse about whom they were most concerned was declined, and the price for the healthy insured would be 5/6 of their combined price (5/7 if the discount was 30 percent). Fearing that the healthy spouse would refuse the policy, insurers typically cut the discount in half, rather than removing it completely. In the above example, the healthy spouse would have been charged $1,200 to $1,275, depending on whether the couples’ discount was 40 or 30 percent, respectively.
In the 2019 article “Is Your Spouse Contagious?,” Milliman analyzed the additional cost of LTC incurred by people whose spouses already had LTCI claims. As people who are LTC caregivers are likely to have worse LTCI claims experience than single people, a discount is inappropriate if the spouse is uninsurable. Of course, sometimes only one spouse buys even though both are healthy; for example, perhaps one spouse already has coverage. Nonetheless, their results make it hard to justify an across-the-board one-of-a-couple discount.
We summarized the “Is Your Spouse Contagious?” findings in our survey questionnaire, asking what the industry can do to lower claim costs after the claim or death of a spouse. The same five insurers responded to each question and their recommendations mostly cut across both situations. They cited proactive outreach to provide supportive services to help clients age in place, including preventive measures and care management, examples being home safety assessments and technology to monitor an insured’s health if they live alone. Following the death of a spouse, one carrier suggested informal care options with low daily limits which would permit relatives to be paid caregivers and another suggested a new plan of care, answers that seemed to anticipate that the survivor was already on claim. There were some concerns, however, with one insurer indicating that “cost will be a barrier” and another commenting “if appropriate”.
When one spouse is on claim, two insurers suggested offering respite care options to support the non-claim spouse.
Some specific steps the respondents may have had in mind in their general comments include brain fitness training; helping the healthy spouse marshal and manage resources to help the care recipient; access to cognitive tests that provide early detection of cognitive slippage; lifestyle suggestions including diet and sources of prepared meals; home modification projects; document organization; end-of-life planning; tele-medicine; information to access available government benefits and local services; help in finding and evaluating potential commercial caregivers; products and information about reducing risk and/or facilitating improved caregiving; etc.
We noted that the 10-year Treasury yield as of January 1, 2021 was 0.93 percent and asked what insurers projected it would be in 5 and 10 years. The range in five years was scattered between 1.5 to 3.0 percent and in ten years was two to three percent, with four of the five answers being 2.9 to 3.0 percent. Although all envisioned rising interest rates, only two mentioned that it would ease pressure on profit margins.
The June issue of Broker World magazine had an article about the impact of the pandemic which included data from this survey. Rather than repeat that data here, we refer readers to the June issue.
Government-provided LTCI programs continue to be a topic of discussion.
The Affordable Care Act (2010) included a LTCI program (the “CLASS” Act). Criticisms of the design were validated when, after passage of the ACA, the government dropped the LTCI program because it could not find a way to make it work.
Since then, there have been state efforts to create LTCI programs. On January 1, 2022, the Washington Long-Term Care Trust (WLTCT) will begin collecting 0.58 percent payroll tax to fund a $36,500 lifetime pool of money starting in 2025 (the pool of money is intended to inflate according to the Washington consumer price index). The program provides coverage for vested individuals receiving care in the state of WA. Government-provided LTCI programs will be watched closely for their potential impact on LTCI sales.
Since 2009 (varies by jurisdiction), if an insurer concludes that a claimant is not chronically ill, the insurer must inform the claimant of his/her right to appeal the decision to independent third-party review (IR), which is binding on insurers. As shown in our Product Exhibit, most participants have extended IR beyond statutory requirements, most commonly to policies issued prior to the effective date of IR. It is hard to get data relative to IR. Regulators in some states have not set up the required panel of independent reviewers and regulators do not collect IR statistics. Insurers often do not track IR. It is complimentary of the industry’s claims processing that there has not been a clamor for IR; that there have been significantly fewer requests in the past two years; and that insurers have consistently been completely upheld 70 percent or more of the time based on data we have received over the years from insurers and from Steve LaPierre, President of LTCI Independent Eligibility Review Specialists, LLC (LTCIIERS). In other cases, the reviewer might agree with the insurer partly (e.g., that the claimant did not satisfy the triggers initially, while concluding that the claimant satisfied the triggers later).
Current prices are more stable than past prices, partly because today’s prices reflect much more conservative assumptions based on far more credible data and lower assumed investment yields. Three participants have never increased premiums on policies issued under “rate stabilization” laws. The others reported no increases on policies issued since 2015, 2014 (2 insurers), and 2013 (2 insurers). Nonetheless, many financial advisors presume new policies will face steep price increases, and hence may be reluctant to encourage clients to consider LTCI.
As shown in Table 23, the placement rate for the past 8 years has remained at about 60 percent. Improving the placement rate is critical to encourage financial advisors to mention LTCI to clients. The industry may be able to improve placement rates as follows.
Utilize E-applications for faster submission and reduced processing time, thereby increasing placement.
Pre-qualify an applicant’s health. Effectively and efficiently increasing the percentage of applicants who are pre-qualified will decrease declines.
More effective education of distributors by insurers, such as drill-down questions in on-line underwriting guides and eApps.
Require cash with the application (CWA). CWA led to about five percent more of the apps being placed according to our 2019 survey.
Continue to improve messaging regarding the value of LTCI and of buying now (rather than in the future). Such messaging would increase the number of applications and improve the placement rate by attracting younger and healthier applicants.
Once again, more than 80 percent of our participants’ policyholders exercised their FPOs (future purchase option, a guarantee that, under specified conditions, a policyholder can purchase additional coverage without demonstrating good health). As both the additional coverage and unit price increase over time, FPOs become increasingly expensive, even more so with the price increases that the industry has experienced. The high election rate demonstrates the importance of LTCI to policyholders and the effectiveness of annual (as opposed to triennial) negative-election FPOs. (Negative-election FPOs activate automatically unless the client rejects them, as opposed to positive-election FPOs which activate only if the client makes a request.) At least in some markets and with some designs, policyholders reliably exercise FPOs when they must do so to continue to receive future offers. Considering such FPOs and other provisions, we project a maximum benefit at age 80 of $305/day for an average 58-year-old purchaser in 2020, which is equivalent to an average 2.9 percent compounded benefit increase between 2020 and 2042. Purchasers may be disappointed if the purchasing power of their LTCI policies deteriorates over time.
Linked benefit products are attractive because even if the insured has no LTC claim, their family will receive benefits and because they often have guaranteed premiums and benefits. According to LIMRA, 516,809 stand-alone LTCI and combination (life and LTCI and life and Chronic Illness) policies were sold in 2019 and were distributed as follows, with stand-alone LTCI’s 11 percent market share the same as 2018. (ADB= “Accelerated Death Benefit)
The stand-alone column and the linked-benefit column are both much more significant in terms of LTC protection than indicated above, for the following reasons:
The Accelerated Death Benefit (ADB) provisions do not increase over time. By the time the average claim payment is made, the stand-alone policies’ maximum monthly benefit (on plans with benefit increase features) will have risen significantly. The linked-benefit portion would also have increased significantly.
The stand-alone and linked-benefit policies have significantly lower lapse rates than the policies with ADB. Thus, they are much more likely to be around when care is needed.
The stand-alone and linked-benefit policies may have lower mortality rates because of their better persistency and because they are purchased with LTCI in mind whereas the ADB policies are generally purchased for their life insurance and the ADB benefit may be incidental in the minds of the buyers.
The ADB policies are less likely to be used to pay for care, as it may be preferable to have the death benefit be paid to the beneficiary.
A small offset is that the stand-alone policies are more likely to be reimbursement-based benefits, which are less likely to result in the full benefit being paid each month.
According to LIMRA, in the first half of 2019, combination life sales dropped slightly, but then rebounded strongly in the latter half of the year to finish ten percent higher than 2018 in terms of premium (although, one percent lower in terms of the numbers of policies). However, in the first half of 2020 (the most recent data available as this article was being written), premiums were 19 percent lower and new policies eight percent lower than the weak first half of 2019. In addition to the pandemic, LIMRA noted that the new 2017 CSO Mortality Table and low interest rates led to higher premiums which depressed sales. The policies with the most significant LTCI benefits (linked benefits) dropped the most (27 percent in premium; 21 percent in policy count).
Only four participants offer coverage in all U.S. jurisdictions; no worksite insurer does so. Insurers are reluctant to sell in jurisdictions which have unfavorable legislation or regulations, restrict rate increases, or are slow to approve new products.
All but one of our participants use third party administrators (TPAs) and five of the eight participants use reinsurers. The number of insurers using TPAs for the following functions is shown in parentheses: Underwriting (6), Issue (5), Billing (5), Commissions (3), and Claims (6). Two insurers noted they use their underwriting and claims TPAs for only some functions and another, which responded that it does not use TPAs for underwriting and claims, noted that it sometimes receives help from its TPA, but the TPA never makes the decision. We thank CHCS, DMS, LifeCare Assurance, Long-Term Care Group, RGA, and Wilton Re for their contributions to the LTCI industry. Other reinsurers and TPAs may support insurers not in our survey. In some cases, affiliated companies provide reinsurance or guarantees.
CLAIMS
Seven participants reported 2020 claims. As some companies are not able to provide detailed data, some statistics are more robust than others.
The insurers’ combined claim payments on individual policies rose 1.6 percent in 2020 over 2019. Two insurers reported a decrease in claims, while the other five insurers reported a 5.2 percent increase.
The LTCI industry has had a much bigger impact than indicated above, because a lot of claims are paid by insurers that do not currently sell LTCI or did not submit claims data to us.
LTCI claims paid by insurers no longer selling LTCI may differ significantly from the following statistics as their claimants are more likely to have facility-only coverage, be older, etc.
Table 1 shows the total dollar and number of reported individual and multi-life (not group) LTCI claims. It reflects the same carriers for both years. As noted above, total claims rose only 1.6 percent. The impact of the pandemic is not clear in the data, but some claimants likely died prematurely and/or spurned facility care, particularly nursing home care. Some claimants likely abandoned facilities, thereby losing coverage either because they did not hire commercial home caregivers or because they had a facility-only policy and did not qualify for exemptions that some insurers provided. Claimants and commercial caregivers potentially were hesitant to meet during a large part of the year, likely dampening home care claims.
Table 2 shows the distribution of those claims by venue, which have shifted away from nursing homes over the years (except in 2019) due to consumer preferences and more claims coming from comprehensive policies. The distribution reflects different insurers from year-to-year; 2019’s aberration was caused by the absence of data from an insurer which resumed providing data this year.
The inception-to-date number of claims is surprisingly more weighted to Nursing Home than the dollar of claims. It seems that nursing home claims come from older policies with lower maximum daily benefits.
In the distribution based on number of claims, a person who received care in more than one venue is counted once for each venue, but not double-counted in the total line. Six carriers reported their number of open individual claims at year-end, ranging between 51 and 81 percent of the number of claims paid during the year, averaging 64 percent overall.
Table 3 shows average size individual claims since inception. Because 41 percent of claimants since inception have submitted claims from more than one type of venue, the average total claim might be expected to exceed the average claim paid for any particular venue. However, individual Assisted Living Facility (ALF) claims stand out as high each year, probably because:
ALF claims appear to have a longer duration compared with other venues.
Nursing home costs are most likely to exceed the policy daily/monthly maximum, hence nursing home claims are most likely to understate the cost of care.
People who maximize the use of their maximum monthly benefits can generally spend as much in an ALF as in a nursing home.
Although some surveys report that ALFs cost about half as much as nursing homes on average, ALFs often charge more for a memory unit or for levels of assistance that align more closely with nursing home care. Upscale ALFs seem to cost a higher percentage of upscale nursing home costs than the average ALF/nursing home ratio.
Several insurers extend ALF coverage to policies which originally did not include ALF coverage, providing policyholders with significant flexibility at time of claim, but contributing to the insurers’ need for rate increases.
The following factors contribute to a large range of average claim results by insurer (see Table 3), which results in significant year-to-year differences in Table 3 because different insurers contribute data:
Different markets (by affluence; worksite vs. individual; geography; etc.)
Demographic differences (distribution by gender and age)
Distribution by benefit period, benefit increase feature, shared care and elimination period.
Distribution by facility-only policies vs. 50 percent home care vs. 100 percent home care vs. home care only, etc.
Different lengths of time in the business.
The following factors cause our average claim sizes to be understated.
For insurers reporting claims this year, nine percent of inception-to-date individual claims are still open. Our data does not include reserve estimates for future payments on open claims.
People who recover, then claim again, are counted as multiple insureds, rather than adding their various claims together.
Besides being understated, average claim data does not reflect the value of LTCI from some purchasers’ perspectives, because the many small claims drive down the average claim. LTCI can provide significant financial return for people who need care one year or longer. A primary purpose of insurance is to protect against adverse results, so the amount of protection, as well as average claim, is important.
Five insurers provided their current individual (excludes group) monthly LTCI claim exposure, which exceeds $5 billion (note: reflects only initial monthly maximum for one insurer). As shown in Table 4, this figure is thirty times their corresponding monthly LTCI premium income and more than 41 times their 2020 LTCI monthly paid claims. Eight insurers contributed data regarding their inforce distribution by benefit period. Treating endless (lifetime benefit periods) as a 15-year benefit period, we found that their average inforce benefit period is 6.85 years. Changing the assigned value of the endless benefit period by one year has an impact of approximately 0.25 years on the average inforce benefit period. With annual exposure thirty times annual premium and assuming an average benefit period of about 6.85 years, we estimate that total exposure is 207 times annual premium.
Three insurers reported their current average individual maximum monthly maximum benefit for claimants, with results ranging from $4,121 to $6,729.
Nursing home (NH) claims are more likely to use the policy’s maximum daily/monthly benefit than ALF claims, because ALF daily/monthly costs are generally lower and because policies sometimes have lower maximums for ALFs. ALF claims correspondingly are more likely to use the policy maximum than are adult day care and home care claims.
STATISTICAL ANALYSIS Bankers Life, CalPERS, Knights of Columbus, Mutual of Omaha, National Guardian, New York Life, Northwestern and Thrivent contributed significant background data, but some were unable to contribute some data. Four other insurers (Auto-Owners, Country, LifeSecure and Transamerica) contributed their number of policies sold and new annualized premium, distinguishing worksite from other sales, but not clarifying whether FPOs were included in the premium.
Sales characteristics vary significantly among insurers based on market differences (individual vs. worksite, affluence, gender distribution, etc.). Year-to-year variations in policy feature distributions may reflect industry trends but may also reflect changes in participants, participant practices and designs, participant or worksite market shares, etc. The statistical differences between the worksite and non-worksite sales will be reported in the August issue of Broker World.
Market Share Because new coverage is being issued, we include purchased increases on existing policies in new premium (we call them FPOs and include board-approved increase offers). FPOs increased in 2020, cushioning the reduction in premium from new sales. Removing FPOs spotlights insurers with more new policy sales. Table 5 lists the top 8 participants in 2020 new premium including FPOs and without FPOs. Northwestern ranks #1 including FPOs, with Northwestern and Mutual of Omaha accounting for 60 percent of the market. Ignoring FPOs, Mutual of Omaha is #1. The premium includes 100 percent of recurring premiums plus ten percent of single premiums.
Worksite Market Share After a strong 2019, worksite premium dropped about 15 percent in 2020, accounting for a lower percentage of total sales than in 2019. It is possible that the worksite market could have produced a bigger percentage of total sales than in 2019 had the pandemic not occurred. However, with Transamerica leaving the market and other changes, the future of the worksite LTCI market (except executive carveout) is unpredictable. LifeSecure, Mutual of Omaha, and National Guardian may pick up market share; linked-benefit worksite products might pick up market share; and/or LTC risk covered in the worksite might drop.
Worksite sales consist of three different markets, the first two of which produce a higher percentage of new insureds than of new premiums:
Voluntary group coverage generally is less robust than individual coverage.
Core/Buy-Up programs have particularly young age distributions and modest coverage because a lot of people do not buy-up and are less likely to insure spouses.
Executive carve-out programs generally provide the most robust coverage. One- or two-couple executive carve-out sales may not qualify for a multi-life discount with some insurers, hence may not be labeled as worksite sales in submissions to our survey.
The amount of worksite sales reported and its distribution among the three sub-markets significantly impact product feature sales distributions. Table 6 is indicative of the full market (including our estimates for two insurers which did not report sales), but this year’s policy feature distributions significantly underweight the voluntary and core/buy-up markets, as most of those markets are not reflected in our statistical data. More information about worksite sales will appear in the August issue of Broker World magazine.
Affinity Market Share Affinity groups (non-employers such as associations) produced 8.1 percent of new insureds (see Table 7), and 6.0 percent of new business premium. Less than 20 percent of the lower affinity average premium is attributable to the affinity discount. The balance may be due to younger issue age or less robust coverage. It would seem that, over time, an increasing number of associations would have discounts, which might cause the affinity group percentage to increase over time, but our data does not demonstrate such a pattern.
Characteristics of Policies Sold Average Premium Per Sale The average new business (NB) premium per insured (Table 8), subtracting FPOs for the insurers that reported statistics, and the average premium per buying unit (a couple comprise a single buying unit) increased six to seven percent each to $2,706 and $3,847, respectively.
Data for 2018 and earlier years included FPOs in these calculations, overstating the average premium per new insured and buying unit.
Average premium per new policy ranged from $1,029 to $3,792 among the 12 insurers. The lowest average new premium (including FPOs) was in Puerto Rico ($2,511), followed by Indiana ($2,642) and Kansas ($2,915), while the highest was in the District of Columbia ($5,336), followed by Connecticut ($4,820), and New York ($4,656). For those insurers which reported results for 2019 and 2020, the average inforce premium (reflecting rate increases, FPO elections and termination of older policies) increased from $2,246 to $2,309, a 2.8 percent increase. However, Table 8 shows a decrease due to a change in insurers reporting inforce premium.
Issue Age Table 9 summarizes the distribution of sales by issue age band based on insured count. The average issue age remained 57.7. All insurers reported an average issue age between 55 and 60. The age distributions for 2016 and earlier had more worksite participants than recent years. Note: one survey participant has a minimum issue age of 40, one will not issue below 30, and one will not issue below 25.
Benefit Period Table 10 summarizes the distribution of sales by benefit period. For the first time since 2014, endless benefit periods registered a measurable percentage, albeit only 0.2 percent. The average benefit period for limited benefit period policies dropped back to 3.75, but if we treat endless benefit periods as 15 years, the average benefit period was 3.82. Because of Shared Care benefits, total coverage was higher than the 3.75 average suggests. Three-year benefit periods accounted for 52.9 percent of the sales.
Monthly Benefit Monthly determination applied to a record 83.0 percent of 2020 policies (Table 11). With monthly determination, low-expense days leave more benefits to cover high-expense days. One insurer offers only daily determination; one insurer offers a choice; and the other insurers automatically have monthly determination.
Table 12 shows the largest concentration ever in the $4,500-$5,999 initial monthly maximum range (32.3 percent). The average maximum monthly benefit increased slightly to $4,888.
Benefit Increase Features Table 13 summarizes the distribution of sales by benefit increase feature. Most notably, only 14.6 percent of the policies were sold without a benefit increase feature.
“Indexed Level Premium” policies are priced to have a level premium, but the benefit increase is tied to an index such as the consumer price index (CPI).
As shown in Table 14, we project the age 80 maximum daily benefit by increasing the average initial daily benefit from the average issue age to age 80, according to the distribution of benefit increase features, using current future purchase option (FPO) election rates and a five percent/year offer for fixed FPOs. The maximum benefit at age 80 (in 2042) for our 2020 average 58-year-old purchaser projects to $305/day (equivalent to 2.9 percent compounding). Had our average buyer bought an average 2019 policy a year ago at age 57, her/his age 80 benefit would be $316/day (equivalent to 2.9 percent compounding). Most policyholders seem likely to experience eroding purchasing power over time if cost of care trends exceed three percent.
FPOs are important to insureds in order to maintain purchasing power, and 82 percent of our participants’ 2019 to 2020 FPOs were exercised. The high election rate is noteworthy, considering that the cost increases each year due to larger coverage increases each year, increasing unit prices due to age, and additional price increases due to rate increases.
One insurer had an election rate of 91 percent, two insurers had 68 to 70 percent, two insurers had 43 to 45 percent, and one insurer had 19 percent. It seems clear that higher election rates occur if FPOs are more frequent (every year vs. every 3 years) and are “negative-election” (activate automatically unless the client rejects them) as opposed to “positive-election” (which activate only if the client makes a request). At least some blocks of business demonstrate that policyholders will exercise FPOs if they must do so to continue to receive future offers.
FPOs are also important to insurers, accounting for at least 22 percent of new premium in 2020. Two insurers had nearly half their new premium come from FPOs.
Elimination Period Table 16 summarizes the distribution of sales by facility elimination period (EP). Ninety-two percent (92 percent) of buyers opt for elimination periods between 84 and 100 days. The percentage of EPs of 100 days or more was 5.2 percent, lower than any other year in the table.
Table 17 shows the percentage of policies with zero-day home care elimination period (but a longer facility elimination period). For insurers offering an additional-cost zero-day home care EP option, the purchase rate is sensitive to the cost.
Table 17 also shows the percentage of policies with a calendar-day EP. It is important to understand that most calendar-day EP provisions do not start counting until a paid-service day has occurred.
Sales to Couples and Gender Distribution Table 18 summarizes the distribution of sales by gender and single/couple status.
In 2012, the last year in which all sales were unisex, 54.9 percent of buyers were female. In 2013, the female percentage spiked to 57.2 percent as females purchased unisex pricing that was still available. Since unisex pricing has disappeared entirely except in the worksite, the female percentage has plateaued at slightly above 54 percent. The percentage of females varies significantly based on an insurer’s markets. This year, the percentage of females varied from 45 to 63.9 percent among insurers.
The percentage of accepted applicants who purchase coverage when their partners are declined also varies significantly by insurer based on their couples’ pricing and their distribution system. Few insurers are able to report this data.
Shared Care and Other Couples’ Features Table 19 summarizes sales of Shared Care and other couples’ features.
Shared care allows one spouse/partner to use the other’s available benefits if their own coverage has been depleted or offers a third independent pool that the couple can share.
Survivorship waives a survivor’s premium after the first death if specified conditions are met.
Joint waiver of premium (WP) waives both insureds’ premiums if either qualifies for benefits.
Changes in distribution between carriers can greatly impact year-to-year comparisons in Table 19, because some insurers embed survivorship or joint waiver automatically (sometimes only in some circumstances) while others offer it for an extra premium or do not offer the feature.
In the top half of Table 19, percentages are based on the number of policies sold to couples who both buy (only limited benefit, for Shared Care). The bottom half of Table 19 shows the (higher) percentage that results from dividing by sales of insurers that offer the feature. For insurers reporting Shared Care sales, the percentage of both-buying couples who opted for Shared Care varied from 8 to 89.7 percent. The corresponding percentage of couples with Joint WP varied from 10 to 100 percent and for Survivorship ranged from 2.1 to 14.1 percent.
Table 20 provides additional breakdown on the characteristics of Shared Care sales. As shown on the right-hand side of Table 20, two- to four-year benefit period policies are most likely (26 to 31 percent) to add Shared Care. Partly because three-year benefit periods comprise 53 percent of sales, most policies with Shared Care (61 percent) have three-year benefit periods, as shown on the left side of Table 20.
Above, we stated that Shared Care is selected by 36.4 percent of couples who both buy limited benefit period policies. However, Table 20 shows Shared Care comprised no more than 31 percent of any benefit period. Table 20 has lower percentages because Table 19 denominators are limited to people who buy with their spouse/partner whereas Table 20 denominators include all buyers.
Shared Care is more concentrated in two- to four-year benefit periods (88.4 percent of shared sales) than are all sales (73.0 percent). Couples are more likely to buy short benefit periods because couples plan to help provide care to each other and Shared Care makes shorter benefit periods more acceptable. Single buyers are more likely to be female, hence opt for a longer benefit period.
Existence and Type of Home Care Coverage Four participants reported sales of facility-only policies, which accounted for 0.7 percent of total sales. One insurer was responsible for more than 80 percent of such sales. Ninety-six percent (96.4 percent) of the comprehensive policies included home care benefits at least equal to the facility benefit. No participant has reported home-care-only sales since 2018.
Other Characteristics As shown in Table 21, partial cash alternative features (which allow claimants, in lieu of any other benefit that month, to use between 10 and 40 percent of their benefits for whatever purpose they wish) were included in 52.5 percent of sales, including non-participant sales.
Return of premium (ROP) features were included in 10.4 percent of policies. ROP returns some or all premiums (usually reduced by paid LTCI benefits) when a policyholder dies. Approximately 75 percent of ROP features were embedded automatically in the product. Embedded features are designed to raise premiums minimally, typically decreasing the ROP benefit to $0 by age 75.
Nearly sixteen percent (15.8 percent) of policies with limited benefit periods included a restoration of benefits (ROB) provision, which typically restores used benefits when the insured has not needed services for at least six months. Approximately 90 percent of ROB features were automatically embedded.
Insurers must offer shortened benefit period (SBP) coverage, which makes limited future LTCI benefits available to people who stop paying premiums after three or more years. The insurers able to report SBP sales, sold SBP to 3.7 percent of buyers.
Only one insurer issued non-tax-qualified (NTQ) policies, which accounted for 0.1 percent of industry sales.
“Captive” (dedicated to one insurer) agents produced 53.1 percent of the coverages. Brokers produced 46.3 percent and a direct-to-consumer carrier accounted for 0.6 percent. At one time, “captive” agents who sold LTCI tended to specialize in LTCI. Now many are agents of mutual companies.
Sales distribution by jurisdiction is posted on the Broker World website.
Limited Pay and Paid-Up Policies In 2020, two insurers sold policies that become paid-up in 10 years or less, accounting for 1.1 percent of sales, the highest percentage since 2014, as shown in Table 22.
Because today’s prices are more stable, premium increases are less likely. One of the key reasons for buying 10-year-pay (avoidance of rate increases after the 10th year) is greatly reduced, while the cost of 10-year-pay has increased, making it less attractive than in the past. Nonetheless, limited-pay and single-pay policies are attractive to minimize post-retirement outflow and to accommodate §1035 exchanges.
Seven participants reported that 3.0 percent of their inforce policies are paid-up, a lower percentage than last year because an additional insurer participated.
PARTNERSHIP PROGRAM BACKGROUND When someone applies to Medicaid for long-term care services, most states with Partnership programs disregard assets up to the amount of benefits received from a Partnership-qualified policy (some Indiana and New York policies disregard all assets). Except for California, states with Partnership programs grant reciprocity to Partnership policies issued in other jurisdictions. Partnership programs are approved in 44 jurisdictions, all but AK, DC, HI, MA, MS, UT, and VT, but MA has a similar program (MassHealth).
Four states (CA, CT, IN and NY) blazed the trail, legislating variations of the Robert Woods Johnson approach (“RWJ” states), whereas “DRA” states use simpler, more consistent rules developed later, in the Deficit Reduction Act of 2005. For example, RWJ states require a separate Partnership policy form, generally still have more stringent benefit increase requirements and sometimes assess a fee for insurers to participate (none of which apply in DRA states).
Approximately 60 percent of Partnership states now allow one percent compounding to qualify for Partnership, which can help low-budget buyers qualify for Partnership and also enables worksite core programs to be Partnership-qualified. A higher percentage of policies would qualify for Partnership in the future if insurers and advisors leverage these opportunities. However, currently only three insurers offer one percent compounding. Partnership programs could be more successful if:
Advisors offer small maximum monthly benefits more frequently to the middle class. For example, a $1,500 initial maximum monthly benefit covers about four hours of home care every two days and, with compound benefit increases, may maintain buying power. Many middle-class individuals would like LTCI to help them stay at home while not “burning out” family caregivers and could be motivated further by Partnership asset disregard. (This approach does not work in RWJ states with high Partnership minimum daily benefit requirements.)
Middle-class prospects were better educated about the importance of benefit increases to maintain LTCI purchasing power and to qualify for Partnership asset disregard.
The four original Partnership states migrate to DRA rules.
More jurisdictions adopt Partnership programs.
Programs that privately finance direct mail educational LTCI content from public agencies were adopted more broadly.
Financial advisors were to press reluctant insurers to certify their products and offer one percent compounding.
More financial advisors were certified. Some people argue that certification requirements should be loosened. At a minimum, the renewal certification process could be improved.
Linked benefit products became Partnership-qualified.
PARTNERSHIP PROGRAM SALES Participants reported Partnership sales in all 44 authorized states except CT and NY. No participant sold Partnership policies in more than 41 states in 2020. Two had Partnership sales in 38 states, three in 29 to 34 states, one in 1 state, and the other has chosen not to certify Partnership conformance.
Insurance brokers do not have access to Partnership policies in CA, CT and NY and from only one insurer in IN. However, in some of those states, consumers can purchase Partnership-qualified coverage from one or two other entities.
In the DRA states, 55 percent of policies qualified for Partnership status. Minnesota (81.4 percent) leads each year. Georgia, Maine and Wisconsin were also above 70 percent.
The original RWJ states had few Partnership sales. In New Mexico, a recent Partnership state, only 4.7 percent of sales qualified, which should increase in the future. Kentucky had only 25.2 percent.
UNDERWRITING DATA Case Disposition Seven insurers contributed application case disposition data to Table 23. In 2020, 57.8 percent of applications were placed, the lowest ever, seemingly impacted by the pandemic. One insurer reported a 76.4 percent placement rate; all others were below the average, with three insurers between 40 and 47 percent.
Decline rates and suspended/withdrawn rates hit records. While we thought the suspended/withdrawn rate would rise with the pandemic, of the six insurers who have reported such data for both 2019 and 2020, two had a noticeably lower suspended/withdrawn rate in 2020 and two were +/-0.1 percent.
Decline rate by carrier varied from 11.9 to 38.4 percent, but all but two insurers were between 23.2 and 29.1 percent, varying based on factors such as age distribution, distribution system, market, underwriting requirements, and underwriting standards. Our placed percentages reflect the insurers’ perspective. A higher percentage of applicants secures coverage because applicants denied by one carrier may be issued either stand-alone or combo coverage by another carrier or may receive coverage with the same insurer after a deferral period.
Table 24 shows that, compared to 2019, the placement rate increased below age 60 and decreased above age 60, which seems consistent with a theory that the lower placement rate was related to the pandemic. This data is a subset of the placement data in Table 23.
Low placement rates increase insurers’ cost per placed policy. More importantly, low placement rates discourage advisors from discussing LTCI with clients. In addition to not wanting to waste time and effort, advisors fear that declined clients will be dissatisfied. In the Market Perspective section, we listed ways to improve placement rates. This is a critical issue for the industry. If readers have suggestions, they are invited to contact the authors.
Underwriting Tools Six insurers contributed data to Table 25, which divides the number of uses of each underwriting tool by the number of applications processed. For example, the number of medical records was 82 percent of the number of applications. That does not mean that 82 percent of the applications involved medical records, because some applications resulted in more than one set of medical records being requested.
Insurers are trying to speed underwriting to increase placement rates. In the worksite market, insurers are less likely to use some of these tools.
Year-to-year changes in distribution of sales among insurers significantly impact results. Lower maximum ages result in fewer face-to-face exams. Insurers might underreport the use of an underwriting tool because they may lack a good source for that statistic. For example, an insurer might not be able to split phone interviews by whether or not they include cognitive testing.
The biggest change was the drop in Face-to-Face assessments, perhaps because it was hard to schedule them due to the pandemic.
Underwriting Time Table 26 shows the average processing from receipt of application to mailing the policy time (40 days) reversed the trend of speedier processing. Of the six insurers that reported this data in both 2019 and 2020, the three fastest processors of 2019 all got faster and the three slower processors of 2019 all got slower, expanding the range from 28.9-60.3 to 26.9-65.9.
Rating Classification Table 27 shows that a lower percentage of policies was issued in the most favorable rating classification, but the highest percentage was placed in the two most favorable classes since 2012. That’s surprising because prior to 2016, we had more worksite business in the rating classification table. For more information, look for the August issue of Broker World magazine where we will separate data by worksite vs. non-worksite business.
Only 7.7 percent of policies were issued beyond the second-best classification, but three insurers placed 11.0 to 12.4 percent of policies in such a class and another insurer placed 19.2 percent of policies in such a class.
Two insurers placed more than 80 percent of their applicants in the best underwriting class. The other five insurers placed 19 to 25 percent in their best class.
Lastly, Table 27 shows the percentage of decisions which were either declined or placed in the 3rd or less-attractive classification is reducing. Hence, we conclude that industry is making more favorable decisions rather than declining applicants in lieu of giving them a substandard rating,
Tables 28 and 29 show the 2020 percentages of policies issued in the most favorable category and decline decisions by issue age. Tables 27 and 28 do not exactly match Table 26 because some participants provide all-age rating or decline data. The percentage placed in the most favorable classification increased for ages 65 and older, likely statistical fluctuation. Although overall decline rates increased, the by-age decline rates decreased, except for under age 30; that anomaly results because only some insurers can provide decline data by issue age.
CLOSING We thank insurance company staff for submitting the data and responding to questions promptly. We also thank Sophia Fosdick, Margaret Liang, Nicole Gaspar, and Alex Geanous of Milliman for managing the data expertly.
We reviewed data for reasonableness and insurers reviewed their product exhibit displays. Nonetheless, we cannot assure that all data is accurate.
If you have suggestions for improving this survey (including new entrants in the market), please contact one of the authors.
The 2020 Milliman Long Term Care Insurance Survey, published in the July issue, was the 22nd consecutive annual review of long term care insurance (LTCI) published by Broker World magazine. It analyzed individual product sales and Genworth group sales, reporting sales distributions and detailed insurer and product characteristics.
From 2006-2009, Broker World published separate group LTCI surveys, but discontinued those surveys when the availability of group LTCI policies shrank. In 2011, Broker World began annual analysis of worksite sales of individual products in August to complement the July overall market analysis.
The worksite market consists of individual policies and group certificates (“policies” henceforth) sold with employer support, such as permitting on-site solicitation and/or paying or collecting premiums. If a business owner buys an individual policy and pays for it through her/his business, some participants may report such policies as “worksite” policies while others might not if it was not processed as a worksite group. If a business sponsors general LTC/LTCI educational meetings, with employees pursuing any interest in LTCI off-site, such sales are not counted here as WS sales.
We limit our analysis to U.S. sales and exclude “combination” products except where specifically indicated. (Combination products pay meaningful life insurance, annuity, or disability income benefits in addition to LTCI.)
About the Survey Our survey includes worksite (WS) sales and statistical distributions from MassMutual, National Guardian Life, New York Life, and Northwestern, and worksite sales data from Genworth, LifeSecure and Transamerica. We compare WS sales to individual LTCI policies that are not worksite policies (NWS) and to total sales (Total).
The July issue also included sales of the California Public Employees Retirement System (CalPERS) program. CalPERS eligibility is based California public employment, but the program operates more like an affinity group than a worksite group, so it was counted as affinity sales in July and is not included as a worksite product in this article.
Ten percent of single premiums are included as annualized premiums.
Highlights from This Year’s Survey
Participants reported 2019 WS sales of 11,483 policies (21.0 percent of total sales) for $22.85 million (13.4 percent of new annualized premium). The premium includes 2019 future purchase options exercised on policies issued in the past.
In 2019, WS sales rebounded from the 2018 results we reported last year. The three insurers which are most focused on voluntary worksite LTCI programs all had sales increases of between 62 and 76 percent in 2019, despite increased competition from a new entrant and from life insurance LTCI linked-benefit programs.
Our worksite sales total includes nearly 100 percent of the stand-alone WS LTCI market, but our statistical distributions reflect only about 12 percent of worksite policies sold (28 percent of premium). Our worksite statistical distributions can vary significantly from year-to-year because insurers focusing on particular worksite markets may be over- or under-represented. Last year, we commented that the worksite business in our statistical analysis was overly weighted toward executive carve-out programs. This year that imbalance has increased. The carriers that provided 2019 statistical data had an average worksite annual premium of $4,568 whereas the ones that provided only total sales had an average worksite premium of $1,627. The corresponding 2018 averages were $2,015 and $1,561. In 2017, the difference was in the other direction ($1,015 vs. $1,441).
MARKET PERSPECTIVE The three segments of the worksite market (which may apply to different employee classes in a single case):
In “core” (also known as “core/buy-up”) programs, employers pay for a small amount of coverage for generally a large number of employees; the employees can buy more coverage. “Core” programs generally have lower average ages, short benefit periods, low daily maximum benefits and a small percentage of spouses insured.
In “carve-out” programs, employers pay for robust coverage for generally a small number of executives and usually their spouses. Generally, employees can buy more coverage for themselves or spouses. Compared to “core” programs, a higher percentage of insureds are married, more spouses buy coverage and the age distribution is older.
In “voluntary” programs, employers pay nothing toward the cost of coverage. Coverage is more robust than “core” programs, but less robust than “carve-out” programs. Voluntary programs tend to be most weighted toward female purchasers.
MassMutual, National Guardian, New York Life and Northwestern write mostly executive carve-out programs, whereas Genworth, Transamerica and LifeSecure business includes significant voluntary and core buy-up business as well. Because the insurers that write mostly executive carve-out business provided statistical data this year and the other insurers provided only total sales, our statistical distributions are more representative of the executive carve-out subset of the market than all types of worksite sales.
Insurer Challenges in the Worksite Market COVID-19: In 2020, worksite insurers, like most businesses, experienced challenges due to the COVID-19 pandemic. Most scheduled enrollments were canceled or delayed. Enrollments of newly-eligible employees continued, being done in web meetings. As a result, we expect 2020 worksite (and individual) LTCI sales to be lower than 2019.
We suspect 2021 will remain suppressed because a lot of new 2021 sales would typically be enrolled in the 4th quarter of 2020. Even if the worksite LTCI market were to bounce back quickly, we anticipate that a lot of 2021 activity would produce 2022 sales. Moreover, potential unemployment and reduced profitability (due to reduced sales and increased expenses) may blunt enthusiasm for new employee benefit programs. Employers may focus instead on protecting employees and clients from communicable diseases by testing and providing protective equipment to employees and clients. More comments about the impact of COVID-19 on the LTCI market were published on the Broker World Magazine website as part of our July analysis.
Pricing considerations: Most people interpret Title VII of the 1964 Civil Rights Act to require that employer-involved LTCI programs use unisex pricing if the employer has had at least 15 employees for at least 20 weeks either in the current or previous year. Thus, to sell at the WS, insurers must create a separate unisex-priced product. The expense of separate pricing, marketing and administration discourages insurers from serving both the WS and NWS markets.
Because healthy, young, and less affluent people are less likely to buy, insurers and enrollers fear health anti-selection (less-healthy people buying, while healthier people do not buy). Health concessions can exacerbate this risk, hence are less common and generous than in the past. There is no “guaranteed issue” stand-alone LTCI coverage; however, some combination products offer some guaranteed issue with adequate WS participation.
WS programs rarely offer “preferred health” discounts; insurers may not get enough health information to grant such a discount. Thus, heterosexual couples might pay more for a WS policy than a corresponding NWS policy, if the male spouse is older or buys more coverage and/or one or both spouses would qualify for a “preferred health” discount in the NWS market. In the carve-out market, a costlier LTCI product can still produce savings on an after-tax basis, because of the tax advantages when employers pay the premium.
Females get a good deal in a WS program compared to NWS pricing, but males pay more in the WS. Insurers fear that most worksite buyers might be female, hurting WS profitability. To the degree that sales skew to females, unisex pricing must approach sex-distinct female pricing (because females have higher expected future claims).
In addition to health and gender distribution, insurers are also careful about age and income distributions of WS cases they accept. Younger and less affluent people are less likely to buy LTCI, so insurers are more vulnerable to health- or gender-anti-selection if the group has a lot of young or less affluent employees.
Some insurers have raised their minimum issue age to avoid anti-selection (few people buy below age 40) and to reduce exposure to extremely long claims. Such age restrictions can discourage employers from introducing a program, especially a carve-out program if they have executives or spouses under age 40.
To control risk, most insurers will not accept a voluntary WS program if there are fewer than 100 employees. However, one insurer (which offers no health concessions) will accept voluntary LTCI programs with as few as two to five employees buying (minimum varies by jurisdiction).
Availability of coverage: With increased remote work, more employers have employees stretched across multiple jurisdictions and eligible non-household relatives might live anywhere. But insurers are less likely than in the past to offer LTCI in jurisdictions with difficult laws, regulations or practices. So, it can be difficult to find an insurer which can cover everyone unless LTCI is sold on a group chassis and the employer does not have individuals in extra-territorial states.
One WS insurer no longer offers WS LTCI to non-household relatives. Reduced availability for such relatives does not have much impact on sales, because few non-household relatives buy WS LTCI. However, it undermines the suggestion that WS LTCI programs might reduce the negative impact of employees being caregivers.
Prior to sex-distinct pricing, an executive carve-out for two partners of a company with more than 15 employees could have been serviced by any LTCI company, but now it is hard to find a carrier that will offer unisex pricing under such circumstances. Such executives may buy policies with sex-distinct pricing either because they are unaware of the requirement under Title VII of 1964 Civil Rights Act, they are confident that no female will file a civil rights complaint, or they disagree with the interpretation that such policies should have unisex pricing to avoid the risk of a civil rights complaint.
Some employee benefit brokers are reluctant to embrace LTCI because of declinations, the enrollment effort, certification requirements, their personal lack of expertise, etc. Increased WS sales are likely to depend upon LTCI specialists forming relationships with employee benefit brokers.
The Tax Cuts and Jobs Act of 2017 reduced the tax savings for C-Corporations buying LTCI for their employees and employees’ life partners. Pass-through entities may be the more attractive market now. Although the eligible premium is capped in a pass-through entity, a much higher marginal tax rate might apply than for a C-Corporation.
Voluntary worksite LTCI sales lack the tax advantages of employer-paid coverage. Therefore, voluntary programs for young and less-affluent groups may gravitate toward combo products as they include life insurance that is viewed as a more immediate potential need by young employees with families.
The worksite is a great venue to serve people who can benefit from the state Partnership programs (described in the Partnership section). In 2019, 30.5 percent of WS qualified for Partnership programs compared to only 10.3 percent in 2018. However, the increase is at least partly because executive carve-out sales dominate our statistical distributions. As executives are less likely to benefit from Partnership programs the increase may not be meaningful. Core/buy-up programs rarely include compounded benefits and employees often are not willing to pay for the compounding necessary to qualify for the Partnership program.
Regulators have “stepped up,” as 26 jurisdictions now accept policies issued at any age to qualify as Partnership policies even if maximum benefits compound by only one percent. The inclusion of one percent compounding at all ages can make core and voluntary WS programs more attractive. There is a potential market opportunity for an insurer willing to allow a lower minimum monthly maximum for core/buy-up programs with one percent compounding. Four other states permit one percent but only for ages 61+.
The worksite market should be poised for growth given the acceptance of one percent compounding benefits, Partnership qualification, attractive tax breaks, challenged government budgets, advantages over life/LTCI linked benefits (that lack Partnership and tax advantages), and a growing need for LTC insurance coverage. However, employers perceive that offering LTCI to their employees has little value for the employer. By the time the employee or spouse needs LTC, the employee will likely have terminated employment. Employee benefit brokers can help employers more effectively by expanding existing services that reduce the likelihood that employees’ elders will need LTC, which may make LTC more effective, more efficient, safer and less expensive. Enabling employees and their families to have better LTC experiences and to use more (not necessarily 100 percent) commercial care should boost productivity at work.
STATISTICAL ANALYSIS As mentioned earlier, insurers’ sales distributions can vary greatly based on the submarket they serve (for example, in the WS market: core, voluntary or carve-out). Therefore, distributions may vary significantly from year to year due to a change in participating insurers, in distribution within an insurer or in market share among insurers. Our sales distributions reflect only about 12 percent of worksite policies and certificates issued in 2019 and are mostly representative of the executive carve-out market. For example, two insurers provided data regarding the number of worksite cases they opened up. Their combined average size was only three policies per worksite. Policies in the carve-out market are designed similarly to those in the NWS (non-worksite) market.
Sales and Market Share Table 1 shows historical WS sales for all insurers reporting sales. The WS market increased in 2019 relative to 2018 but did not reach the level of sales experienced in 2016-2017. As noted earlier, the three carriers specializing in voluntary sales all had increases between 62-76 percent in 2019.
Lower sales in 2018 appears to be mostly attributable to a significant player temporarily leaving the market that year. Its competitors did not seem to get additional 2018 sales in that carrier’s absence, but their sales grew significantly in 2019. As voluntary worksite cases have a meaningful gestation period and are often enrolled late in the year with effective dates early in the next year, there may be a lag before competitors can fill in after an insurer drops out.
Table 1 also shows the overall average worksite premium compared to the average worksite premium for the participants who contributed statistical data beyond sales. As shown in the table, worksite statistics likely represented the broad worksite market well through 2016. However, beginning in 2017, our worksite distributions reflected sales that were not representative of the whole worksite market.
Table 2 shows the above WS sales as a percentage of total LTCI sales. For the most part, this percentage has stayed relatively level in the past four years and much higher than prior to 2016.
As shown in Table 3, three insurers wrote 60 percent or more of their 2019 new premium in the worksite, while the other insurers wrote ten percent or less of their business in that market. The percentage of each insurer’s new premium that comes from WS sales did not change dramatically from 2018 to 2019.
Average Premium Per Buyer Table 4 shows that, in 2019, the NWS average premium per buying unit (a couple comprise a single buying unit) was 41.1 percent higher than the average premium per insured. This dropped to 31.5 percent in the worksite, because more buyers in the worksite are single and because spouses are less likely to buy in the worksite. These numbers reflect all participants, but the ratio of buying unit to insured unit is determined solely by the participants who are able to report sales based on marital status. The worksite ratio is probably somewhat overstated because the participants who reported premium by marital status for the worksite were not characteristic of the entire market.
Issue Age The balance of the statistical presentations is non-representative of the entire worksite market. We report the results we have available, though we urge you to be selective in how you use the data. Not surprising, Table 5 shows the WS market is much more weighted to the younger ages, even with data that is disproportionately weighted to executive carve-out programs. However that data bias seems to have reduced the difference between average age inside and outside the WS market.
Table 7 displays the relative age distribution of the population compared to purchasers in the NWS and WS markets.
Rating Classification Most WS sales are in the “best” underwriting class (see Table 8) because there generally is only one underwriting class. Insurers often do not get enough information in WS to determine whether a “preferred health” discount could be granted and use the additional revenue (from not having a “preferred health” discount) to fund extra cost resulting from health concessions. Carve-out programs are more likely to offer a “preferred” discount, which means a higher percentage of carve-out policies are issued in the second-best underwriting class.
Benefit Period Originally, the WS average benefit period was lower than the individual market average benefit period. The relative benefit periods have come closer together over time because the average benefit period in the NWS market has dropped. The executive carve-out portion of the WS market seems to have dropped to a lesser degree. This year, many short benefit period WS sales are not reflected, resulting in the WS average benefit period being essentially identical to the NWS market. Table 10 shows similar results in the 2013-2016 era. As noted elsewhere, this data can jump around based on which insurers provide such detail and also based upon whether some large core/buy-up cases are written in a particular year.
As discussed later, the WS market issues much less Shared Care, so the NWS market is still generally buying longer coverage.
Maximum Monthly Benefit Even with a lot of executive carve-out business, Table 11 shows that the WS market has significantly more coverages that are less than $100/day (and also less than $3000/month). Many core programs are sold with a $50/day or $1500/month initial maximum benefit. Table 12 shows that the WS initial monthly maximum has varied more over time than the whole market, because of participant changes and how many core/buy-up plans were sold in a particular year.
Benefit Increase Features As shown in Table 13, the WS market has more future purchase options (FPO), because of its core programs.
Future Protection Based on a $23/hour cost for non-professional personal care at home ($23 is the median cost according to Genworth’s 2019 study), the average WS initial maximum daily benefit of $156.47 would cover 6.8 hours of care per day at issue, whereas the typical NWS initial daily maximum of $162.94 would cover 7.1 hours of care per day, as shown in Table 14.
The number of future home care hours that could be covered depends upon when care is needed (we have assumed age 80), the home care cost inflation rate between now (age 45 for WS and 58 for NWS) and age 80 (we have calculated with two, three, four, five and six percent inflation), and the benefit increases provided by the LTCI coverage between now and age 80.
Table 14 shows calculations for 3 different assumptions relative to benefit increase features:
The first line presumes that no benefit increases occur (either sold without any benefit increase feature or no FPOs were exercised).
The second line reflects the average benefit increase design using the methodology reported in the July article, except it assumes that 40 percent of FPOs are elected (intended to be indicative of “positive” election FPOs, in which the increase occurs only if the client elects it) and provide five percent compounding.
The third line is like the second line except it assumes 90 percent of FPOs are elected (intended to be indicative of “negative” election FPOs, in which the increase occurs unless the client rejects it).
Table 14 indicates that:
Without benefit increases, purchasing power deteriorates significantly, particularly for the worksite purchaser because there are more years of future inflation for a younger buyer.
The “composite” (average) benefit increase design assuming that 40 percent of FPO offers are exercised preserves purchasing power better than when no increase are assumed, but still generally leads to significant loss of purchasing power. The exceptions: both WS and NWS clients gain a bit of purchasing power if the inflation rate is only two percent (the composite with a 40 percent FPO election rate is equivalent to a bit more than two percent compounding). With three percent inflation, the loss in purchasing power is a bit less than ten percent.
With 90 percent FPO election rates, insured people retain more purchasing power compared to no increases or 40 percent election rates. The average WS buyer would experience increased purchasing power if inflation averages less than 3.9 percent, but would lose purchasing power if inflation exceeds 3.9 percent. The average NWS buyer would experience increased purchasing power if inflation average less than 3.25 percent but would lose purchasing power if inflation exceeds 3.25 percent.
Table 14 underscores the importance of considering future purchasing power when buying LTCI. Please note:
a) The average WS buyer was 13 years younger, hence has 16 more years of inflation and benefit increases in the table. The effective inflation rate to age 80 is not likely to be the same for 45-year-olds versus 58-year-olds purchasing today.
b) WS sales have less automatic compounding and more FPOs, so WS results are more sensitive to FPO election rates.
c) Results vary significantly based on an insured’s issue age, initial maximum daily benefit, and benefit increase feature, as well as the inflation rate and the age at which the need for care occurs.
d) By the median age of starting to need care (about age 83) and the median age of needing care (about age 85), more purchasing power would be lost.
e) Table 14 does not reflect the cost of professional home care or a facility. According to the aforementioned 2019 Genworth study, the average nursing home private room cost is $280/day, which is currently comparable to 12.2 hours of non-professional home care. However, the inflation rate for facility costs is likely to differ from the inflation rate for home care. From 2004-2019, Genworth’s studies showed the following compound growth rates: Private room in a nursing home (3.1 percent), an ALF (3.6 percent), home health aide (1.7 percent), and home care homemaker (2.1 percent).
f) Table 14 could be distorted by simplifications in our calculations. For example, we assumed that the FPO election rate does not vary by age, size of policy or market and that everyone buys a home care benefit equal to the average facility benefit.
Partnership Program Background When someone applies to Medicaid for long term care services, most states with Partnership programs disregard assets up to the amount of benefits received from a Partnership-qualified policy (some Indiana and New York policies disregard all assets). Partnership sales were reported in 43 jurisdictions in 2019, all but California (no participants offer California Partnership policies) and Alaska, District of Columbia, Hawaii, Massachusetts, Mississippi, Utah, and Vermont, where Partnership programs do not exist. Massachusetts has a somewhat similar program (MassHealth).
To qualify for a state Partnership program, a policy must have a sufficiently robust benefit increase feature, the requirement varying by issue age and jurisdiction. Historically, a level premium with permanent annual three percent or higher compound increases or an otherwise similar consumer price index (CPI) increase was required for ages 60 or less. For ages 61 to 75, five percent simple increases also qualified, and for ages 76 or older, policies qualified without regard to the benefit increase feature. As noted, many states now confer Partnership status with compounding as low as one percent. Two insurers offer one percent compounding in worksite products.
The WS venue provides an efficient opportunity to serve less-affluent employees and relatives who would most benefit from Partnership qualification. However, only 30.5 percent of WS sales in 2019 qualified for Partnership programs and most of those policies were probably executive carve-out programs. If additional states permit one percent compounding and if insurers design products to offer one percent compounding, the percentage of Partnership policies sold in the WS market is likely to grow.
Jurisdictional Distribution On the Broker World website, you can find a chart of the market share of each US jurisdiction relative to the total, WS and NWS markets, split by Partnership combined with non-Partnership policies and separately solely Partnership policies. This chart indicates where relative opportunity may exist to grow LTCI sales.
Elimination Period About 90 percent of the NWS market buys 90-day elimination periods (EPs). For that reason, most WS programs offer only a 90-day EP. The WS 90-day EP percentage of 89.7 percent shown below is understated because we lacked data for some participants which are almost entirely 90-day EP.
Table 15 also shows how many policies had a 0-day home care feature and a longer facility EP and how many policies had a calendar-day EP (as opposed to a service-day EP). We have reflected that all LifeSecure policies are 90-day EP with a calendar-day definition and that all Transamerica sales have zero-day home care EP. Policies which have zero-day home care EP, but define their EP as a service-day EP operate almost identically to a calendar-day EP. The significant differences in zero-day home care EP and in calendar-day EP by market are reflective of specific insurers’ design preference; they do not appear to be driven by the market.
Gender Distribution and Sales to Couples and Relatives In 2013, insurers started to use sex-distinct pricing, but, as explained, that change has not extended to the worksite market.
The 2012 NWS percentage of female sales in Table 16 reflects a relatively high percentage of female sales in 2012 due to recognition that sex-distinct pricing would occur in 2013. The 2013-2015 percentages of females in the NWS market remained high as insurers which still offered unisex pricing attracted single females.
In the past four years, the percentage of female buyers in the NWS has been stable, fluctuating from 54.3 to 54.9 percent.
Until 2019, the percentage of WS buyers who are female had increased since insurers started using sex-distinct pricing in the NWS market. Perhaps the biggest reason is that women are more interested in LTCI, perhaps especially so in the worksite market because of the WS unisex pricing. Furthermore, the percentage of workers who are female was probably increasing as was the percentage of females among executives (hence included in executive carve-out programs). We noted last year that women constituted 51.2 percent of the U.S.A age 20-79 population in 2018,* but only 46.8 percent of the workers,* which underscores the significance of a higher female percentage of sales in the worksite.
In 2019, the percentage of female sales in the worksite dropped to 51.7 percent from 57.7 percent in 2018. Of this 6.0 percent arithmetic drop, only 0.6 percent was attributable to different insurers providing data in 2019 compared to 2018. The bulk of the difference is attributable to a drop in female sales for a major insurer. *Bureau of Labor Statistics, https://www.bls.gov/cps/demographics.htm
Table 17 digs deeper, exploring the differences between the WS and NWS markets in single female, couples and Shared Care sales. It shows that the decrease in female sales at the worksite was primarily among single people.
Couples who both buy are less likely to purchase Shared Care in the WS market than in the NWS market, because Shared Care is less commonly offered in the WS market and because executive carve-out programs often do not include Shared Care. The bottom row of Table 17 adjusts for insurers not offering Shared Care in the WS market, but does not adjust for advisors and employers choosing not to offer it or not to pay for it. (Married executives generally benefit more from executive carve-out LTCI programs than do single executives, because the employer typically pays for the spouse. Employers may shy away from paying for Shared Care because it would favor married executives even more.)
Type of Home Care Coverage Table 18 summarizes sales by type of home care coverage. Historically, the WS market sold few policies with a home care maximum equal to the facility maximum. But with increasing emphasis on home care and simplicity, that difference faded. The increase in the percentage of WS policies with a maximum home care benefit equal to the nursing home maximum (81.7 percent in 2018 vs. 93.9 percent in 2019) is attributable to a change in participants. Table 18 also shows that monthly determination dominates the NWS market, but daily determination still dominates the WS market, albeit less so in the executive carve-out market.
Many worksite products embed a “partial cash alternative” feature (which allow claimants, in lieu of any other benefit that month, to use approximately one-third of their benefit for whatever purpose they wish, with the balance extending the benefit period) or a small informal care benefit.
Other Features Table 19 suggests that Return of Premium (ROP) became more common in the WS market and that a lot more of the WS ROP coverages were permanent; however, if the data is limited to participants that provided data each year, the frequency of ROP would have been unchanged and the percentage that were permanent would have actually decreased. ROP was less common in the NWS market in 2019 than in 2018. ROP with expiring death benefits can provide an inexpensive way to encourage more young people to buy LTCI but may not provide a meaningful benefit.
Table 20 shows little change in the sales of Joint Waiver of Premium and Survivorship to couples, but that Restoration of Benefits (ROB) appears to have been sold more often in the WS in 2019. The increase in WS ROB sales is more than explained by a change in participants. All WS sales are tax-qualified.
CLOSING We thank insurance company staff for submitting the data and responding to questions promptly. We also thank Nicole Gaspar, Alex Geanous and Anders Hendrickson of Milliman for managing the data expertly.
We reviewed data for reasonableness. Nonetheless, we cannot assure that all data is accurate.
If you have suggestions for improving this survey, please contact one of the authors.