The 2023 Milliman Long Term Care Insurance Survey is the 25th consecutive annual review of stand-alone long-term care insurance (LTCI) published by Broker World magazine. It analyzes the marketplace, reports sales distributions, and describes available products.
More discussion of worksite sales, including a comparison of worksite sales distributions vs. non-worksite sales distributions will be in Broker World magazine’s August issue.
Unless otherwise indicated, references are solely to U.S. stand-alone LTCI sales, excluding exercised future purchase options (FPOs) or other changes to existing coverage. “Stand-alone” refers to LTCI policies that do not include death benefits (other than returning premiums upon death or waiving a surviving spouse’s premiums) or annuity or disability income benefits. Where referenced, “combo” or “combination” products provide LTCI combined with life insurance or annuity coverage. “Linked benefit” policies are combo policies which can allow more than the death benefit or annuity account value to be used as LTCI.
All references to sales in terms of “premium” refer to “annualized” premium (1 x annual; 2 x semi-annual; 4 x quarterly; 12 x monthly), even if only one monthly premium was received before year-end. All references to “Washington” or “WA” refer to the state of Washington. “WCF” refers to the “WA Cares Fund,” explained in the Market Perspective section.
Highlights from this year’s survey
As reported last year, the WCF stimulated tremendous market demand in the state of Washington, causing sales distributions to vary greatly from recent history. Although the industry largely stopped accepting Washington applications in August 2021, a backlog resulted in some policies being issued in 2022. To get a better understanding of the impact of the backlog, we asked insurers to reclassify 2022 sales to 2021 if they were issued in 2022 due to the unusual lag. For the purpose of compiling results for this article, figures that display industry sales levels reflect our adjustments because of the backlog. However, all insurer-specific sales data ignores any backlog adjustment. In the sales distributions section of our report, some insurers’ data reflect the sales backlog (i.e., 2021 sales that lagged into 2022) while other insurers were able to remove them. For that reason, we generally anticipate that 2022 sales distributions are likely to differ from 2023 sales distributions.
Participants
Seven insurers (Bankers Life, Knights of Columbus, Mutual of Omaha, National Guardian Life, New York Life, Northwestern, and Thrivent) contributed broadly to stand-alone sales distributions reported herein. Total 2022 sales data includes one additional insurer and 2022 inforce data includes two additional organizations.
Our worksite sales distributions do not reflect low-price worksite programs; however, the gap in average premiums was smaller than usual. Carriers that provided 2022 distributions had an average worksite annual premium of $2,565, whereas the insurers that provided sales, but not distributions, had an average worksite premium of $1,876 annually.
In 2021, we collected data on combination sales (life insurance with LTCI or Chronic Illness benefits) for the first time to evaluate the impact of the WCF exemption on sales. This year, we did so again. The following eleven insurers contributed to our combination sales data: AFLAC, John Hancock, Mass Mutual, New York Life, Nationwide, Northwestern Mutual (Northwestern), OneAmerica, Pacific Life (2021 data only), Securian, Trustmark and United of Omaha.
Sales Summary
- We estimate total stand-alone LTCI annualized new premium sales of nearly $124 million in 2022 (including exercised FPOs except FPOs for insurers no longer selling LTCI and counting 10 percent of single premium), compared to $200 million in 2021 (same basis). The 2021 sales are influenced by the higher Washington sales and include estimated sales for one insurer for which we did not estimate sales this year. In addition, there was a $7 million drop in 2022 in new premium from FPOs.
- Outside-of-Washington sales trends are likely to be more reflective of the future. Our participants’ outside-of-Washington 2022 premium (including FPOs) was eight percent higher than their outside-of-Washington 2021 new premium. However, compared to 2020 sales including insurers which have left the market, the sales dropped 23 percent. The continuing insurers have been able to maintain their own sales levels (2022 premium was 99 percent of 2020) but not replace the sales of departing insurers. On a lives basis, the 2022 sales data was roughly 88 percent of 2020 for continuing insurers (versus the 99 percent on a premium basis), reflective of the higher prices of today’s stand-alone LTCI policies.
- Worksite sales receded significantly from their higher, Washington-impacted 2021 sales. All participants reported worksite sales of 2,213 lives and $8.7 million in premium, compared to pandemic-influenced 2020 sales of 2,124 lives and $7.2 million of premium. Transamerica, which produced more 2020 worksite sales than all our participants combined, stopped selling in the first half of 2021, depressing product availability, and is not included in the sales in this paragraph. Thus, our participants did not absorb Transamerica’s share of the worksite market.
- Northwestern led in annualized new premium including FPO elections, selling 13 percent more than the #2 and #3 insurers combined (Mutual of Omaha and New York Life). Northwestern edged ahead of Mutual of Omaha in annualized premium from new policies although Mutual of Omaha still sold more new policies.
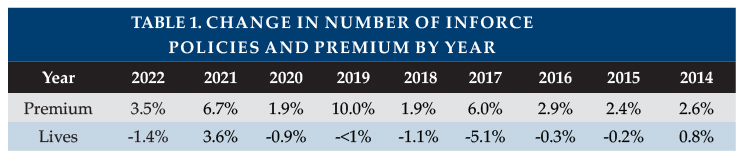
Reflecting nine entities’ data, the inforce number of cases dropped 1.4 percent while annualized premium increased 3.5 percent. Inforce premium rises due to sales, price increases, and benefit increases (including FPOs), and falls from lapses, reductions in coverage, deaths, and shifts to paid-up status. The number of people with stand-alone coverage increased through 2014, but, as shown in Table 1, has decreased annually since then except for the 2021 aberration. However, the inforce premium has increased each year because of inforce price increases and higher prices for new policies.
Collectively, eight participants paid five percent more in claims in 2022 than in 2021. Overall, the stand-alone LTCI industry incurred $13.6 billion in claims in 2021 based on companies’ statutory annual filings, a 5.4 percent increase over 2020, which raises the running total of incurred claims since 1991 to $180.9 billion (2021 claims of $13.6 billion plus total of $167.3 billion from our prior year’s article). Most of these claims were incurred by insurers that no longer sell LTCI.
About the Survey
This article is arranged in the following sections:
- Highlights provides a high-level view of results.
- Market Perspective provides insights into the LTCI market.
- Claims presents industry-level claims data.
- Sales Statistical Analysis presents industry-level sales distributions reflecting data from 8 insurers.
- Partnership Programs discusses the impact of the state partnerships for LTCI.
ONLY AVAILABLE AT WWW.BROKERWORLDMAG.COM:
- Product Exhibit shows, for 6 insurers: financial ratings, LTCI sales and inforce policies, and product details.
- Product Exhibit Details, a row-by-row definition of the product exhibit entries, with some commentary.
- Premium Exhibit shows lifetime annual premiums for each insurer’s most common underwriting class, for issue ages 40, 50, 60, and 70 for single females, single males, and female/male couples (assuming both buy at the same age), based on $100 per day (or closest equivalent weekly or monthly) benefit, 90-day facility and most common home care elimination period, three-year and five-year benefit periods or $100,000 and $200,000 maximum lifetime buckets, with and without Shared Care and with flat benefits or automatic three or five percent annual compound benefit increases for life. Worksite premiums do not reflect any worksite-specific discount, though some carriers offer this.
- Premium Adjustments (from our Premium Exhibit prices) by underwriting class for each participant.
- Distribution by underwriting class for each participant. Depending upon the product shown for an insurer in the Product Exhibit, we sometimes adjust that insurer’s underwriting distribution to provide readers a better expectation of likely results if they submit an application in the coming year and to line up with the prices we display. For example, if the Product Exhibit shows only a new product which has only one underwriting class (hence one price), but the insurer’s data partly or solely reflect an older product with three underwriting classifications, we might choose to show “100 percent” in their best (only) underwriting class.
- State-by-state results show the percentage of sales by state, average premium by state and percentage of policies qualifying for Partnership by state.
MARKET PERSPECTIVE (more detail in subsequent parts of the article)
Washington State’s “Washington Cares Fund” (WCF) stimulated tremendous demand for private LTCI from individuals and businesses in Washington in 2021. WCF imposes a 0.58 percent payroll tax to fund a $36,500 lifetime pool (intended to inflate according to the Washington consumer price index) for care, as defined in the Revised Code of Washington 50B.04, received in Washington. People who purchased private stand-alone or combination LTCI by November 1, 2021 could file to be exempt from the tax. WCF received approximately 484,000 applications for exemption.1
Partly because the tax applies to all earned income, 2021 LTCI sales in Washington soared to unprecedented levels. Insurers quickly became backlogged with applications and were concerned about early lapses as the law provided a permanent WCF exemption based on only a one-time attestation. Insurers reduced design flexibility, and then discontinued sales in Washington before the November 1 deadline.
(Note: The WCF continues to contemplate further program changes. In particular, a future change may require retention of private LTCI coverage to maintain exemption from the WCF tax and some care outside of Washington might be covered.)
Last year, we estimated that Washington accounted for 75 percent of stand-alone LTCI policies sold in 2021. Of combination life/LTCI business with on-going premium (i.e., excluding single premium), we estimate Washington accounted for 60 percent of policies sold in 2021 but only 20 percent of premium. This year, even after adjusting with data from the NAIC and removing FPOs, the stand-alone policy percentage remains 75 percent. As shown in Table 3, the percentage of 2021 combo policies sold in WA is revised from 60 to 54 percent because we added a carrier with a relatively small percentage of its business in Washington.
Washington continued to account for a high percentage of business issued in 2022 because of delayed processing of third quarter 2021 applications. With participants’ help, we moved 76 percent of 2022 WA stand-alone policies issued (33 percent of premium) and 66 percent of 2022 WA combo policies (26 percent of premium) to 2021. Moving these policies increased 2021 Washington sales only by five percent (4 percent of premium).
(Note: Washington’s share on stand-alone LTCI premiums is generally a bit lower than its share by policy count. We believe that is partly because some insurers have higher prices in other states such as CA, FL, and NY.)
Table 2 reveals that the WCF exemption seems to have stimulated additional sales beginning in 2020, boosting Washington’s market share of stand-alone policies to three percent in 2020 compared to a steady 2.4 to 2.5 percent prior to 2020. Washington’s market share in 2022 returned close to pre-2021 levels on an adjusted basis, both with and without adjusting for the mix of insurers across years. This suggests that our adjusted Washington 2022 market share is at most slightly influenced by the WCF exemption, but we will continue to monitor in future surveys.
Last year, we reported that insurers (including estimates for insurers which did not report sales) sold 90 times as many stand-alone LTCI coverages in Washington in 2021 as in 2020. After reflecting re-classification from 2022 and reviewing the 2020 and 2021 NAIC LTCI Experience Reports, we conclude that the 2021 number of Washington stand-alone LTCI sales remained approximately 90 times 2020 Washington sales. The ratio varies significantly between the worksite (483) and individual markets (26).
Last year, we reported that Life/LTCI combo insurers also sold more than 90 times as many coverages in Washington in 2021 as in 2020. This year’s updated calculation found a similar 89 times the 2020 total. The ratio varies significantly between worksite (578) and individual insurers (21).
Combining both stand-alone and combo polices, 90 times as many coverages were sold in Washington in 2021 as in 2020 but only 12 times as much premium.
Compared to 2020, the 2022 number of Life/LTCi sales in Washington is high but the 2022 premium is low, suggesting that we did not reclassify all of the lag.
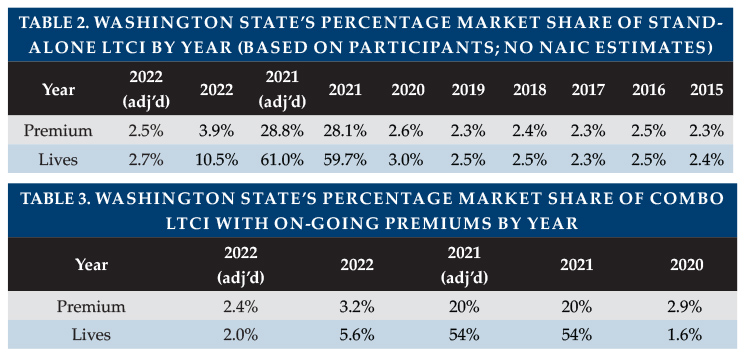
In its 2022 report (“The WA Cares Act: Impact on Long Term Care and Hybrid Life Sales”), LIMRA reported the following third- and fourth-quarter increases in WA production in 2021 compared to the same period the previous year.
As dramatic as the LIMRA data is, our data shows much larger increases in Washington sales in 2021. The difference is primarily attributable to our inclusion of insurers focused on the worksite market (including group insurance). There was a huge demand for LTCi-related programs from Washington’s employers. A second, much smaller reason is our re-characterization of delayed sales back to 2021.
Idaho and Oregon also were impacted by the WCF exemption. Because WCF has been amended to allow out-of-state residents who work in Washington to be exempt, those sales may be at higher risk of lapsing as out-of-state residents no longer need to have a qualifying LTCI policy to be exempt. Table 5 shows Idaho and Oregon market share for the past several years. Our Idaho data shows a doubling of sales in 2021, but nearly back to pre-2021 levels for 2022. Our participants’ Oregon sales show little impact. However, as noted above, our statistical distributions do not reflect the worksite insurers. We believe inclusion of their data could show an approximately 50 percent increase in OR in 2021.
LIMRA kindly shared some of its sales findings as shown in table 6 (with some columns we added based on their data). As you can see, linked-benefit policies (“LTC Extension of Benefits”) and stand-alone LTCI (“traditional LTCI”) accounted for 20.2 percent of the policies and 16.6 percent of the premium.
In terms of protecting people against the risk of needing LTC, the contributions of stand-alone LTCI and linked-benefit products compared to acceleration products are likely greater than one might guess from these sales results. Consider:
- Linked-Benefit and Stand-alone LTCI policies have lower voluntary termination rates, hence are more likely to be available when care is needed.
- Linked-Benefit and Stand-Alone LTCI policies often have benefits that increase over time to help maintain purchasing power. Conversely, the purchasing power of Chronic Illness (CI) and LTC Riders (ADB) dwindles over time. However, purchasing power is a combination of the initial benefit plus increases; a large flat benefit could be sufficient when care is needed.
- According to LIMRA, 88 percent of the CI policies have benefits that are not fixed. The insured has to cover the time value of money until death or expected death and sometimes other factors such as foregone premiums.
- People are most likely to make LTC-related claims against stand-alone LTCI (it is use-it-or-lose-it) and second-most-likely to do so against linked-benefit products (to access the extension of benefits). Those products are more often purchased with LTC coverage in mind. In contrast, it may be more attractive to wait for the death benefit of acceleration policies, especially if the death benefit would be discounted when accessed to cover a LTC need.
Washington sales influenced the characteristics of 2021 sales significantly, as we reported last year and can be seen in this year’s results. Our sales distributions for 2022 continue to be somewhat influenced by Washington sales due to the backlog of policies that were not issued until 2022. Although we removed some of those backlogged Washington sales from our statistical distributions, we were unable to remove all such sales.
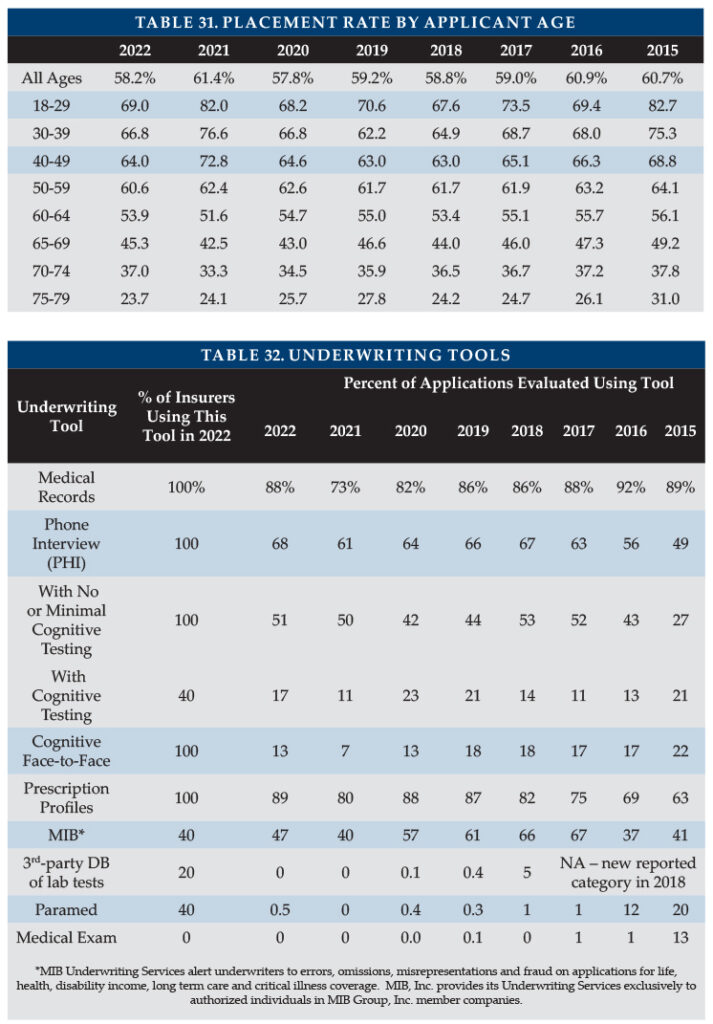
The national placement rate of 58.2 percent in 2022 was lower than the 61.4 percent in 2021 (unusually high due to Washington sales) but 0.4 percent higher than the 57.8 percent placement rate in 2020, as well as 4.1 percent higher than 2021’s 54.1 percent placement rate outside Washington. Our 2022 data includes some delayed young Washington applicants with higher placement rates.
Higher placement ratios are critical to encourage financial advisors to mention LTCI to clients. The following opportunities can improve placement rates.
- E-applications speed submission and reduce processing time, thus generally increasing placement.
- Uploading medical records via human application program interface (API) also speeds processing time, generally improving placement.
- Health pre-qualification effectively and efficiently decreases decline rates.
- Education of distributors, such as drill-down questions in on-line underwriting guides, tends to improve placement.
- Requiring cash with the application (CWA) led to about five percent more of the apps being placed according to our 2019 survey.
- Improved messaging regarding the value of LTCI and of buying now (rather than in the future) typically improves the placement rate by attracting younger and healthier applicants.
Other states are considering state-run LTCI programs. Examples include:
- During 2023, alternatives identified by a California task force will be priced and recommendations will be made to the legislature for possible 2024 legislation.
- In New York, SB 9082 was submitted in 2022 and Governor Hochul issued an executive order in November 2022 citing her “vision of a long-term care system that is accessible, effective, and affordable.”2
- Minnesota, which has twice had bills for a state LTCI program, intends to produce a report in 2023 regarding Minnesota’s options to finance LTC that will be provided to the legislature.
- There is a proposal in Massachusetts to create a task force to consider alternatives.
Such programs will likely differ from Washington’s program in several respects. For example, draft laws and task force discussions indicate that future laws:
- May not leave the window open for people to opt out by buying LTCI after the legislation has been signed.
- May require that private LTCI policies remain in force to maintain exemption.
- May narrow the range of private LTCI policies that qualify for exemption.
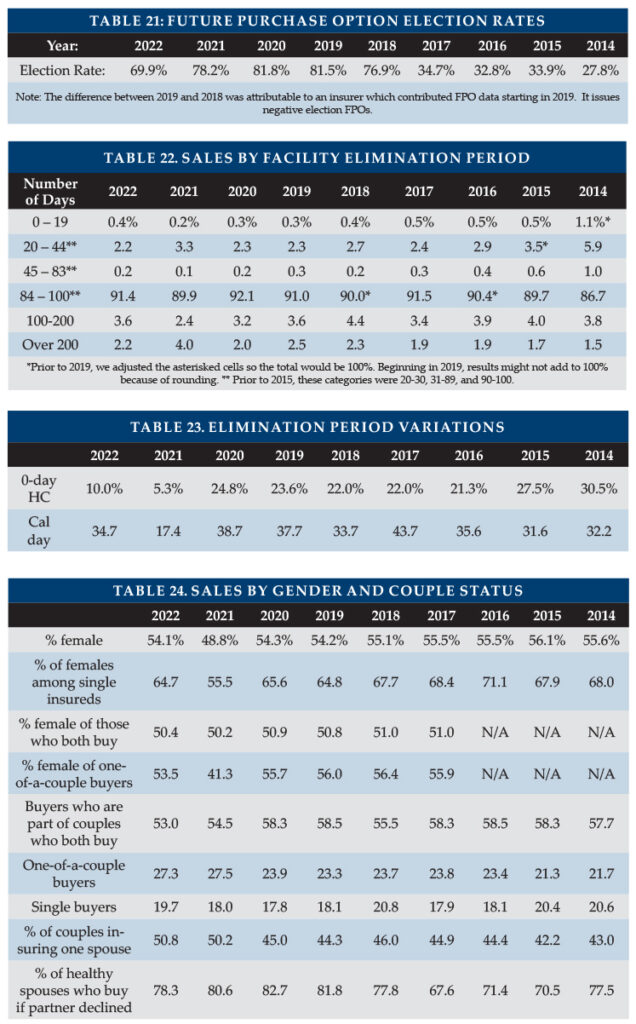
The FPO (future purchase option, a guaranteed, or a non-guaranteed board-approved, option, under specified conditions, to purchase additional coverage without demonstrating good health) election rate dropped from 78.2 percent in 2021 to 69.9 percent in 2022, the decrease being more than explained by one more entity reporting FPO elections in 2022. The same six insurers which reported 78.2 percent in 2021 reported 88.4 percent in 2022.
As both the additional coverage and unit price increase for FPOs as policies age, FPOs become increasingly expensive, even more so with inforce price increases. The high election rate reflects the effectiveness of annual (as opposed to triennial) negative-election FPOs and may reflect the importance of LTCI to policyholders. Negative-election FPOs activate automatically unless the client rejects them. Positive-election FPOs activate only if the client initiates a timely request. Considering such FPOs and other increased coverage provisions, we project a maximum benefit at age 80 of $310/day for an average 57-year-old purchaser in 2022, which is equivalent to an average 2.7 percent compounded benefit increase between 2022 and 2045. In 2020, the average 58-year-old purchaser anticipated an age 80 benefit (in 2042) of $305 (2.9 percent compounding). So, the average 2022 purchaser will have $5 more in coverage at age 80, despite facing 3 more years of inflation in the cost of care. This is the lowest effective rate of compounding that we have seen in the survey, yet inflation appears to be an increasing threat now. Purchasers may be disappointed if the purchasing power of their LTCI policies deteriorates over time.
Current premiums are much more stable than past premiums, partly because today’s premiums reflect much more conservative assumptions based on far more credible data as well as lower assumed investment yields. Two participants have never increased premiums on inforce policies and a third has had no increases on policies issued since 2003. None of the participants have raised rates on policies issued in 2016 or later. Even for new products, pricing changes are becoming rare. There have been no new prices (other than late state approvals) in the past two years. Nonetheless, financial advisors may presume new policies will face steep price increases, hence be reluctant to encourage clients to consider LTCI.
Linked benefit and other combination products’ coverage are attractive to consumers because if the insured never has a LTC claim, their beneficiary will receive a death benefit. They also are more likely to have indemnity benefits and guaranteed premiums and benefits.
However, such policies generally cost more than stand-alone LTCI without a return of premium feature (if there is comparable LTC coverage at age 85), although the difference may be less than in the past. Higher interest rates and competition appear to be driving linked-benefit premiums lower, which are also more available now with on-going premiums. Meanwhile, stand-alone LTCI new business prices have generally increased in recent years, especially for one-of-a-couple sales.
As explained above, stand-alone and linked-benefit products typically provide more LTC protection at age 85 than those combination policies which provide LTCI only through an accelerated death benefit.
All the insurers in our Product Exhibit offer coverage in all U.S. jurisdictions, except that two insurers do not offer policies in New York.
At the suggestion of a reader, we surveyed carriers regarding hospice provisions this year. Eight insurers responded.
- Five insurers define “hospice services” as being within six months of expected death, while one insurer indicated that their definition varies between 6 and 12 months depending on jurisdiction. Two insurers use a more general definition (e.g., “persons who are in the last phases of life due to terminal illness”), which is more flexible and seems less likely to conflict with potential future changes in general usage or regulations.
- All insurers cover hospice care at home. Two insurers cover hospice only as part of their home care benefits, six insurers cover hospice services in ALFs and nursing homes, and seven insurers cover hospice services in hospice facilities.
- None of the insurers cover hospice services provided to the terminally ill person’s family.
- Four insurers waive the elimination period (EP) for hospice services; the other four insurers require that the EP be satisfied prior to reimbursing for hospice care.
- Of the four insurers that waive the EP for hospice services, one credits hospice days to the “non-hospice” EP if either the insurer or Medicare pays for such days. The other three do not do so.
CLAIMS
Independent Third-Party Review (IR) is intended to help assure that LTCI claims are paid appropriately. Since 2009 (in some jurisdictions), if an insurer concludes that a claimant is not chronically ill as defined in the LTCI policy, the insurer must inform the claimant of his/her right to appeal to IR, which is binding on insurers.
In many states, IR is not effective, either because the law was not adopted or because regulators have not set up the required panel of independent reviewer organizations (IROs). Nonetheless, a claimant could ask an insurer to agree to IR.
The Product Exhibit shows that most participants extend IR beyond statutory requirements (e.g., to policies issued prior to the effective date of IR). Some insurers utilize IROs as part of the insurer’s internal appeal process.
A very small percentage of claims go to IR. Indeed, of seven insurers which provided claims information this year, at least three have never had a request for IR.
We are not aware of regulators who track IR results, but Steve LaPierre, President of LTCI Independent Eligibility Review Specialists, LLC (LTCIIERS), the largest IR organization, reports that the insurer’s decision was upheld 98 percent of the time in 2022.
For comparison, a National Nurses United study of CA acute health claims3 indicates that half of the denials referred to independent review were overturned. Acute health insurance and LTCI claims are denied for different reasons which likely explains much of the difference in the rate at which the insurers’ decisions are overturned.
- The LTCI industry’s IR experience indicates that insurers, overall, are paying claims appropriately.
- Eight participants reported 2022 claims. As some companies are not able to provide complete detailed data, some statistics reported below are more robust than others.
- The eight insurers’ combined individual and multi-life claim payments were five percent higher than in 2021.
- The LTCI industry has paid out benefits to policyholders far greater than indicated in the following statistics, because most claims are paid by insurers that do not currently sell LTCI.
LTCI claims paid by insurers no longer selling LTCI may differ significantly from the following statistics as their claimants are more likely to have facility-only coverage, be older, and/or have other different policy or demographic characteristics.
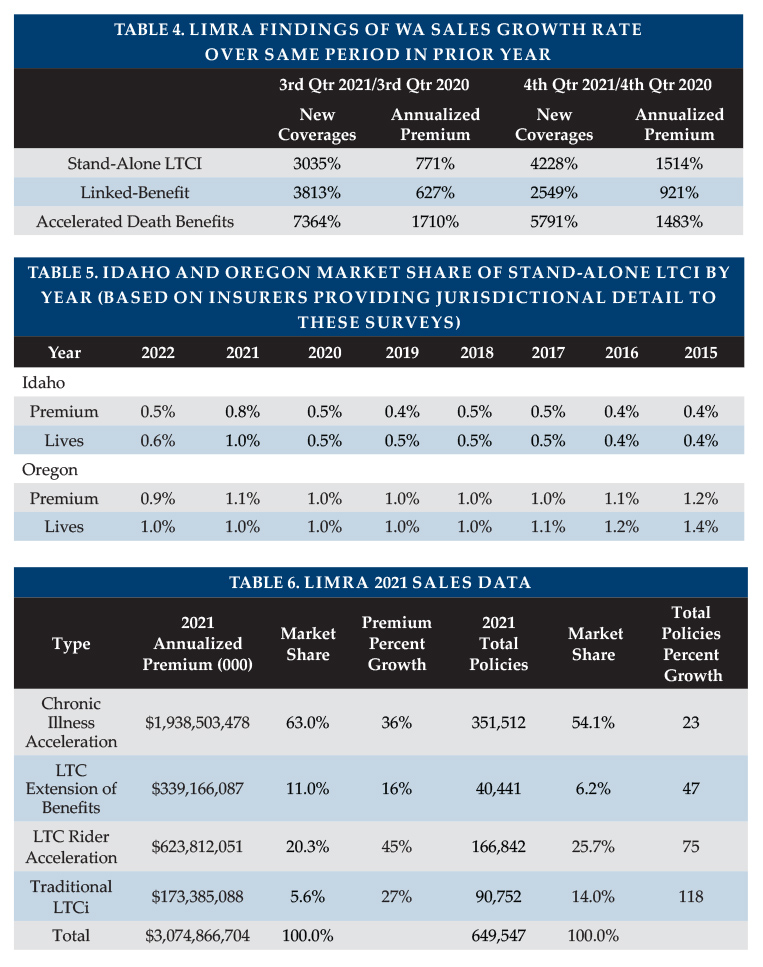
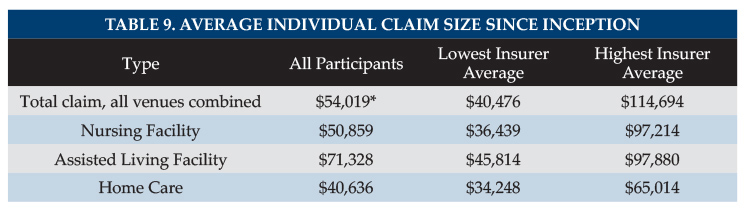
In Tables 7 and 8, one insurer, representing 17 percent of inception-to-date claims, was unable to report the number claims since inception and their distribution by venue. “Since inception” means since the insurer first started selling LTCI or as far back as they can report these results (for example, they may have changed claims administration systems and not be able to go all the way back to when they first processed claims).
Table 7 shows the total dollar and number of reported individual and multi-life (not group) LTCI claims. As noted above, total paid claims were up five percent.
Table 8 shows that, for insurers reporting claims data, claims shifted away from nursing homes to assisted living facilities (ALFs). Different insurers contributing data from one year to another and/or contributing differently makes it harder to identify trends. For example, we learned in 2021 that one insurer previously assigned all of a claimant’s benefits based on the venue in the claimant’s first month of claim. Their 2021 and 2022 data is based on the venue for each claim payment, pushing Table 8 toward nursing homes, which implies that the shift from NH to ALF since 2020 and prior years is greater than the table indicates.
In the distribution based on number of claims, a person who received care in more than one venue is counted once for each venue, but not double-counted in the total line. The average claimant is in 1.5 types of venues during the course of the claim; this does not recognize multiple providers within a single type of revenue (e.g., two nursing homes).
Five carriers reported open individual claims at year-end, averaging 70 percent of paid claims, the same as last year.
Table 9 shows average size individual claims since inception: that is, including older claims and reflecting all years of payment. Assisted Living Facility (ALF) claims and Home Care claims showed lower average sizes this year, related to the change in reporting mentioned above. Because 48 percent of claimants since inception have submitted claims from more than one type of venue, the average total claim might be expected to exceed the average claim paid for any particular venue. Individual ALF claims stand out as high each year (albeit not as much this year), probably because:
a) ALF claims appear to have a longer duration compared with other venues.
b) Nursing home costs are most likely to exceed the policy daily/monthly maximum, hence nursing home claims are most likely to understate the cost of care.
c) People who maximize the use of their maximum monthly benefits can generally spend as much in an ALF as in a nursing home.
d) Although some surveys report that on average ALFs cost about half as much as nursing homes, ALFs may have an extra charge for a memory unit or for levels of assistance that align more closely with nursing home care.
Several insurers extend ALF coverage to policies which originally did not include ALF coverage, providing policyholders with significant flexibility at the time of claim but contributing to the insurers’ need for rate increases.
The following factors contribute to a large range of average claim by insurer (see Table 9):
- Different markets (by affluence; worksite vs. individual; geography; etc.)
- Demographic differences (distribution by gender and age)
- Distribution by benefit period, benefit increase feature, shared care, and elimination period. For example, one carrier has a higher average home care claim than its average facility claims because home care was a rider and people who added the home care rider were more likely to add compound inflation also.
- Distribution by facility-only policies vs. 50 percent home care vs. 100 percent home care vs. home care only.
- Different lengths of time in the business.
- Differences in the ways insurers report claims.
*The following factors cause our average claim sizes to be understated.
- Approximately 16 percent of inception-to-date individual claims are still open and our data does not include reserve estimates for future payments on open claims.
- People who recover, then go on claim again, are counted as multiple insureds, rather than adding their various claims together.
- Some of our insurers are unable to report how many claimants were paid for care in multiple venues. Because we therefore overstate their number of claimants, we estimate that our overall average claim is understated by roughly $7,000. That is, the average claim has likely been closer to $61,000 than the $54,000 shown in the table above.
Besides being understated, average claim data does not reflect the value of LTCI benefits from some purchasers’ perspectives, because the many small claims drive down the average claim. LTCI provides significant financial yield for most people who need care one year or longer. A primary purpose of insurance is to protect against adverse results, so the amount of protection, as well as average claim, is important.
Six insurers provided their current individual monthly LTCI claim exposure (note: reflects only initial monthly maximum for one insurer). As shown in Table 10, this figure is 29 times their corresponding monthly LTCI premium income and 46.5 times their 2022 LTCI monthly paid claims. Eight insurers contributed data regarding their inforce distribution by benefit period. Treating endless (lifetime benefit periods) as a 15-year benefit period, we found that their average inforce benefit period has reduced to 6.44 years Increasing the assigned value of the endless benefit period by one year has an impact of approximately 0.22 years on the average inforce benefit period. With annual exposure 29 times annual premium and assuming an average benefit period of 6.44 years, we estimate that total exposure is 184 times annual premium. The average benefit period dropped from 7.14 last year to 6.44 this year because one more insurer contributed data and it has by far the lowest average benefit period.
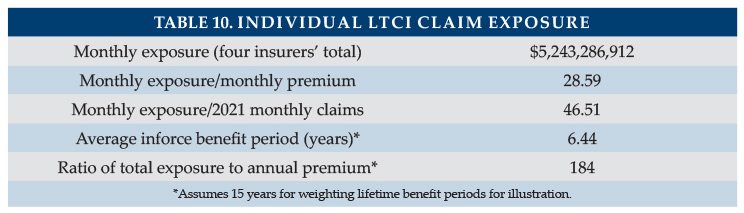
Five insurers reported their current average individual maximum monthly maximum benefit for claimants, with results ranging from $5,393 to $8,309.
Nursing home (NH) claims are more likely to use the policy’s maximum daily/monthly benefit than ALF claims because ALF daily/monthly costs are generally lower and because policies sometimes have lower maximums for ALFs. ALF claims correspondingly are more likely to use the policy maximum than are adult day care and home care claims.
SALES STATISTICAL ANALYSIS
Bankers Life, Knights of Columbus, Mutual of Omaha, National Guardian, New York Life, Northwestern and Thrivent contributed significant background stand-alone LTCI sales data, but some were unable to contribute some data. LifeSecure provided only total stand-alone sales, not distributions.
Sales characteristics vary significantly among insurers based on market differences (individual vs. worksite, affluence, gender distribution, etc.). Year-to-year variations in policy feature distributions may reflect industry trends but may also reflect changes in participants, participant practices and designs, participant or worksite market shares, etc. In 2021, we had major variance from historical results, and we still have some distortion in 2022 as some participants’ distributions include delayed Washington sales from 2021. Statistical differences between the worksite and non-worksite sales will be reported in the August issue of Broker World.
Market Share
We include purchased increases on existing policies as new premium because new coverage is being issued. Table 11 shows 2022 new premium, both including and excluding FPOs. In Table 11, no sales were re-characterized from 2022 to 2021. Total sales levels are remarkably similar to 2020.
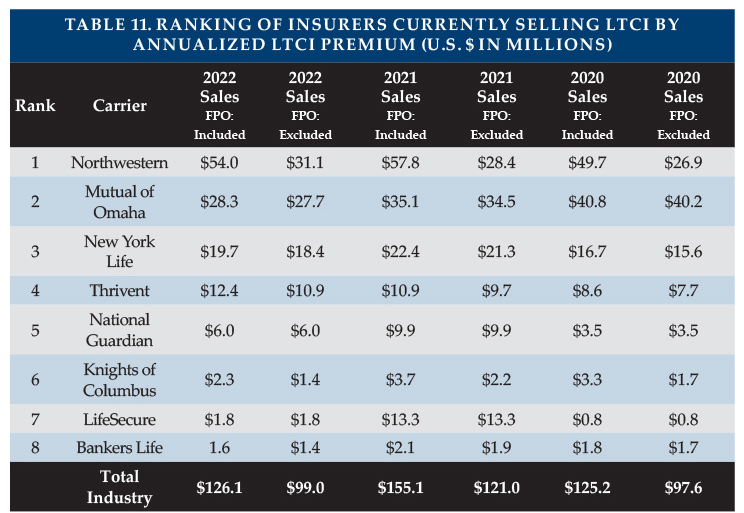
Northwestern ranks #1 in new premium both when including FPOs and, for the first time, when excluding FPOs. Mutual of Omaha still ranks #1 in the number of new policies (see Policy Exhibit). Together, Northwestern and Mutual of Omaha account for 65 percent of the market, in terms of premium. When paired with New York Life’s growth, the three top carriers represent 81 percent of the market. The premium below includes 100 percent of recurring premiums plus 10 percent of single premiums.
Worksite Market Share
After a high year in 2021 due to the WCF exemption, worksite sales dropped in 2022 as shown in Table 12.
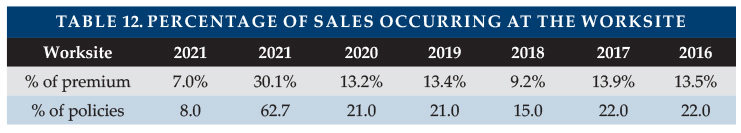
Worksite sales normally consist of three different markets as outlined below, the first two of which produce a higher percentage of new insureds than of new premiums. Worksite 2021 sales were largely voluntary but had the age and premium characteristics of core/buy-up due to Washington sales.
- Voluntary group coverage generally is less robust than individual coverage.
- Core/Buy-Up programs have particularly young age distributions and modest coverage because a lot of people do not buy-up and are less likely to insure spouses.
- Executive carve-out programs generally provide the most robust coverage. One-or two-couple executive carve-out sales may not qualify for a multi-life discount with some insurers, hence may not be labeled as worksite sales in submissions to our survey.
The amount of worksite sales reported and its distribution among the sub-markets significantly impact sales characteristics. Unfortunately, our sales distributions do not reflect the insurers focusing in the group voluntary and core/buy-up markets. More information about worksite sales will appear in the August issue of Broker World magazine.
We noted last year that the future of the non-executive carve-out LTCI market is unpredictable with Transamerica’s departure. Other insurers with stand-alone LTCI products did not absorb Transamerica’s market share. It seems likely that combination worksite products are picking up market share.
Affinity Market Share
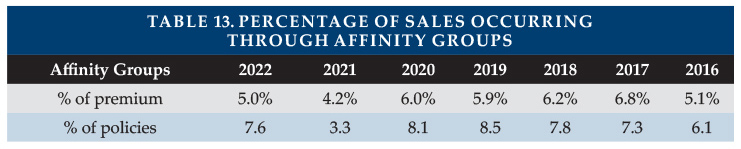
Affinity groups (non-employers such as associations) produced 5.0 percent of 2022 premium (a relatively low percentage as shown in Table 13) and 7.6 percent of 2022 policies. The percentages in Table 13 reflect only participants’ sales.
Characteristics of Policies Sold
Average Premium Per Sale
To determine the average premium for new sales, we exclude FPOs. As shown in Table 14, the average premium per new insured and per new buying unit increased substantially over 2020 and prior averages. The key contributor was the reduced percentage of small worksite policies resulting from Transamerica’s departure. Higher prices instituted in late 2020 and early 2021 also contributed to the increase.
The influence of small worksite policies is greatly reduced now. Removing the primary insurer in that market produces an average premium per insured of $3,618, as shown in table 14. Including this carrier produces an average premium of $3,556.
The jurisdiction with the lowest average new premium for participants in 2022 (including FPOs and counting 10 percent of single premiums) was Puerto Rico ($1,270), followed by Alaska ($2,759), which in turn was significantly lower than the third-lowest (Kansas, $3,224). The jurisdiction with the highest average premium was West Virginia ($7,497, a spike caused by two single premium sales; with those removed, West Virginia average would have been $4,952). West Virginia was followed by New England states (which typically have high average premiums)—Connecticut ($5,865), Massachusetts ($5,850), Rhode Island ($5,755), and New Hampshire ($5,611).
Data for 2017 and earlier years included FPOs in these calculations, overstating the average premium per new insured and buying unit.
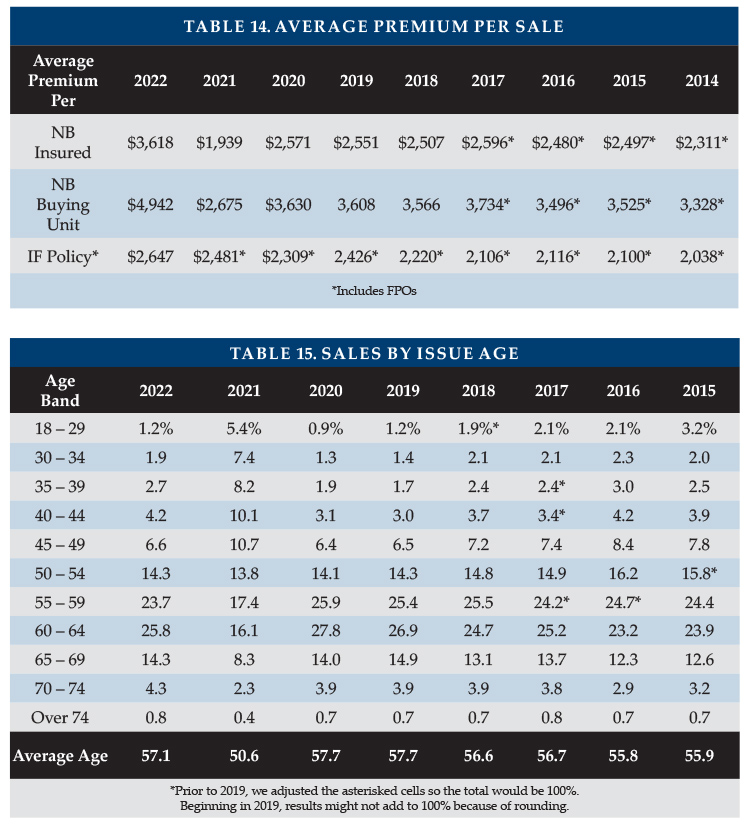
Issue Age
Table 15 shows that 5.8 percent of 2022’s policies were sold to people under age 40, which reflects that delayed Washington sales likely affected our distribution of business when comparing to 2020 levels. The reduction in worksite business does not impact this distribution because starting in 2017, we stopped getting sales distributions from insurers focused on the worksite market.
Last year, we estimated that our participants’ average issue age in Washington was about 15 years lower than outside Washington.
Note: one survey participant has a minimum issue age of 40, one will not issue below 30, and one will not issue below 25.
Benefit Period
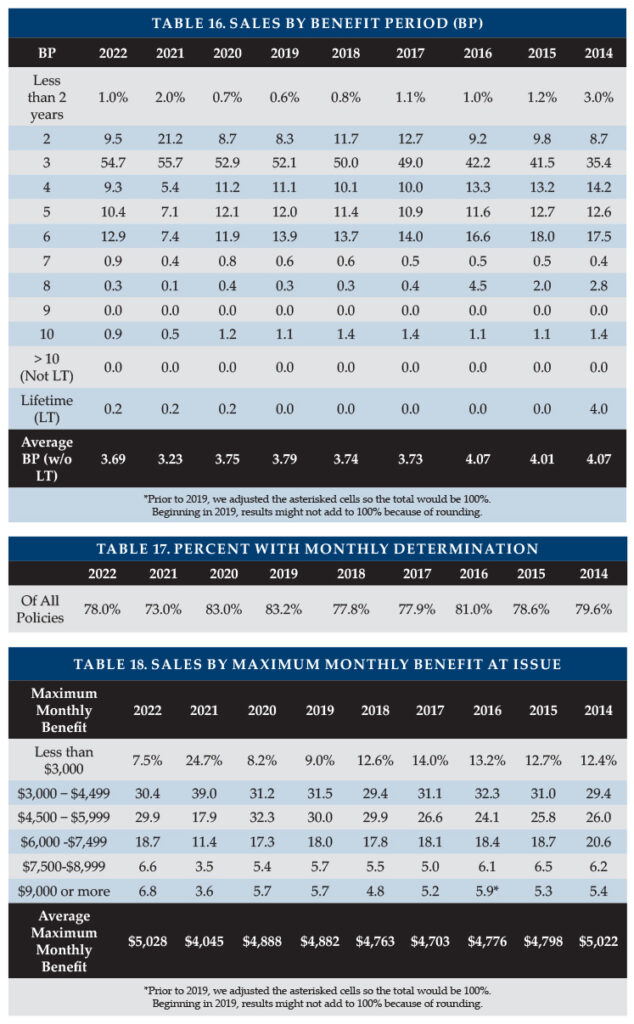
Table 16 summarizes the distribution of sales by benefit period. The average benefit period rebounded to near 2020 levels but there were still more policies issued with 3-year or shorter benefit periods than any year prior to 2021. Delayed Washington sales likely had some impact here; although, insurers instituted minimum premium rules in Washington in 2021 that likely avoided some short benefit period sales.
Monthly Benefit
Monthly determination rebounded to 78 percent of policies sold (Table 17). With monthly determination, low-expense days leave more benefits to cover high-expense days, offering more flexibility for insureds. One insurer offers only daily determination; one insurer offers a choice; and the other insurers automatically have monthly (or weekly) determination.
Despite including some delayed Washington policies, the 2022 sales set the record for the highest average maximum monthly benefit ($5,028) (as shown in Table 18). Sales with an initial monthly maximum less than $3,000 ranged from 2.4 percent of an insurer’s sales to 14.7 percent.
Benefit Increase Features
Perhaps because of the reduced amount of worksite business or perhaps because general inflation increased, Table 19 shows that there was an increase in the percentage of policies with 4.5+ percent compounding of benefits. However, despite the general inflation experienced in 2022, protection against future inflation generally decreased, compared to 2020, except for the bounce at 4.5+ percent compounding.
“Indexed Level Premium” policies are priced to have a level premium, but the benefit increase is tied to an index such as the consumer price index (CPI).
As shown in Table 20, we project the age 80 maximum daily benefit by increasing the average initial daily benefit from the average issue age to age 80, according to the distribution of benefit increase features, using current future purchase option (FPO) election rates and a five percent per year offer for fixed FPOs. The maximum benefit at age 80 (in 2045) for our 2022 average 57-year-old purchaser projects to $310/day (equivalent to 2.7 percent compounding). Had our average buyer bought an average 2020 policy two years ago at age 55, her/his age 80 benefit would have been $335/day.
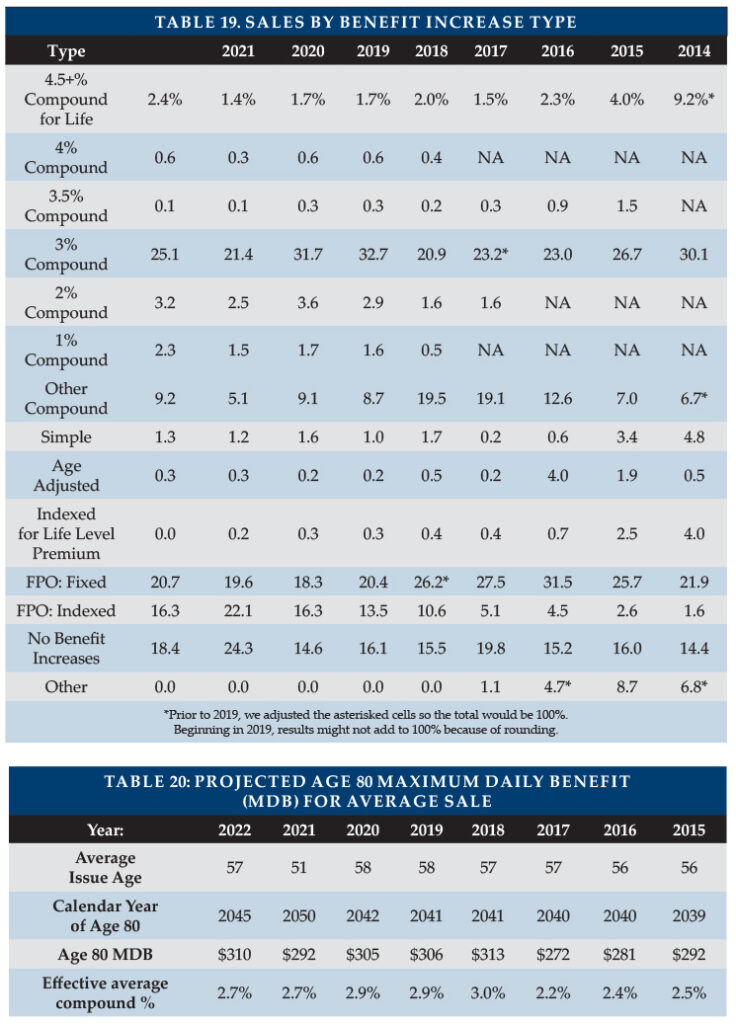
In Table 20, the 2022 figure of $310 might look comparable to the 2020 ($305) and 2019 ($306) figures but note that the 2020 and 2019 projections were to 2042 and 2041, respectively. We project only $4 to $5 more daily benefit to offset inflation to 2045 (3 or 4 more years).
Pandemic protocols are likely to increase facility costs and there are a variety of inflationary pressures which apply to LTC staff salaries at all types of venue. Yet, despite greater awareness of inflation, 2022 purchasers, on average, will have 7.5 percent less coverage at age 80 than would have been the case if they had bought an average 2020 policy in 2020. People are likely to be disappointed by the purchasing power of their policies when they need care if actual cost of care trends exceed the protection built into policies. Policies with flat benefits will experience even greater erosion of purchasing power.
FPOs (Table 21) are important to insureds in order to maintain purchasing power, and 70 percent of our participants’ 2022 FPOs were exercised. The high election rate is noteworthy, considering that the cost increases each year due to larger coverage increases each year, increasing unit prices due to age, and additional price increases due to rate increases.
One participant had an election rate of 96 percent, two had 63 to 68 percent, two had 42 to 51 percent, and one had 12.5 percent. The company with the lowest election rate did not contribute data last year. Participants that reported FPO election rates in both 2021 and 2022 had an increase in election rate from 78.2 percent in 2021 to 88.4 percent in 2022, but the average new premium per FPO election dropped.
Higher election rates occur if FPOs are more frequent (i.e., every year vs. every three years), if elections are “negative-election” (i.e., activate automatically unless the client rejects them) as opposed to “positive-election” (i.e., which activate only if the client makes a request), and if policyholders must exercise FPOs to continue to receive future offers.
FPOs can also be important to insurers. Two insurers got a large percentage of their new premium (42 percent for one; 39 percent for the other) from FPO elections.
Elimination Period
Table 22 summarizes the distribution of sales by facility elimination period (EP). The percentage of people buying 84-100 day EP rebounded to more than 91 percent. Two insurers saw 9.6 and 12.2 percent of their buyers choose EPs of longer than 100 days.
Table 23 shows the percentage of participant policies with zero-day home care elimination period (but a longer facility elimination period). The purchase rate of an additional-cost zero-day home care EP option is sensitive to the price. Table 23 shows a drop in 0-day home care EP influenced by Transamerica’s departure from the market.
Table 23 also shows the percentage of participant policies with a calendar-day EP. It is important to understand that most calendar-day EP provisions do not start counting until a paid-service day has occurred. The drop in calendar-day EP results from a change in distribution between carriers.
Sales to Couples and Gender Distribution
As shown in Table 24, which summarizes the distribution of sales by gender and partner status, a majority of 2022 purchasers (54.1 percent) were once again female, reversing from 2021.
The percentage of accepted applicants who purchase coverage when their partner is declined dropped below 80 percent for the first time since 2018. It varies significantly by insurer based on their couples pricing and their distribution system. Only two insurers were able to report this data. Their results were similar (77 and 80 percent, respectively) for the percentage of accepted applicants who purchased coverage after a partner’s denial.
Shared Care and Other Couples’ Features
Table 25 summarizes sales of Shared Care and other couples’ features.
- Shared Care allows one spouse/partner to use the other’s available benefits if their own coverage has been depleted or offers a third independent pool the couple can share.
- Survivorship waives a survivor’s premium after the first death if specified conditions are met (such as having been inforce for 10 or more years).
- Joint waiver of premium (WP) waives both insureds’ premiums if either insured qualifies for benefits.
Changes in distribution by carrier can greatly impact year-to-year comparisons (Table 25). Some insurers embed survivorship or joint waiver automatically (sometimes only for particular circumstances such as if Shared Care is purchased), while others offer it for an extra premium or do not offer the feature.
In the top half of Table 25, percentages are based on the number of policies sold to couples who both buy (only limited benefit, for Shared Care). The bottom half of Table 25 shows the percentage of policies that results from dividing by sales of insurers that offer the outlined feature. Joint WP and Survivorship had high election rates this year but Shared Care lagged.
For insurers reporting Shared Care sales, the percentage of both-buying couples who opted for Shared Care varied from four to 77 percent. The corresponding percentage of couples with Joint WP varied from 10 to 100 percent and for Survivorship ranged from 2.4 to 12.5 percent.
Tables 26 and 27 provide additional breakdown on the characteristics of Shared Care sales. Table 26 shows that, for every benefit period except two year, Shared Care was less common than in 2020. The “other” category represents two insurers which reported a few Shared Care sales with benefit periods shorter than two years.
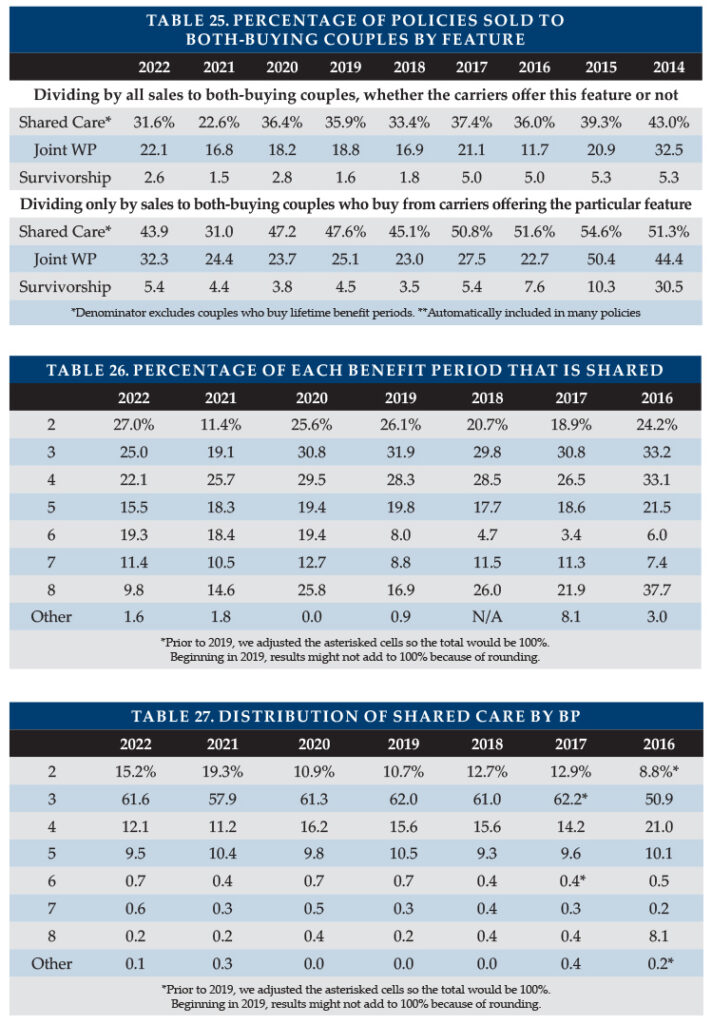
Table 27 looks only at Shared Care policies and reports their distribution across benefit period, so the percentages must total 100 percent. As most policies have three-year benefit periods, most Shared Care policies had a three-year benefit period (Table 27).
Table 26 shows a low percentage of policies having Shared Care, partly because its denominator includes all policies, even those sold to single people or one of a couple. Table 26 denominators are couples who both bought coverage with the particular benefit period. Table 27’s denominator is the number of Shared Care policies.
Shared Care is generally more concentrated in two- to four-year benefit periods than are all sales. Couples are likely to buy shorter benefit periods because couples plan to help provide care to each other and expect the male partner to not need care for a long time. If the female provides care and the male does not need LTC for a long time, more coverage is available for the surviving female when she needs care. As shown in Table 24, single buyers are more likely to be female and females are more likely to opt for a longer benefit period.
Existence and Type of Home Care Coverage
Three participants reported sales of facility-only policies, which accounted for 0.3 percent of total sales. One insurer was responsible for 89 percent of such sales. Nearly 96 percent of the comprehensive policies included home care benefits equal to the facility benefit. The other sales all had a home care benefit of at least 50 percent of the nursing home benefit. The last home-care-only sale in our survey was sold in 2018.
Other Characteristics
As shown in Table 28, partial cash alternative features (which allowed claimants, in lieu of any other benefit that month, to use between 10 and 40 percent of their benefits for whatever purpose they wish) were included in fewer of our participants’ policies due to a change in market share among participants. One insurer sold 89 percent of such features, which demonstrates how a shift in distribution between insurers can change sales distributions.
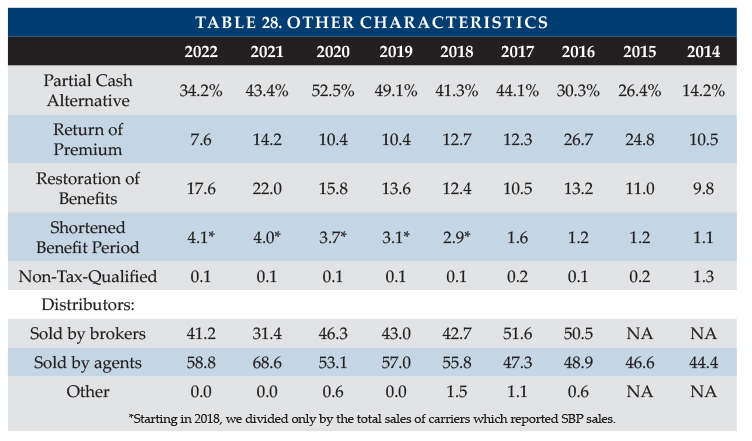
Return of premium (ROP) features were included in 7.6 percent of policies. ROP returns some or all premiums (usually reduced by paid LTCI benefits) when a policyholder dies. Roughly 69 percent of ROP features were embedded automatically in the product. Embedded features are designed to raise premiums minimally, typically decreasing the ROP benefit to $0 by age 75. Table 28 shows a large drop in sales with ROP from historical percentages, which reflects not only a change of distribution between insurers but also a change in distribution between products within an insurer. Correspondingly, the percentage of ROP features that were automatically embedded dropped from nearly 90 percent in 2021. The drop is entirely due to one insurer. Collectively, the other insurers had approximately the same percentage as last year.
Restoration of Benefits (ROB), which restores used benefits when the insured has not needed services for, typically at least six months, was included in 17.6 percent of policies with limited benefit periods. Roughly 90 percent of ROB features were automatically embedded.
Insurers must offer shortened benefit period (SBP) coverage, which makes limited future LTCI benefits available to people who stop paying premiums after three or more years. The insurers able to report SBP sales, sold SBP to 4.1 percent of buyers.
Only one insurer issued non-tax-qualified (NTQ) policies, which accounted for 0.1 percent of total industry sales.
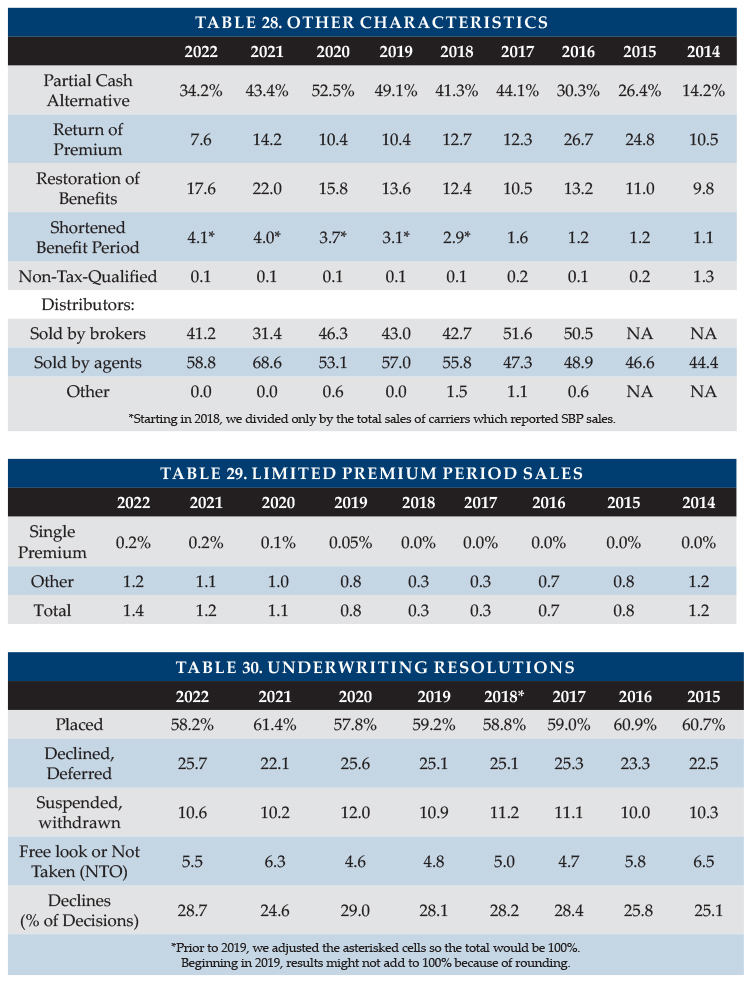
“Captive” (dedicated to one insurer) agents produced 58.8 percent of the sales, a large drop from last year’s Washington-driven share (68.6 percent). Brokers produced the balance. Some direct-to-consumer sales were made but not by our participants. At one time, “captive” agents who sold LTCI tended to specialize in LTCI. Now many are agents of mutual companies.
Sales distribution by jurisdiction is posted on the Broker World website.
Limited Pay and Paid-Up Policies
In 2022, two insurers in the survey sold policies that become paid-up in 10 years or less, accounting for 1.2 percent of sales.
Because today’s premiums are more stable compared to policies sold years ago, premium increases are less likely. One of the key reasons for buying 10-year-pay (avoidance of rate increases after the 10th year) is greatly reduced, while the cost of 10-year-pay has increased, making it less attractive for consumers than in the past. Nonetheless, limited-pay and single-pay policies are attractive to minimize post-retirement outflow and to accommodate §1035 exchanges. Limited pay sales have been increasing slowly as a percentage of total sales since 2019.
Seven participants reported that 3.6 percent of their inforce policies are paid-up, an increasing percentage as the number of paid-up policies is increasing while the total number of policies is decreasing.
PARTNERSHIP PROGRAM BACKGROUND
When someone applies to Medicaid for long-term care services, most states with Partnership programs disregard assets up to the amount of benefits received from a Partnership-qualified policy (some Indiana and New York policies disregard all assets). Except for California, states with Partnership programs grant reciprocity to Partnership policies issued in other jurisdictions. Partnership programs are approved in 44 jurisdictions, all but AK, DC, HI, MA, MS, UT, and VT. However, MA has a similar program (MassHealth).
Four states (CA, CT, IN and NY) blazed the trail for Partnership programs in the early 1990s. Other states were allowed to adopt simplified and more standardized Partnership regulations as a result of the Deficit Reduction Act of 2005 (DRA).
Approximately 60 percent of Partnership states now allow one percent compounding to qualify for Partnership, which can help low-budget buyers qualify for Partnership and also enable worksite core programs to be Partnership-qualified. A higher percentage of policies will qualify for Partnership in the future if insurers and advisors leverage these opportunities. However, currently only three insurers offer one percent compounding.
Partnership programs could be more successful if:
- Advisors offer small maximum monthly benefits more frequently to middle-income individuals. For example, a $1,500 initial maximum monthly benefit covers about four hours of home care every two days and, with compound benefit increases, may maintain buying power. Many middle-income individuals would like LTCI to help them stay at home while not “burning out” family caregivers and could be motivated further by Partnership asset disregard. (This approach does not work in CA, CT, IN and NY because of their high Partnership minimum daily benefit requirements.)
- Middle-income prospects were better educated about the importance of benefit increases to maintain LTCI purchasing power and qualify for Partnership asset disregard.
- The four original Partnership states migrate to DRA rules.
- More jurisdictions adopt Partnership programs.
- Programs that privately finance direct mail educational LTCI content from public agencies were adopted more broadly.
- Financial advisors were to press reluctant insurers to certify their products and offer one percent compounding.
- More financial advisors were certified. Some people argue that certification requirements should be loosened. At a minimum, the renewal certification process could be improved.
- Linked benefit products became Partnership-qualified.
PARTNERSHIP PROGRAM SALES
Participants reported Partnership sales in 41 states, all authorized states except CA, CT and NY. One carrier sold a Partnership policy in each of the 41 states. One has chosen not to certify Partnership conformance.
Insurance brokers do not have access to Partnership policies in CA, CT and NY and from only one insurer in IN. However, consumers may be able to purchase Partnership-qualified coverage from another entity.
Participants’ Partnership-qualified policies in DRA states rose from 34.6 to 49.9 percent, short of 2020’s 55 percent, presumably influenced by benefit increase provisions being less popular. Minnesota (83.5 percent) leads each year. Wyoming was second (79.5 percent), followed by Maine (73.7 percent) and Wisconsin (70.2 percent). Ten states had between 60 and 70 percent and 23 had at least 50 percent of their policies qualify. Once again, Indiana (5.9 percent) and New Mexico (14.7 percent) were the only states with participant Partnership sales in which fewer than 20 percent qualified.
UNDERWRITING DATA
Case Disposition
Five insurers contributed application case disposition data to the survey (Table 30). Case resolutions in 2022 were similar to 2020. In 2022, 58.2 percent of applications were placed. One insurer placed 74 percent of its cases; the others placed 50 to 56 percent.
Of cases which were resolved, 28.7 percent were declined or deferred, with the percentage varying from 14.6 to 32.7 percent, depending on insurer. To the degree that a declined applicant got coverage elsewhere or a deferred applicant was ultimately approved, the eventual placement rate for applicants is higher than our data indicates.
Overall, 16.1 percent of cases were suspended or withdrawn during underwriting or not accepted or dropped during the free look period. That is the lowest percentage since 2019.
Factors such as age distribution, distribution system, market, underwriting requirements, and underwriting standards affect these results.
Table 31 shows the placement rate by applicant age. This data is a subset of the placement data in Table 30 as some carriers cannot provide this data by age.
Low placement rates increase insurers’ cost per placed policy. More importantly, low placement rates discourage advisors from discussing LTCI with clients. In addition to not wanting to waste time and effort, advisors may fear that declined clients will be dissatisfied. In the Market Perspective section, we listed ways to improve placement rates. This is a critical issue for the industry. If readers have suggestions, they are invited to contact the authors.
Underwriting Tools
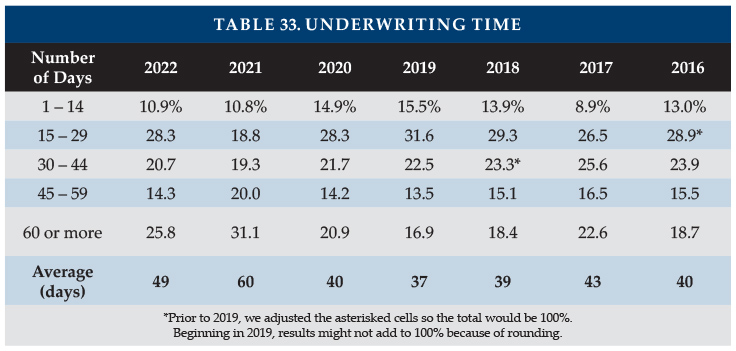
Five insurers contributed data to Table 32, which divides the number of uses of each underwriting tool by the number of applications processed. For example, the count of instances where medical records were requested was 88 percent of the number of applications. That does not mean that 88 percent of the applications involved medical records, because some applications resulted in more than one set of medical records being requested.
Year-to-year changes in distribution of sales among insurers significantly impact results. Lower maximum ages result in fewer face-to-face exams. Insurers might underreport the use of an underwriting tool because they may lack a good source for that statistic. For example, an insurer might not be able to split phone interviews by whether or not they include cognitive testing.
Underwriting Time
Table 33 shows that for six insurers, the average processing time, from receipt of application to mailing the policy, was 49 days. As with other statistics, we believe that our underwriting data overstates the percentage of policies with long underwriting periods because of Washington cases.
Rating Classification
Table 34 shows that more than half of 2022 policies were issued in the most favorable rating classification. The table suggests that the percentage of decisions that are either declined or placed in the 3rd or less-attractive classification is reducing slowly, but Table 36 shows that the decline rate was higher in 2022 than in 2020 for each age group. The discrepancy is related to different carriers contributing to the two tables and changing distributions of business.
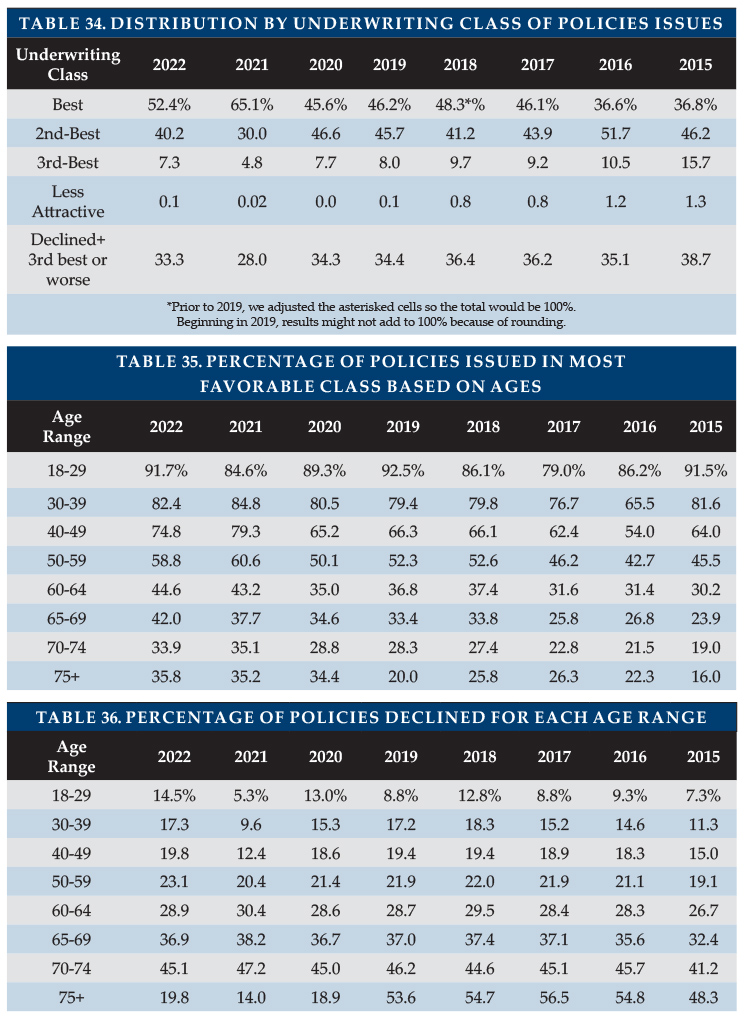
Tables 35 and 36 show the 2022 percentages of policies issued in the most favorable category and decline decisions by issue age. These tables do not exactly match Table 34 because some participants provide all-age data, rather than separating it by age. The percentage placed in the most favorable classification increased for all ages from 2020 to 2022, at least partly due to changing distribution by age.
The decline rate was higher in 2022 than in 2020 for each age group, even though the younger ages still reflect some 2021 lagged sales. For the past 3 years, the percentage placed in the most favorable classification has been higher for ages 75+ than for ages 70-74 and the decline rate has been lower. The age 75+ block is the smallest and most susceptible to statistical fluctuation, but the primary cause appears to be different distribution of insurers by age. For example, some insurers do not have a “preferred” health discount; the bulk of their policies are issued in their “most favorable” class.
MORE INFORMATION AT WWW.BROKERWORLDMAG.COM
Only available at www.BrokerWorldMag.com:
- Product Exhibit shows, for 6 insurers: financial ratings, LTCI sales and inforce policies, and product details.
- Product Details, a row-by-row definition of the product exhibit entries, with commentary.
- Premium Exhibit, which shows lifetime annual premiums for each insurer’s most common underwriting class, for issue ages 40, 50, 60, and 70 for single females, single males, and female/male couples (assuming both are the same age), based on $100 per day (or closest equivalent monthly) benefit, 90-day facility and default home care elimination period (other aspects vary), three-year and five-year benefit periods or $100,000 and $200,000 maximum lifetime buckets, with and without Shared Care and with flat benefits or automatic three and five percent annual compound benefit increases for life. The exhibit includes facility-only policies, as well as comprehensive policies. Worksite products do not reflect any worksite-specific discount.
- Premium Adjustments (from our published prices) by underwriting class for each participant.
- Distribution by underwriting class for each participant.
- State-by-state results: percentage of sales by state, average premium by state and percentage of policies qualifying for Partnership by state.
CLOSING
We thank insurance company staff for submitting the data and responding to questions promptly. We thank our reader, Ellen Atkins, who suggested we explore the differences in hospice benefits among our participants. We also thank Sophia Fosdick and Quentin Clemens of Milliman for managing the data expertly.
We reviewed data for reasonableness and insurers reviewed their product exhibit displays. Nonetheless, we cannot assure that all data is accurate.
If you have suggestions for improving this survey (including new entrants in the market), please contact one of the authors.
Footnotes:
- Washington State Employment Security Department, https://media.esd.wa.gov/esdwa/Default/ESDWAGOV/Fact-Sheets/2023-wa-cares-overview-230113.pdf.
- https://www.governor.ny.gov/news/governor-hochul-signs-executive-order-create-new-yorks-first-ever-master-plan-aging.
- https://www.nationalnursesunited.org/press/60-80-insurance-denials-overturned-or-reversed-when-taken-independent-medical-review-new-data#:~:text=60%2D80%25%20of%20Insurance%20Denials,New%20Data%20%7C%20National%20Nurses%20United.