


The 2024 Milliman Long Term Care Insurance Survey is the 26th consecutive annual review of stand-alone long term care insurance (LTCI) published by Broker World magazine. It analyzes the marketplace, reports sales distributions, and describes available products.
More discussion of worksite sales, including a comparison of worksite sales distributions vs. non-worksite sales distributions will be in Broker World magazine’s September/October issue.
Unless otherwise indicated, references are solely to U.S. stand-alone LTCI sales, excluding exercised future purchase options (FPOs) or other changes to existing coverage. “Stand-alone” refers to LTCI policies that do not include death benefits (other than returning premiums upon death or waiving a surviving spouse’s premiums) or annuity or disability income benefits. Where referenced, “combo” or “combination” products provide LTCI combined with life insurance or annuity coverage. “Linked benefit” policies are combo policies which can allow more than the death benefit or annuity account value to be used for long-term care (LTC).
All references to sales in terms of “premium” refer to “annualized” premium (1 x annual; 2 x semi-annual; 4 x quarterly; 12 x monthly), even if only one monthly premium was received before year-end. “WCF” refers to the “Washington Cares Fund,” explained in the Market Perspective section.
Highlights from this year’s survey
As discussed in our survey of 2021 sales, the WCF stimulated tremendous market demand in the state of Washington, causing sales distributions to vary greatly from history (as one example, more sales to males than to females). In 2022, some participants’ sales distributions continued to be influenced by a backlog of 2021 applications. The 2023 sales distributions in this year’s survey should have no such influence.
Participants
Seven insurers (Bankers Life, Knights of Columbus, Mutual of Omaha, National Guardian Life, New York Life, Northwestern, and Thrivent) participated, providing broadly to stand-alone sales distributions reported herein. Total 2023 sales data includes one additional contributor and 2023 inforce data includes two additional contributors.
Our worksite sales reflect the total industry, but our worksite sales distributions do not reflect low-price worksite programs; hence, our worksite sales distributions are not characteristic of the entire worksite market.
The following ten insurers contributed to our combination sales data: AFLAC, John Hancock, Mass Mutual, New York Life, Nationwide, Northwestern Mutual (Northwestern), OneAmerica, Securian, Trustmark and United of Omaha.
Sales Summary
- As seen in Table 1, contributors reported total stand-alone LTCI annualized new premium sales of $121 million in 2023 (including exercised FPOs except FPOs for insurers no longer selling LTCI and counting 10 percent of single premium), which is 2.5 percent less than the contributors’ reported sales of $124 million in 2022. The 2.5 percent drop reflects a 5.9 percent decrease for premium on new LTCI policies, partly offset by a 6 percent increase in FPOs and single premium.
- The 2023 sales to 24,734 new insureds is 9 percent lower than 2022 sales to 27,181 new insureds, resulting in an 3.4 percent increase in average premium per new insured (excluding FPOs).
- The percentage of 2023 sales that occurred in the worksite were the lowest ever in our sales survey. We observe that life insurance policies with LTCI or chronic illness riders are more commonly sold in this market.
- Including FPO elections, Northwestern accounted for 48 percent of annualized new premium. Mutual of Omaha continued to lead in annualized premium from new policies and accounted for 30 percent of new insureds in 2023.
- Although our sales survey covers essentially the entire stand-alone LTCI market, the ten insurers contributing combo sales are a smaller percentage of the combo market. LIMRA provided broader information about the combined life/LTCI market to supplement the data reported by contributors in our survey.
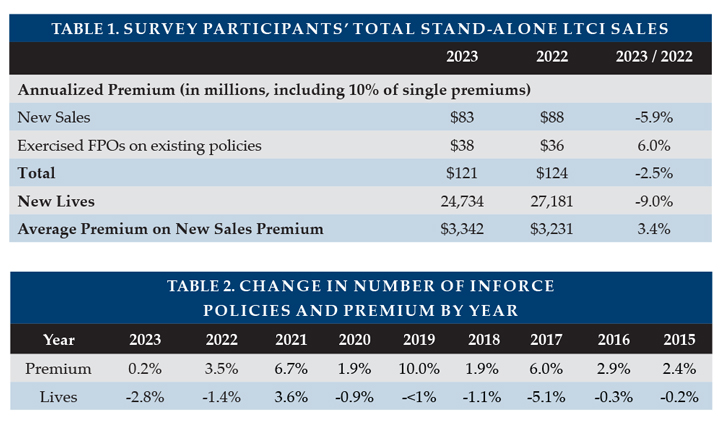
Reflecting nine entities’ data, the number of inforce insureds dropped 2.8 percent while annualized premium increased 0.2 percent. Inforce premium rises due to sales, price increases, and benefit increases (including FPOs), and falls from lapses, reductions in coverage, deaths, and shifts to paid-up status. The number of people with stand-alone coverage increased through 2014, but, as shown in Table 2, has decreased annually since then except for the 2021 aberration. However, inforce premium has continued to increase each year due to inforce price increases and higher prices for new policies.
Collectively, eight participants paid 9.3 percent more in claims in 2023 than in 2022. Overall, the stand-alone LTCI industry incurred $15.0 billion in claims in 2022 based on companies’ statutory annual filings, a 10.6 percent increase over 2021, which raises the running total of incurred claims since 1991 to $196.0 billion (2022 claims of $15.0 billion plus total of $180.9 billion from our prior year’s article).
About the Survey
This article is arranged in the following sections:
- Highlights provides a high-level view of results.
- Market Perspective provides insights into the LTCI market.
- Claims presents industry-level claims data.
- Sales Statistical Analysis presents industry-level sales distributions reflecting data from 8 insurers.
- Partnership Programs discusses the impact of the state partnerships for LTCI.
- Underwriting Data discusses underwriting decisions, turn-around times and tools.
Only available at www.BrokerWorldMag.com:
- Product Exhibit shows, for 6 insurers: financial ratings, LTCI sales and inforce policies, and product details.
- Product Details, a row-by-row definition of the product exhibit entries, with some commentary.
- Premium Exhibit shows lifetime annual premiums for each insurer’s most common underwriting class, for issue ages 40, 50, 60, and 70 for single females, single males, and female/male couples (assuming both buy at the same age), based on $100 per day (or closest equivalent weekly or monthly) benefit, 90-day facility and most common home care elimination period, three-year and five-year benefit periods or $100,000 and $200,000 maximum lifetime buckets, with and without Shared Care and with flat benefits or automatic three or five percent annual compound benefit increases for life. Worksite premiums do not reflect any worksite-specific discount, though some carriers offer this.
- Premium Adjustments (from our Premium Exhibit prices) by underwriting class for each participant.
- Distribution by underwriting class for each participant. Depending upon the product shown for an insurer in the Product Exhibit, we sometimes adjust that insurer’s underwriting distribution to provide readers a better expectation of likely results if they submit an application in the coming year and to line up with the prices we display. For example, if the Product Exhibit shows only a new product which has only one underwriting class (hence one price), but the insurer’s data partly or solely reflect an older product with three underwriting classifications, we might choose to show “100 percent” in their best (only) underwriting class.
- State-by-state results show the percentage of sales by state, average premium by state and percentage of policies qualifying for Partnership by state.
MARKET PERSPECTIVE (more detail in subsequent parts of the article)
Washington State’s “Washington Cares Fund” (WCF) stimulated tremendous demand for private LTCI from individuals and businesses in Washington in 2021. WCF imposes a 0.58 percent payroll tax to fund a $36,500 lifetime benefit to pay for care (intended to inflate according to the Washington consumer price index) as defined in the Revised Code of Washington 50B.04. People who purchased private stand-alone or combination LTCI by November 1, 2021 could file to be exempt from the tax. Because the WCF does not require policies to be kept in force to maintain an exemption, we collected data from contributors to study cumulative lapse rates through January 2024 (varying slightly among insurers) from 2021 sales. For the purposes of summarizing data, we segmented the lapse rate data into two groups depending on the level of lapse rates outside of Washington over the more than two-year period as follows:
“Normally-low” lapses, where lapse rates outside of Washington were roughly eight percent.
“Normally-high” lapses, where lapse rates outside of Washington were roughly 42 percent.
Table 3 shows results varied between blocks with normally-low lapses and blocks with normally-high lapses (such as some worksite programs). Blocks with normally-low lapses experienced a higher lapse rate for Washington sales than corresponding sales outside Washington, 2.37 times as much for stand-alone policies and 1.78 times as much for combo policies. On the other hand, blocks with normally-high lapse rates showed lapse rates were 39 percent lower for Washington sales than corresponding sales outside Washington. Early policy duration lapse rates that are higher (lower) than anticipated may depress (increase) unit profitability, as renewal premium flow is reduced. Underwriting and issue expenses are harder (easier) to amortize.

Table 4 shows the concentration of sales in Washington (for premiums and lives) from 2015 to 2023. In 2023, Washington sales continued to account for a higher percentage of new business (three percent of premium and 4.2 percent of lives) than in 2015-2019 (2.3 percent of premium and 2.4 percent of lives). As Washington’s market share of lives increased more than its market share of premiums, Washington’s average premium has lowered compared to other jurisdictions. Six of the seven insurers that contributed state distributions showed significantly larger Washington market share (in terms of new policies sold) in 2023 than in 2019.
Based on conversations with some brokers (special thanks for Carolyn Olson for her insights), we believe many people bought new larger policies in 2023 to replace small policies originally purchased in 2021. We will continue to monitor Washington’s market share in future years.
Table 5 shows the sales market share (for premiums and lives) from 2015 to 2023 in two neighboring states to Washington—Idaho and Oregon—to analyze the sales impact of the WCF in these states. Note in 2022, the WCF was amended to allow out-of-state residents who work in Washington to file for an exemption.
Our Idaho data continues to show increased market share in 2023 compared to 2020 and prior, whereas Oregon shows little difference across the years. However, as noted above, our jurisdiction distributions do not reflect the worksite-focused insurers; inclusion of worksite data might have shown more impact in Idaho and Oregon.
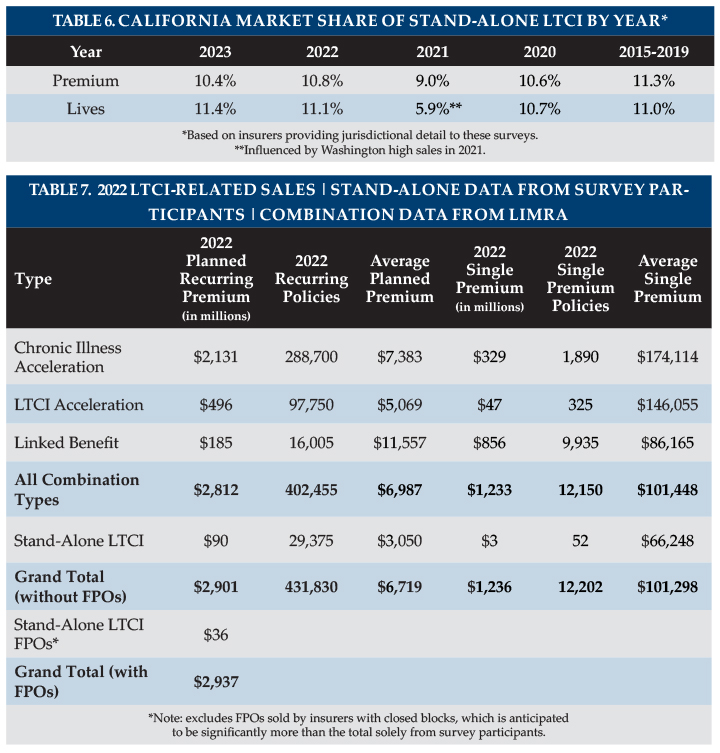
Table 6 shows the sales market share (for premiums and lives) from 2015 to 2023 in California to analyze whether there was any impact on sales due to the feasibility studies examining a potential new statewide LTCI program1,2. The most recent study was completed in 2023, in response to California AB5673 signed in October 2019, which called for a task force (TF) to “examine the components necessary to design and implement a statewide long term care insurance program.” The TF’s first meeting was in March 2021 and as it proceeded, more and more publicity ensued. As one example of the increased publicity, in August 2023, California Insurance Commissioner Ricardo Lara issued a warning letter4 regarding complaints related to “misleading marketing and communications by some long term care insurers and agents in connection with the work of the California Long Term Care Insurance Task Force.”
If the TF work stimulated sales, we might expect younger people to buy private LTCI and California’s market share by number of lives to increase more than its market share of annualized premium (similar to the pattern observed for Washington sales in 2021). Table 6 does appear to exhibit some of this pattern in recent years. In 2023 California’s market share by number of lives is the second highest and its market share by premium is the second lowest since 2015 (ignoring the 2021 aberration influenced by Washington sales).
To help provide perspective on the stand-alone market, we continued our recent history of reviewing life insurance sales with LTC-related provisions. These include:
- “Chronic Illness Acceleration” represents features which qualify under §101(g). They are prohibited to be marketed as LTCI per NAIC regulation, hence do not require brokers to be LTCI-certified. They allow a portion of the death benefit (depending on the product, perhaps as much as 100 percent) to be used for LTC-related expenses and generally use a cash-indemnity design.
- “LTCI Acceleration” features under §7702(B) can be marketed as LTCI and require brokers to be LTCI-certified. They allow a portion of the death benefit (usually one to four percent per month, generally up to 100 percent of the death benefit) to be used for LTC.
- “Linked-Benefit” features allow more than the death benefit to be used for LTC, in one (or both) of two ways. First, they might include automatic annual increases to maximum benefits (such as simple or compound increases), where the additional benefits may (or may not) reduce the death benefit. Second, they may continue LTC benefits even after the death benefit has been used up. Nearly all linked-benefit purchasers in 2022 (98.2 percent according to LIMRA) chose either benefit increases or extension of benefits or both.
Although we cover essentially the entire stand-alone LTCI market, the ten insurers contributing combo sales are a much smaller percentage of the market, hence may not be characteristic of the full market. One insurer reported a much lower average size in 2023, after having reported first-year dump-ins as new annualized premium in 2022. If we remove that outlier, the increase in annualized premium was 38 percent and the increase in policies sold was 26 percent, reflecting a 9.2 percent increase in average premium to $2,965. The increase in average new premium may reflect more 10-year-pay policies, an older average issue age, etc. Prices in the market have been dropping, resulting in a lower cost for whatever monthly maximum LTC benefit is desired. It is particularly interesting that the average premium rose despite the lower unit prices. Our single premium combo participants experienced a 5.4 percent increase in new annualized premiums, an 3.5 percent increase in the number of policies sold, and a 1.8 percent increase in average premium per policy. We do not get statistical breakdown of combo sales.
LIMRA kindly shared its 2022 combination product sales findings. Tables 7 and 8 summarize the stand-alone LTCI data from our survey alongside the LIMRA combination product data. Table 8 shows that 89.5 percent of the recurring premium policies (and more than 90 percent of the associated premium) with a LTCI-related feature were limited to acceleration of the death benefit. Of these, the vast majority were Chronic Illness riders because they can be added at no cost and without limiting distribution to LTCI-certified brokers.
Of the policies that can be marketed as LTCI, 68 percent of the recurring premium policies are on policy forms that offer only LTCI Acceleration features, whereas 96 percent of the single premium policy forms also offer extended LTCI benefits after the death benefit has been used up as LTCI.
Linked-Benefit (referred to as “LTCI Extension” by LIMRA) sales together with Stand-alone LTCI sales account for 12.4 percent of policies (including single premium policies).
Our 2022 data differs from LIMRA because we had fewer insurers and more worksite sales with chronic illness features. Excluding worksite, we have 55 to 60 percent of LIMRA’s Linked-Benefit sales and a similar average size, adjusting for the carrier that reported dump-in premium as on-going. Similarly, we have about 40 percent of recurring premium policies with LTCI Acceleration and a similar average size, but have a very small portion of LTCI Acceleration single premium policies.
Excluding our worksite policies, we have 20 percent of LIMRA’s Chronic Illness cases, but only half as much premium. Adding our worksite policies, we have 45 percent of Chronic Illness cases but only 13 percent of premium because worksite cases have much lower premium.
Linked benefit and other combination products are attractive to consumers because if the insured never has an LTC-related claim, their beneficiary will receive a death benefit. They also are more likely than stand-alone LTCI to have indemnity benefits and guaranteed premiums.
Such policies generally cost more than stand-alone LTCI if there is comparable LTCI coverage at older ages (such as age 85). However, the price difference seems to be shrinking because higher interest rates and competition appear to be driving linked-benefit prices lower while stand-alone LTCI new business prices have generally increased in recent years, especially for one-of-a-couple sales. Because of their benefit increase features, stand-alone and linked-benefit products often provide more LTC protection at older attained ages than policies which provide LTCI only through an accelerated death benefit.
In 2023, 59.3 percent of stand-alone LTCi applications went inforce, the second straight increase since an all-time low of 54.1 percent (excluding Washington applications in 2021. Nonetheless, some may still view the placement rate as problematic. Prior to 2009, two-thirds of applications were placed despite higher average issue ages (however, in that era, there were more worksite cases with limited underwriting).
Higher placement ratios are critical to encourage financial advisors to mention LTCI to clients. The following opportunities can improve placement rates.
- E-applications, which can speed submission and reduce processing time.
- Uploading medical records via human application program interface (API).
- Health pre-qualification by distributors, which can be aided by drill-down questions in on-line underwriting guides.
- Requiring cash with the application.
- Improved messaging regarding the value of LTCI and of buying now (rather than in the future).
Beyond Washinton and California, other states have taken action recently regarding possible state-run LTCI programs. Examples include:
- Minnesota received a contractor’s report regarding options to increase access to long term care financing, services, and support.
- New York SB 462 and Pennsylvania HB 844 would establish state insurance programs.
- Kentucky HR 100, Massachusetts HB 652, and Vermont H.444 would establish bodies to study feasibility of a state insurance program. Connecticut SB245 would study LTC needs, not specifically LTCI.
Future state LTCI programs will likely differ from WCF in several respects. For example, based on draft laws and task force discussions in other states, they:
- May not leave the window open for people to opt out by buying LTCI after the legislation has been signed.
- May require that private LTCI policies remain in force to maintain exemption.
- May narrow the range of private LTCI policies that qualify for exemption.
The FPO (future purchase option, a guaranteed, or a non-guaranteed board-approved, option, under specified conditions, to purchase additional coverage without demonstrating good health) election rate rose to 86.3 percent, which is in line with what the same insurers reported in the past.
Considering such FPOs and other increased coverage provisions, we project a maximum benefit at age 80 of $334/day for an average 57-year-old purchaser in 2023, which is equivalent to an average 2.9 percent compounded benefit increase between 2023 and 2046. Inflation appears to be more of a concern now. As discussed later, purchasers may be disappointed if the purchasing power of their LTCI policies deteriorates over time.
Current premiums are much more stable than past premiums, partly because today’s premiums reflect much more conservative assumptions based on far more credible data. The Policy Exhibit shows, for each insurer, how long ago the most recent policy was issued that has had a price increase and how long ago the currently-issued product was priced. No participant has raised prices for policies issued in 2017 or later. Additionally, it has been three years since any participant released new prices for new sales. Financial advisors may not be familiar with the greatly improved stability of LTCI premiums, hence may be reluctant to encourage clients to consider LTCI because the advisors fear steep price increases.
Some insurers of older inforce polices are also exploring strategies around rate stability. As one example, New York Life made old inforce blocks non-cancelable (guaranteed to have no future rate increases) in states which approved their full most recent (second) rate increase on those policies, even if the increase was required to be phased in over several years. This premium rate guarantee even applies to the oldest policyholders (ages 74 and older) who were exempted from the rate increase.
All insurers in our Product Exhibit offer coverage in all U.S. jurisdictions, except two of them do not offer policies in New York.
This year, we asked insurers how many declines are successfully appealed. Three insurers responded, with percentages ranging from 2.7 to four percent. We asked what percentage of “non-frivolous” underwriting appeals are reversed, a question which insurers likely interpreted differently. One insurer’s data indicated 37 percent while another’s indicated 82 percent.
CLAIMS
Independent Third-Party Review (IR) is intended to help assure that LTCI claims are paid appropriately. Since 2009 (in some jurisdictions), if an insurer concludes that a claimant is not chronically ill as defined in the LTCI policy, the insurer must inform the claimant of his/her right to appeal to IR, which is binding on insurers.
In many states, IR is not effective, either because the law was not adopted or because regulators have not set up the required panel of independent reviewer organizations (IROs). Nonetheless, a claimant could ask an insurer to agree to IR.
The Product Exhibit shows that most participants extend IR beyond statutory requirements (e.g., to policies issued prior to the effective date of IR). Some insurers hire IROs to provide another set of eyes as part of the insurer’s internal appeal process.
A very small percentage of claims go to IR. Some insurers say they have never had a request for IR.
We are not aware of regulators who track IR results, but Steve LaPierre, President of LTCI Independent Eligibility Review Specialists, LLC (LTCIIERS), the largest IR organization, reports that they upheld the insurer’s decision 98 percent of the time in 2022.
For comparison, a National Nurses United study of CA acute health claims1 indicates that IR upheld half of their denials. Acute health insurance and LTCI claims are denied for different reasons which likely explains much of the difference in the rate at which the insurers’ decisions are overturned.
The LTCI industry’s IR experience suggests that insurers, overall, are paying claims appropriately.
Eight participants reported 2023 claims. As some companies are not able to provide complete detailed data, some statistics reported below are more robust than others.
The eight entities’ combined individual and multi-life and group claim payments were 9.3 percent higher than in 2022, based upon 1.9 percent more claimants, resulting in a 7.2 percent increase in the average individual and multi-life claim payment. The average group claim payment saw a much larger 29 percent increase but reflects more volatility from a smaller number of claimants.
The LTCI industry has paid out benefits to policyholders far greater than indicated in the following statistics, because most claims are paid by insurers that do not currently sell LTCI.
Our claims represent about 10 percent of claims paid by the industry. LTCI claims paid by insurers no longer selling LTCI may differ significantly from the following statistics as their claimants are more likely to have facility-only coverage, be older, and/or have other different policy or demographic characteristics.
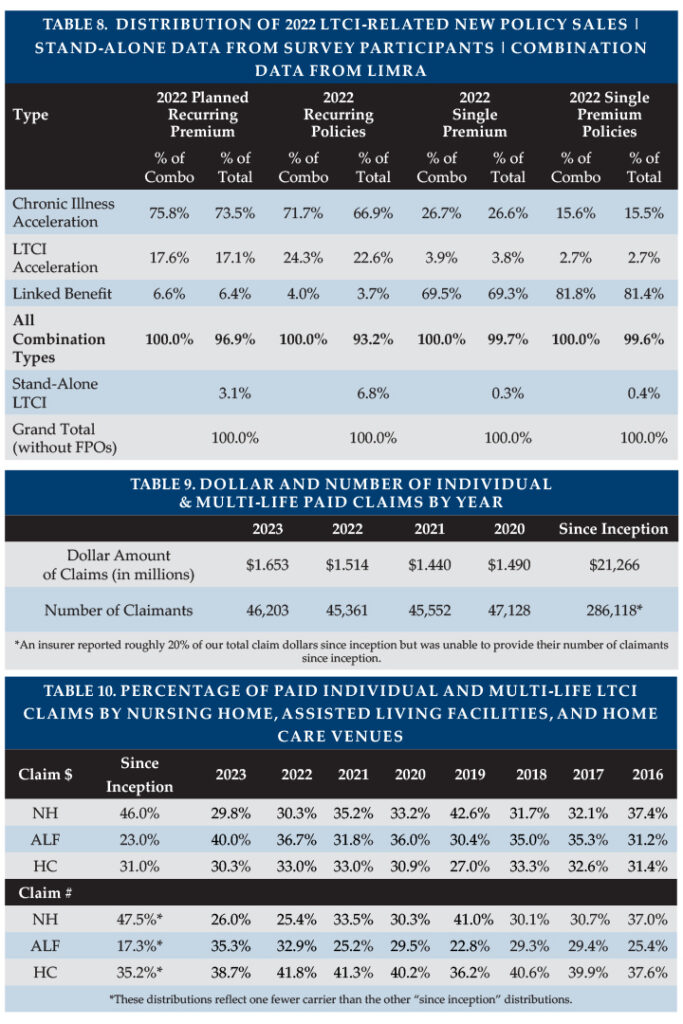
Table 9 shows the total dollar and number of reported individual and multi-life (not group) LTCI claims. Table 10 shows the percentage paid by venue. In both tables, “since inception” means since the insurer first started selling LTCI or as far back as they can report these results (for example, they may have changed claims administration systems and not be able to go all the way back to when they first processed claims).
Table 10 shows that home care and adult day care (collectively “HC” in Table 10) account for the highest percentage of 2023 claims (38.7 percent) but the second-most percentage of 2023 claim dollars (30.3 percent). Assisted Living Facilities (ALFs) account for the second-most percentage of 2023 claims (35.3 percent) but the highest percentage of claims dollars (40.0 percent). Despite the shift away from nursing homes to ALFs, nursing homes still account for the largest percentage of inception-to-date claims numbers (47.5 percent) and claims dollars (46.0 percent).
Trends can be obscured because different insurers may report claims data over the years and insurers refine how they report data. For example, we learned in 2021 that one insurer previously assigned all of a claimant’s benefits based on the venue in the claimant’s first month of claim, which implies the shift from NH to ALF since 2020 is greater than the table indicates.
In the distribution based on number of claims, a person who received care in more than one venue is counted once for each venue, but not double-counted in the total line. The average claimant is in 1.5 types of venues during the course of the claim; this does not recognize multiple providers within a single type of revenue (e.g., two nursing homes).
Six carriers reported the number of open individual claims at year-end. Open claims at year-end 2023 averaged 78 percent of the number of claimants served at any point during 2023, an increase from 70 percent the past few years.
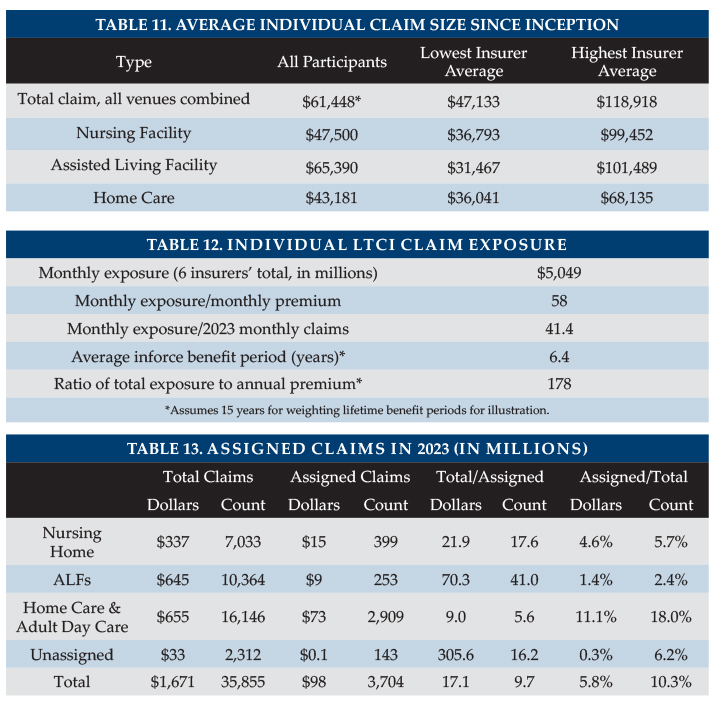
Table 11 shows average size individual claims since inception: that is, including older claims and reflecting all years of payment. One participant refined its reporting this year, causing comparisons to prior years to not be meaningful.
Because some claimants submit claims from more than one type of venue, the average total claim might be expected to exceed the average claim paid for any particular venue. Individual ALF claims stand out as high each year, probably because:
a) ALF claims appear to have a longer duration compared with other venues.
b) Nursing home costs are most likely to exceed the policy daily/monthly maximum, hence nursing home claims are most likely to understate actual cost of care.
c) People who maximize the use of their maximum monthly benefits can generally spend as much in an ALF as in a nursing home.
d) Although some surveys report that on average ALFs cost about half as much as nursing homes, ALFs may have an extra charge for a memory unit or for levels of assistance that align more closely with nursing home care.
Several insurers extend ALF coverage to policies which originally did not include ALF coverage, providing policyholders with significant flexibility at the time of claim but contributing to the insurers’ need for rate increases.
The following factors contribute to a large range of average claim by insurer (see Table 11):
- Different markets (by affluence; worksite vs. individual; geography; etc.)
- Demographic differences (gender; issue age; age of their block of business)
- Distribution by benefit period, benefit increase feature, shared care, and elimination period. For example, one carrier has a higher average home care claim than its average facility claim, because people who added the home care rider were more likely to add compound “inflation” also.
- Distribution by facility-only policies vs. 50 percent home care vs. 100 percent home care vs. home care only.
- Differences in the ways insurers report claims.
The following factors cause our average claim sizes to be understated:
- Approximately 16 percent of inception-to-date individual claims are still open and our data does not include reserve estimates for future payments on open claims.
- People who recover, then go on claim again, are counted as multiple insureds, rather than adding their various claims together.
Besides being understated, average claims data does not reflect the value of LTCI benefits from some purchasers’ perspectives, because the many small claims drive down the average claim. LTCI provides significant financial yield for most people who need care one year or longer. A primary purpose of insurance is to protect against adverse results, so the amount of protection, as well as average claim, is important.
Six insurers provided current individual monthly LTCI claim exposure (note: the data reflects only initial monthly maximum for one insurer). As shown in Table 12, this figure is 28 times their corresponding monthly LTCI premium income and 41.4 times their 2023 LTCI monthly paid claims. Seven insurers contributed inforce distribution by benefit period. Treating endless (lifetime benefit periods) as a 15-year benefit period, their average inforce benefit period has reduced to 6.4 years, ignoring Shared Care. Increasing the assigned value of the endless benefit period by one year raises the average inforce benefit period approximately 0.23 years. With annual exposure 28 times annual premium and an average benefit period of 6.4 years, we estimate total exposure is 178 times annual premium.
The current average individual maximum monthly maximum benefit for claimants seems to be in the $4,900 to $8,500 range.
Nursing home (NH) claims are more likely to use the policy’s maximum daily/monthly benefit than ALF claims because ALF daily/monthly costs are generally lower and because policies sometimes have lower maximums for ALFs. ALF claims correspondingly are more likely to use the policy maximum than are adult day care and home care claims.
A person might think LTC providers can fully answer the question “how much do insurers pay for LTC?” However, providers likely know only how much they receive from insurers (assigned payments), not amounts clients pay that is subsequently reimbursed from insurers. In this year’s survey, we decided to study assignments (Table 13). Five insurers contributed data.
Based on 35,855 claims, the reported data indicated 5.8 percent of claims dollars and 10.3 percent of the count of claims were assigned; in other words, total claim dollars are roughly 17 times what is assigned to providers and the total number of claims is 10 times the number that are assigned. We asked two insurers with large closed blocks (each larger than the data in our table) for their experience as additional data points for comparison. One insurer estimated similar percentages: roughly six percent of facility claim dollars and roughly 10 percent to 15 percent of home care claim dollars were assigned. The other insurer estimated that roughly 13 percent of their claim dollars were assigned.
Home care claims are roughly 4.5 times as likely to be assigned as facility claims, and, for each venue, small claims are more likely to be assigned than large claims.
It may be disadvantageous for providers when nursing home claims are assigned if the LTCI policy does not cover the full provider rate, as the provider would have to bill the family as well. Insurers may not prefer facility claims to be assigned if the facilities want to be paid in advance; in addition to the loss of potential investment income, insurers have difficulty recovering overpayments if a claimant does not stay in the facility for the full month. In contrast, home care claims are billed in arrears and policy benefit limits are more likely to exceed home care charges than nursing home charges.
SALES STATISTICAL ANALYSIS
Bankers Life, Knights of Columbus, Mutual of Omaha, National Guardian, New York Life, Northwestern and Thrivent contributed significant background stand-alone LTCI sales data, but some were unable to contribute some data. LifeSecure provided only total stand-alone sales, not distributions.
Sales characteristics vary significantly among insurers based on market differences (individual vs. worksite, affluence, gender distribution, etc.). Year-to-year variations in policy feature distributions may reflect industry trends but may also reflect changes in participants, participant practices and designs, participant or worksite market shares, etc. The 2021 sales also exhibit major variance from historical results due to Washington sales. Statistical differences between the worksite and non-worksite sales will be reported in the September/October issue of Broker World.
Market Share
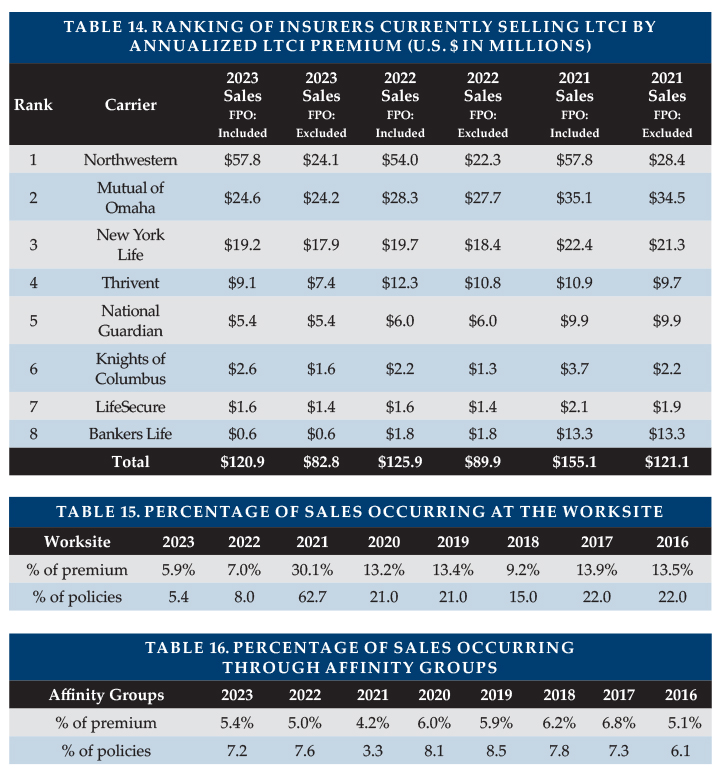
We include purchased increases on existing policies as new premium because new coverage is being issued. Table 14 shows 2023 new premium, both including and excluding FPOs.
The stand-alone market continues to consolidate, as well as shrink. Northwestern accounted for 48 percent of annualized new premium, while Mutual of Omaha maintained its lead in annualized premium from new policies (by $100k) while continuing to sell the most policies (29 percent; see Policy Exhibit). The top 3 insurers had 84 percent market share, compared to 81 percent in 2022 and 74 percent in 2021. Excluding FPOs, the concentration is lower, 80 percent in 2023. The premium in table 14 includes 100 percent of recurring premiums plus 10 percent of single premiums.
Worksite Market Share and Average Premium
The percentage of 2023 sales that occurred in the worksite was the lowest ever, with four insurers reporting 2023 worksite sales. The worksite market has gravitated toward life insurance policies with an accelerated death benefit, as will be covered in the September/October article.
Worksite sales normally consist of three different markets as outlined below, the first two of which produce a higher percentage of new insureds than of new premiums.
- Voluntary group coverage generally is less robust than individual coverage.
- Core/Buy-Up programs have particularly young age distributions and modest coverage because a lot of people do not buy-up and are less likely to insure spouses.
- Executive carve-out programs generally provide the most robust coverage. One-or two-couple executive carve-out sales may not qualify for a multi-life discount with some insurers, hence may not be labeled as worksite sales in submissions to our survey.
The amount of worksite sales reported, the FPO activity, the degree to which insurers report worksite distributions, and the distribution of worksite sales among the above-described sub-markets significantly impact sales characteristics. Our participants’ (insurers which provided sales distributions) average annual premium on new worksite policies was $2,271, but contributors that provided sales, but not distributions, had an average premium of $1,476. That average premium discrepancy makes clear that our sales distributions do not reflect the insurers focusing in the group voluntary and core/buy-up markets.,
The 5.9 percent of premium attributed to worksite sales in Table 15 includes FPOs. Limiting all premium to new policies, the worksite premium market share is 3.2 percent. More information about worksite sales will appear in Broker World magazine’s September/October issue.
Affinity Market Share
Affinity groups (non-employers such as associations) produced 5.4 percent of participants’ 2023 premium and 7.2 percent of policies.
Characteristics of Policies Sold
Average Annualized Premium Per Sale
To determine the average annualized premium for new sales, we exclude FPOs and single premium policies, except where noted otherwise. As shown in Table 17, the average premiums in 2022 and 2023 have been higher relative to historical because of fewer small worksite policies and higher unit prices post-2020.
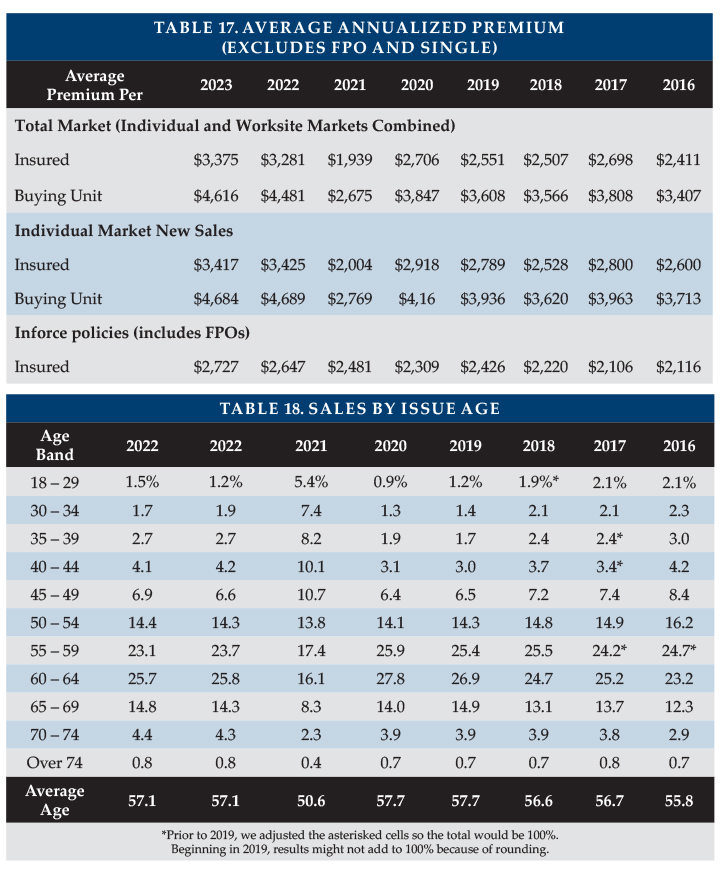
The influence of small worksite policies is greatly reduced now. Removing the primary insurer in that market produces an average premium per insured of $3,375, as shown in Table 17. Including this carrier produces an average premium of $3,342. Note, the difference between the average premium per buying unit and per insured is larger in the individual market because the individual market has more couples who both buy, which influences the results in Table 17 when reviewing results across the total market and individual market.
The jurisdiction with the lowest average new premium for participants in 2023 (including FPOs and counting 100 percent of single premiums) was Washington ($3,609), followed by Puerto Rico ($3,850), and Mississippi ($3,954). The jurisdiction with the highest average premium was Connecticut ($7,211), which would have been third if single premiums were excluded, followed by Wyoming ($7,167), Minnesota ($6,585), North Carolina ($5,991), Pennsylvania ($5,971) and Illinois ($5,926).
Issue Age
Table 18 shows the average issue age remained 57.1. Note: one survey participant has a minimum issue age of 40, one will not issue below 30, and one will not issue below 25.
Benefit Period
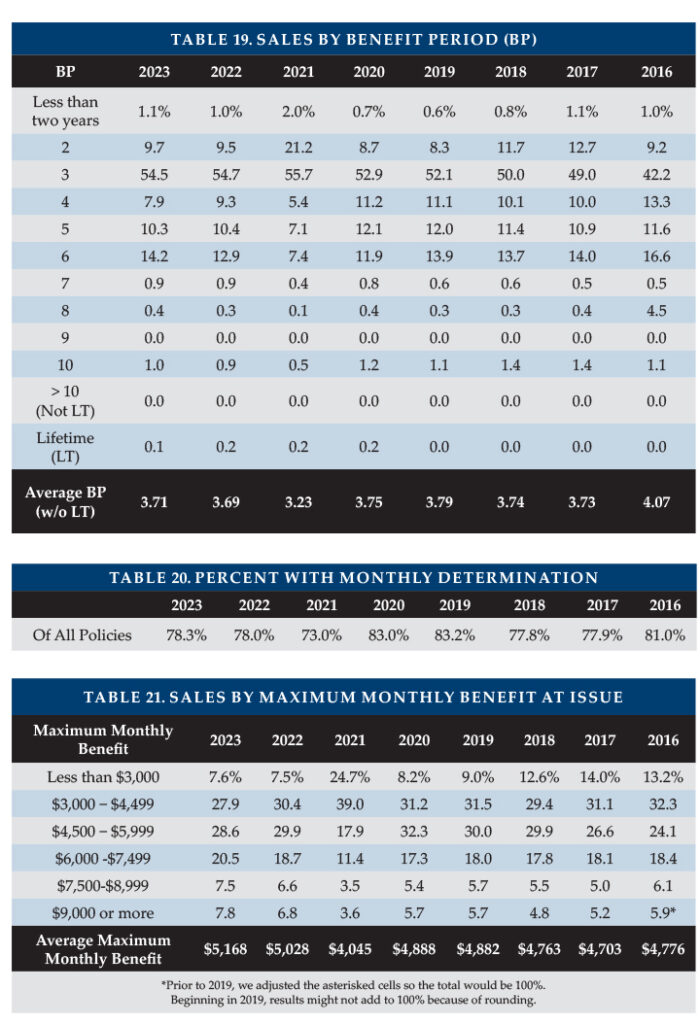
Table 19 shows that the average benefit period remained similar to last year, with the largest changes occurring for the 4-year and 6-year policies.
Monthly Benefit
Monthly determination continued to be roughly 78 percent of new policies (Table 20). With monthly determination, low-expense days preserve more coverage to use for high-expense days, offering more flexibility for insureds. One insurer offers only daily determination; one insurer offers a choice; and the other insurers automatically have monthly (or weekly) determination.
Sales in 2023 set a record average maximum monthly benefit ($5,168), as shown in Table 21. Sales with an initial monthly maximum of $9,000 or more ranged from a low of three percent of sales for one insurer to a high of 13.3 percent for another.
Benefit Increase Features
Table 22 generally shows reduced inclusion of pre-paid benefit increase features (i.e., total of rows in Table 22 excluding sales for no benefit increases and FPOs) in 2023 stand-alone LTCI policies.
“Indexed Level Premium” policies are priced to have a level premium, but the benefit increase is tied to an index such as the consumer price index (CPI).
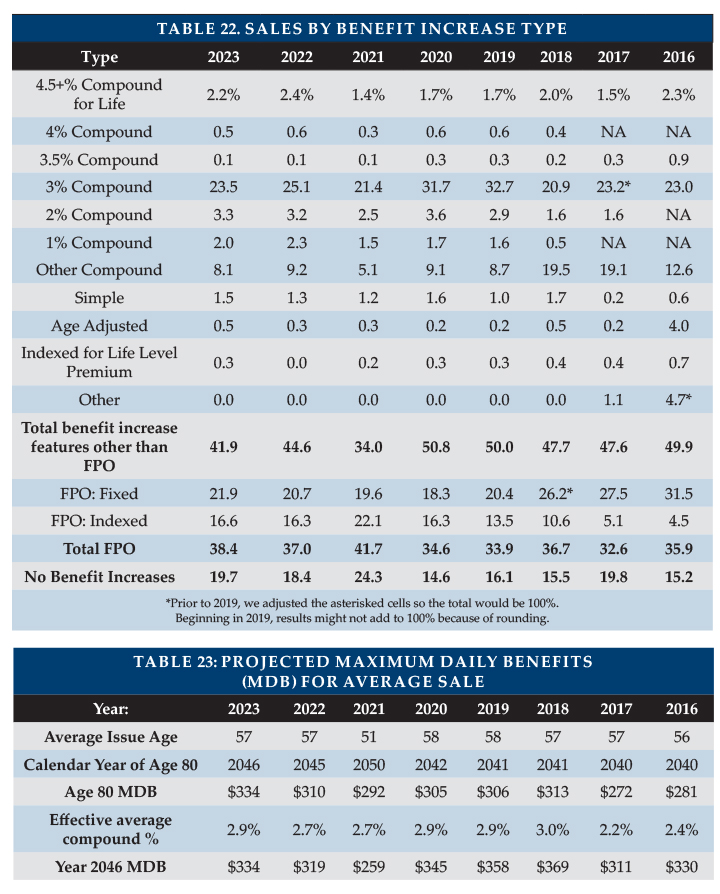
A person’s amount of LTCI coverage in their elder years is critical. Therefore, each year, we estimate the amount of coverage an average buyer would have at age 80. We project the age 80 maximum daily benefit by increasing that year’s average initial maximum daily benefit (MDB) from the average issue age to age 80, according to that year’s distribution of benefit increase features, using current future purchase option (FPO) election rates and a five percent per year offer for fixed FPOs. Table 23 shows the projected maximum benefit in 2046 (at age 80) for our 2023 average 57-year-old purchaser ($334/day; equivalent to 2.9 percent compounding) and corresponding results for prior years.
To compare the eventual purchasing power of each year’s average purchase, we used the same methodology to estimate the maximum daily benefit in 2046, also shown in Table 23. While an average 2023 buyer would have $334 of MDB in 2046, an average 2022 buyer would have $319 of MDB and an average 2021 buyer $259 of MDB, but an average 2020 buyer would have $345 of MDB.
With greater potential concern about inflation given the current economic environment, consideration of benefit increases likewise may grow more important. People are likely to be disappointed if cost of care grows faster than the protection built into their policy.
FPOs (Table 24) can play an important role in maintaining insureds’ purchasing power. In 2023, 86.3 percent of FPOs were elected, generally in-line with these contributing insurers’ prior experience. The high election rate is particularly noteworthy as the cost increases each year due to larger coverage increases each year, increasing unit prices due to age, and possibly rate increases.
Negative-election FPOs activate automatically unless the client rejects them. Positive-election FPOs activate only if the client initiates a timely request. The high election rate reflects the effectiveness of annual (as opposed to triennial) negative-election provisions (particularly those which can be lost prospectively if not currently exercised) and may reflect the importance of LTCI to policyholders, especially in an inflationary environment.
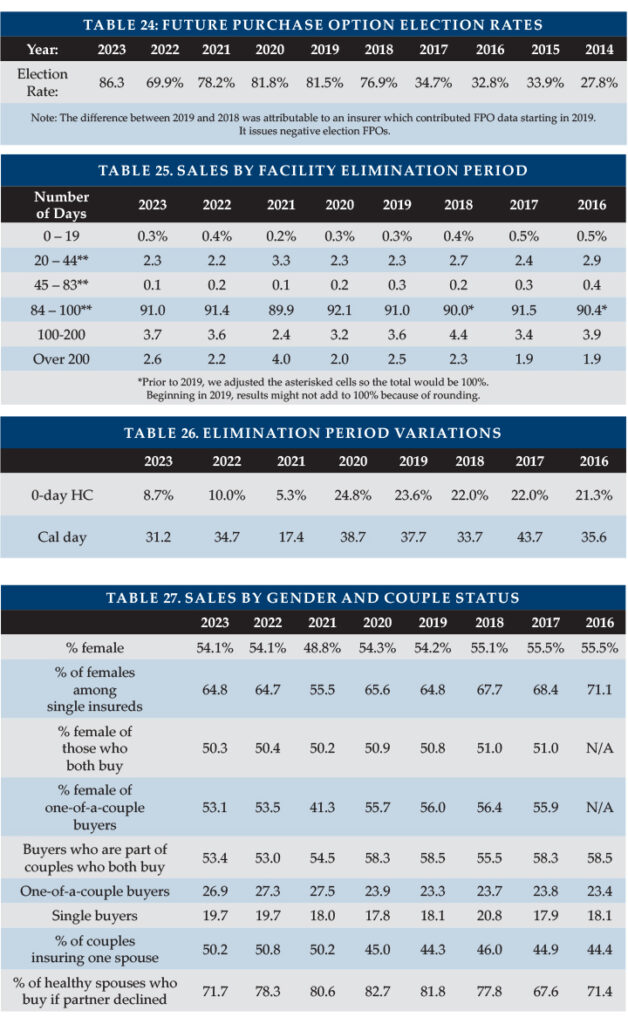
One participant had an election rate over 90 percent, but two insurers had election rates of 27 to 29 percent.
FPOs can also be important to insurers as well. One insurer got 58 percent of their new premium from FPO elections.
Elimination Period
Table 25 summarizes the distribution of sales by facility elimination period (EP), which shows some increasing trend for EPs of 200+ days. Two insurers saw more than five percent of their buyers chose EPs longer than 200 days.
Table 26 shows the percentage of new policies with zero-day home care elimination period (but a longer facility elimination period). The purchase rate of an additional-cost zero-day home care EP option is sensitive to the price. The higher percentages prior to 2021 reflect an insurer which stopped selling LTCI.
Table 26 also shows the percentage of new policies with a calendar-day EP. Calendar-day EP provisions count a day toward the EP if you need care, even if you do not get commercial care. Service-day EPs count only days on which commercial care is received. However, most calendar-day EP provisions require an up-front paid-service day to start counting.
Sales to Couples and Gender Distribution
Table 27 summarizes the distribution of sales by gender and partner status. The sales show a smaller percentage (71.7 percent in 2023 vs. 78.3 percent in 2022) of healthy spouses bought policies when their partner was declined. Otherwise, the 2023 sales distributions were similar to 2022.
Shared Care and Other Couples’ Features
Table 28 summarizes sales of Shared Care and other couples’ features.
- Shared Care allows one spouse/partner to use the other’s available benefits if their own coverage has been depleted or offers a third independent pool the couple can share.
- Survivorship waives a survivor’s premium after the first death if specified conditions are met (such as having been inforce for 10 or more years).
- Joint waiver of premium (WP) waives both insureds’ premiums if either insured qualifies for benefits.
Changes in distribution by carrier can greatly impact year-to-year comparisons (Table 28). Some insurers embed survivorship or joint waiver automatically (sometimes only for particular circumstances such as if Shared Care is purchased), while others offer it for an extra premium or do not offer the feature.
In the top half of Table 28, percentages are calculated based on the total number of policies sold to couples who both buy (for Shared Care, only those who buy a limited benefit). The percentages in the bottom half of Table 28 reflect only the sales from insurers offering that particular feature.
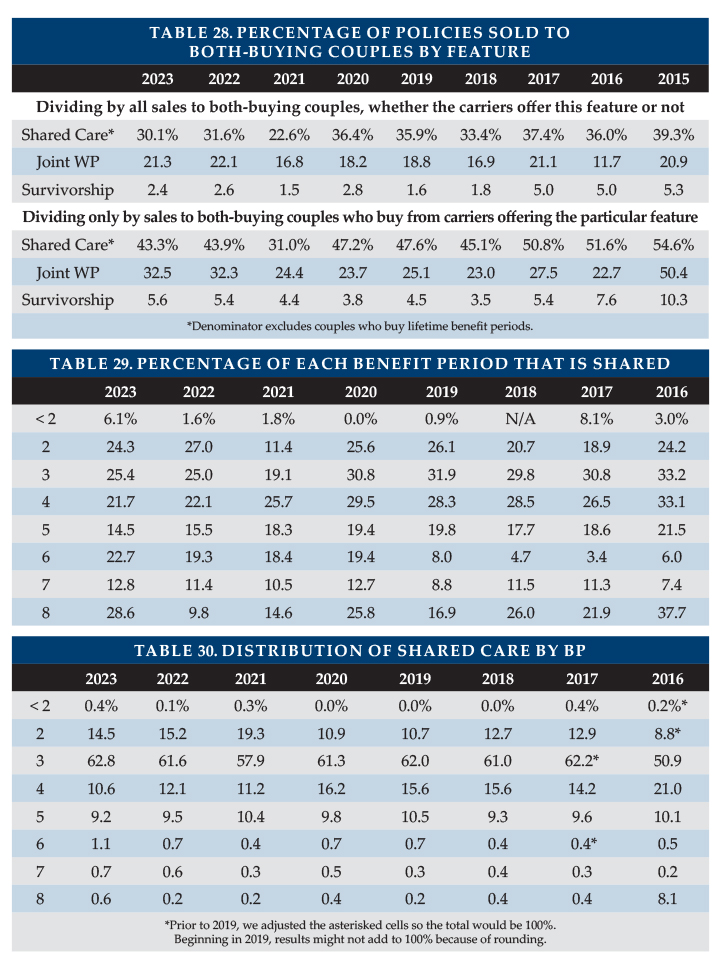
For insurers reporting Shared Care sales, the percentage of both-buying couples who opted for Shared Care varied from 9.9 percent to 72.1 percent. The corresponding percentage of couples with Joint WP varied from eight percent to 100 percent and for Survivorship ranged from 2.5 percent to 14.2 percent.
Tables 29 and 30 provide additional breakdowns on the characteristics of Shared Care sales. Table 29 shows the percentage of each benefit period that included Shared Care. Table 29 shows low percentages of Shared Care, partly because its denominator includes all policies, even those sold to single people or one of a couple.
Table 30 looks only at Shared Care policies and reports their distribution across benefit period, so the percentages must total 100 percent. As most policies have three-year benefit periods, most Shared Care policies had a three-year benefit period.
Shared Care is generally more concentrated in two- to four-year benefit periods than are all sales. Couples often buy shorter benefit periods because they plan to help care for each other and expect the male partner to not need care for a long time. With Shared Care, if the male dies without using all his coverage, his unused coverage is available for the surviving female. As shown in Table 27, single buyers are more likely to be female and females are more likely to opt for a longer benefit period.
In 2023, sales generally showed a downtick in the percentage of short benefit period policies that included Shared Care and saw an uptick in Shared Care among longer benefit period policies.
Existence and Type of Home Care Coverage
Three participants reported sales of facility-only policies, which accounted for 0.4 percent of total sales. For many years, one insurer has been responsible for more than 80 percent of such sales. Most (96 percent) comprehensive policies included home care benefits equal to the facility benefit, while the other policies had a home care benefit at least 50 percent of the nursing home benefit. The most recent home-care-only sale in our survey was sold in 2018.
Other Characteristics
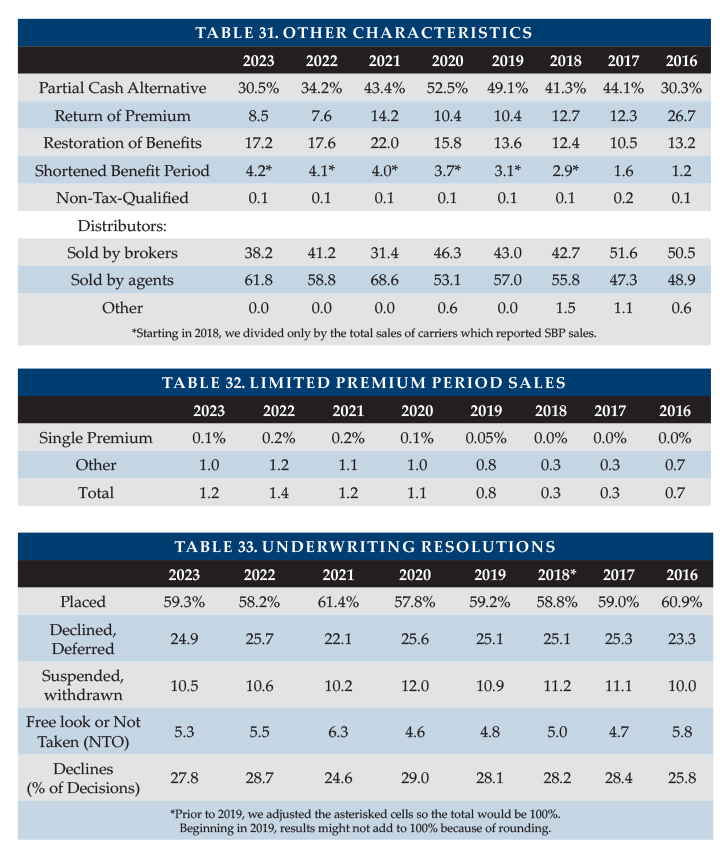
Two insurers offer Partial Cash Alternative features, which allow claimants, in lieu of any other benefit that month, to use 25 to 30 percent of their coverage for whatever purpose they wish. Table 31 shows Partial Cash Alternative features were included in fewer policies due to a change in market share among participants.
Two insurers offer an additional (not an alternative as indicated above) benefit that is a cash benefit. Only 0.3 percent of polices included that feature.
Return of premium (ROP) features were included in 8.5 percent of policies. ROP returns some or all premiums (usually reduced by paid LTCI benefits) when a policyholder dies. Roughly 74 percent of ROP features were embedded automatically in the product. Embedded features are designed to raise premiums minimally, typically decreasing the ROP benefit to $0 by age 75. For the survey participants, 20 percent of ROP features would pay benefits for death after age 75.
Restoration of Benefits (ROB), which restores used benefits when the insured has not needed services for, typically at least six months, was included in 17.2 percent of policies with limited benefit periods. Roughly 90 percent of ROB features were automatically embedded.
Insurers must include shortened benefit period (SBP) coverage unless buyers specifically decline the feature. SBP coverage makes limited future LTCI benefits available to people who stop paying premiums after three or more years. Most (95.8 percent) buyers refused SBP. (Note: Contingent SBP coverage is included automatically at no cost.)
Only one insurer issued non-tax-qualified (NTQ) policies, which accounted for 0.1 percent of total industry sales.
“Captive” (dedicated to one insurer) agents produced 61.8 percent of the sales. Brokers produced the balance. At one time, “captive” agents who sold LTCI tended to specialize in LTCI. Now many are agents of mutual companies.
Limited Pay and Paid-Up Policies
In 2023, two insurers in the survey sold policies that become paid-up in 10 years or less, accounting for 1.2 percent of sales.
Because today’s premiums are more stable compared to policies sold years ago, premium increases are less likely. One of the key reasons for buying 10-year-pay (avoidance of rate increases after the 10th year) is greatly reduced, while the cost of 10-year-pay has increased, making it less attractive for consumers than in the past. Nonetheless, limited-pay and single-pay policies are attractive to minimize post-retirement outflow and to accommodate §1035 exchanges.
Eight participants reported that roughly four percent of their 2023 inforce policies are paid-up, similar to 2022.
When someone applies to Medicaid for long term care services, most states with Partnership programs disregard assets up to the amount of benefits received from a Partnership-qualified policy (some Indiana and New York policies disregard all assets). Except for California, states with Partnership programs grant reciprocity to Partnership policies issued in other jurisdictions. Partnership programs are approved in 44 jurisdictions, all but AK, DC, HI, MA, MS, UT, and VT. However, MA has a similar program (MassHealth).
Four states (CA, CT, IN and NY) blazed the trail for Partnership programs in the early 1990s. Other states were allowed to adopt simplified and more standardized Partnership regulations by the Deficit Reduction Act of 2005 (DRA).
More than 60 percent of Partnership states allow one percent compounding to qualify for Partnership, which can help low-budget buyers qualify for Partnership and also enable worksite core programs to be Partnership-qualified. A higher percentage of policies will qualify for Partnership in the future if insurers and advisors leverage these opportunities. Currently three insurers offer one percent compounding.
Partnership programs could be more successful if:
- Advisors offer small maximum monthly benefits more frequently to middle-income individuals. For example, a $1,500 initial maximum monthly benefit covers about 1.5 hours of home care per day and, with compound benefit increases, may maintain buying power. Many middle-income individuals would like LTCI to help them stay at home while not “burning out” family caregivers and could be motivated further by Partnership asset disregard. (This approach does not work in CA, CT, IN and NY because of their high Partnership minimum daily benefit requirements.)
- Middle-income prospects were better educated about the importance of benefit increases to maintain LTCI purchasing power and qualify for Partnership asset disregard.
- The four original Partnership states migrate to DRA rules.
- More jurisdictions adopt Partnership programs. (AK, HI, MA, MS, VT, and DC do not have Partnership programs, but MA has its MassHealth program which is similar.)
- Programs that privately finance direct mail educational LTCI content from public agencies were adopted more broadly.
- Financial advisors were to press reluctant insurers to certify their products and offer one percent compounding.
- More financial advisors were certified. Some people argue that certification requirements should be loosened. At a minimum, the renewal certification process could be improved.
- Linked benefit products became Partnership-qualified.
PARTNERSHIP PROGRAM SALES
Participants reported Partnership sales in 41 states, all Partnership-authorized states except CA, CT and NY. No insurer reported Partnership sales in more than 38 states and one insurer issues no Partnership policies.
Insurance brokers do not have access to Partnership policies in CA, CT and NY and from only one insurer in IN. However, consumers may be able to purchase Partnership-qualified coverage from another entity.
As shown in the Sales Distribution by Jurisdiction table of participants sales in DRA states, 46.4 percent qualified for the Partnership. Rhode Island (75.8 percent) exceeded perennialleader Minnesota (74.1 percent) for the highest percentage of Partnership-qualified sales. Maine (73.5 percent) also had more than 70 percent and North Dakota had 69.9 percent. Ten states had between 60.0 percent and 62.5 percent and another nine had more than 50 percent but less than 60 percent qualify. Fifteen states had 20 to 50 percent qualify. New Mexico (7.6 percent), Utah (12.0 percent), Indiana (13.6 percent) and West Virginia (18.7 percent) were the only DRA states in which fewer than 20 percent qualified.
UNDERWRITING DATA
Case Disposition
Five insurers contributed application case disposition data to the survey (Table 33). Case resolutions improved in 2023 with 59.3 percent placed and 24.9 percent declined or deferred, compared with 58.2 percent and 25.7 percent in 2022. One insurer placed 77 percent of its cases; the others placed 47 to 56 percent.
Of cases which were resolved, 27.8 percent were declined or deferred, with the percentage varying from 14.2 percent to 36.1 percent, depending on insurer. To the degree that a declined applicant got coverage elsewhere or a deferred applicant was ultimately approved, the eventual placement rate for applicants is higher than our data indicates.
Overall, 15.8 percent of cases were suspended or withdrawn during underwriting or not accepted or dropped during the free look period. That is the lowest percentage since 2019.
Factors such as age distribution, distribution system, market, underwriting requirements, and underwriting standards affect these results.
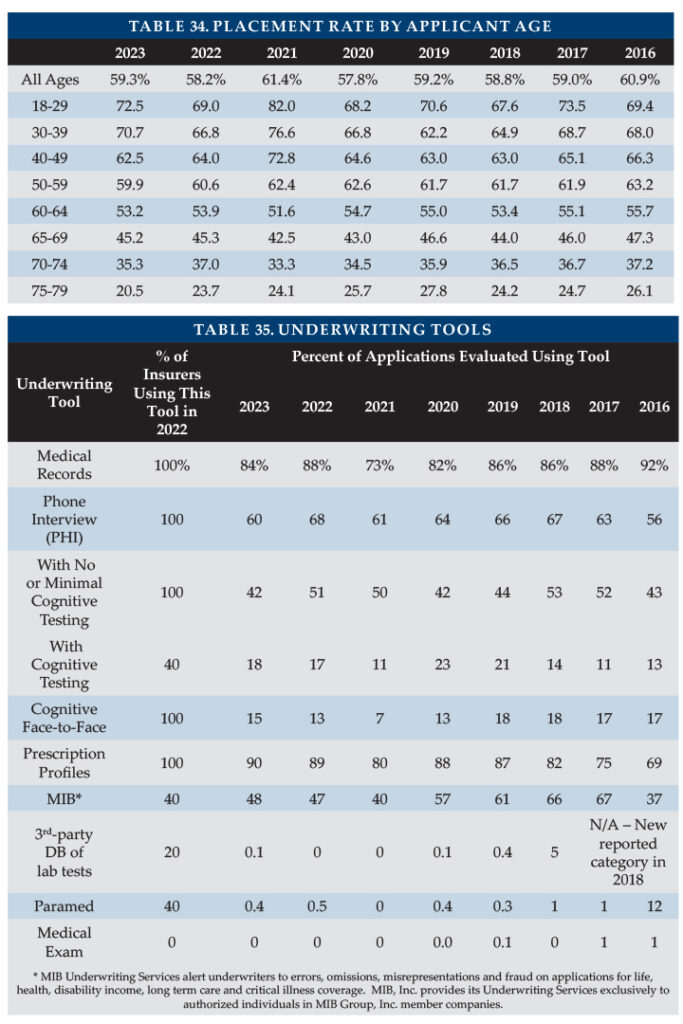
Table 34 shows the placement rate by applicant age. This data is a subset of the data in Table 33 and the “All Ages” line, as some carriers cannot provide this data by age. While the placement rate increased overall (i.e., all participants, all ages combined), the placement rate for the insurers that provided data by age decreased for ages above 40.
Low placement rates increase insurers’ cost per placed policy. More importantly, low placement rates discourage advisors from discussing LTCI with clients. In addition to not wanting to waste time and effort, advisors may fear that declined clients will be dissatisfied. In the Market Perspective section, we listed ways to improve placement rates. This is a critical issue for the industry. If readers have suggestions, they are invited to contact the authors.
Underwriting Tools
Five insurers contributed data to Table 35, which divides the number of uses of each underwriting tool by the number of applications processed. For example, the number of requested medical records was 84 percent of the number of applications. Fewer than 84 percent of applications involved medical records, because some applications involved multiple medical records.
Year-to-year changes in distribution of sales among insurers significantly impact results. Lower maximum ages result in fewer face-to-face exams. Insurers might underreport the use of an underwriting tool because they may lack a good source for that statistic. For example, an insurer might not be able to split phone interviews by whether or not they include cognitive testing.
Underwriting Time
Table 36 shows that for five insurers, the average processing time, from receipt of application to mailing the policy, decreased to 47 days.
Rating Classification
Table 37 suggests continued overall trend to issue policies with an insurer’s “better,” lower priced underwriting classification. The percentage of decisions either declined or placed in the 3rd-Best or “less-attractive,” higher priced classifications reduced consistently.
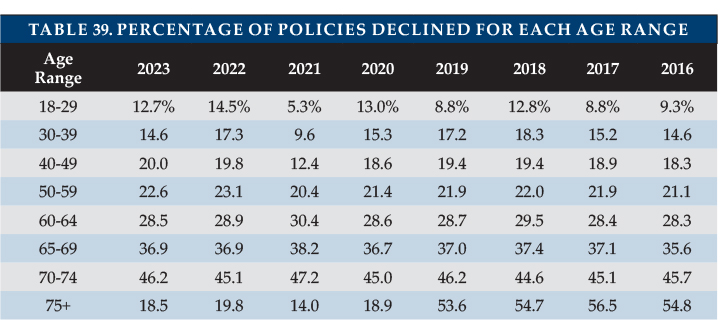
For each issue age group, Table 38 shows the percentages of policies issued in the most favorable category and Table 39 shows the decline rate. These tables do not exactly match Table 37 because some participants provide all-age data, rather than separating it by age. The percentage placed in the most favorable classification continues to generally improve within each issue age group, which may be at least partly attributable to fewer insurers offering preferred discounts compared to the past.
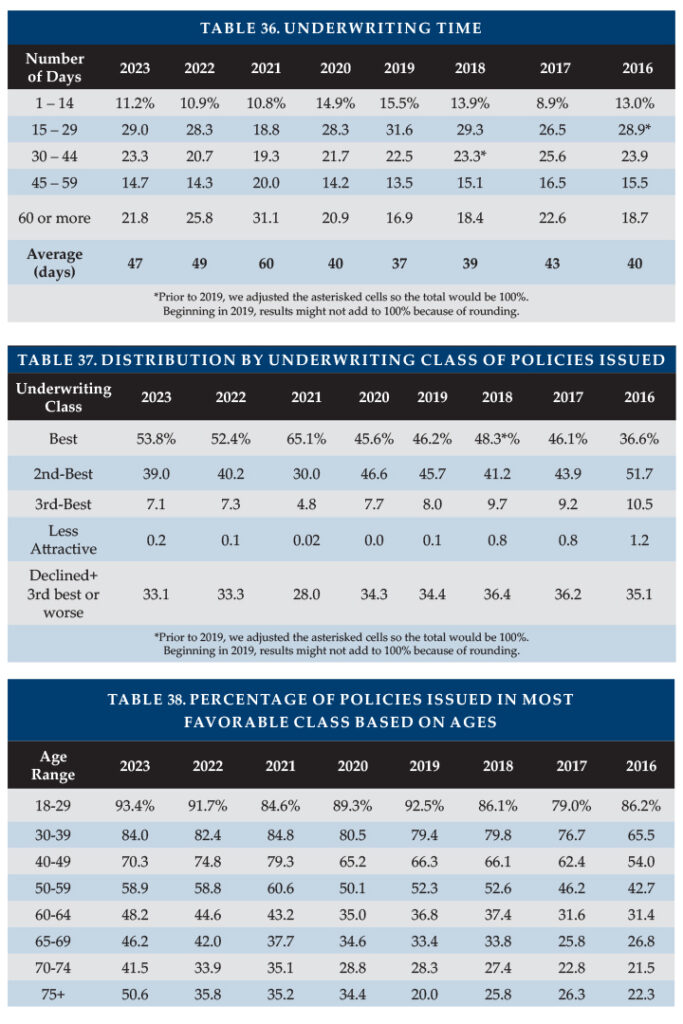
For each issue age group, Table 39 shows the percentages of policies declined. The decline rate dropped in 2023 for most age groups. For the past 4 years, the percentage placed in the most favorable classification has been higher for ages 75+ than for ages 70-74 and the decline rate has been lower. The age 75+ block is the smallest and most susceptible to statistical fluctuation, but the primary cause appears to be different distribution of insurers by age. For example, some insurers do not have a “preferred” health discount; the bulk of their policies are issued in their “most favorable” class.
CLOSING
We thank insurance company staff for submitting the data and responding to questions promptly. We also thank Sophia Fosdick and Quentin Clemens of Milliman for managing the data expertly.
We reviewed data for reasonableness and insurers reviewed their product exhibit displays. Nonetheless, we cannot assure that all data is accurate.
If you have suggestions for improving this survey (including new entrants in the market), please contact one of the authors.
Footnote:
1: Giese, C., Cunningham, J., Gunnlaugsson, A. et al. (September 9, 2020). Long-Term Services and Supports Feasibility Study. Milliman Report. Retrieved April 19, 2024, from https://www.dhcs.ca.gov/formsandpubs/Documents/Legislative%20Reports/Long-Term-Services-and-Supports-Feasibility-Study-Final-Report.pdf.
2: California Assembly Bill 567: Oliver Wyman Actuarial Report (December 15, 2023). Retrieved April 19, 2024, from https://www.insurance.ca.gov/0500-about-us/03-appointments/upload/CaAB567OliverWymanActuarialReport2023.pdf.
3: https://legiscan.com/CA/text/AB567/id/2831261#:~:text=California%20Assembly%20Bill%20567
4: https://cahealthadvocates.org/wp-content/uploads/2023/08/False_and_Misleading_Long-Term_Care_Insurance_Marketing_Tactics.pdf
5: https://www.nationalnursesunited.org/press/60-80-insurance-denials-overturned-or-reversed-when-taken-independent-medical-review-new-data#:~:text=60%2D80%25%20of%20Insurance%20Denials,New%20Data%20%7C%20National%20Nurses%20United.