The 2019 Milliman Long Term Care Insurance Survey, published in the July issue of Broker World magazine, was the 21st consecutive annual review of long term care insurance (LTCI) published by Broker World magazine. It analyzed individual product sales and Genworth group sales, reporting sales distributions and detailed insurer and product characteristics.
From 2006-2009, Broker World magazine published separate group LTCI surveys, but discontinued those surveys when the availability of group LTCI policies shrank. In 2011, Broker World magazine began annual analysis of worksite sales of individual products in August to complement the July overall market analysis.
The worksite market consists of individual policies and group certificates (“policies” henceforth) sold with discounts and/or underwriting concessions to groups of people based on common employment.
About the Survey
Our survey includes worksite (WS) sales and statistical distributions from Genworth group, MassMutual, New York Life, and Northwestern and worksite sales data from LifeSecure and Transamerica. We compare WS sales to individual LTCI policies that are not worksite policies (NWS) and to total sales (Total).
The July issue also included the California Public Employees Retirement System (CalPERS) program. CalPERS eligibility is based California public employment, but the program operates more like an affinity group than a worksite group, so it was counted as affinity sales in July and is not included as a worksite product in this article.
We limit our analysis to U.S. sales and exclude “combo” products, except where specifically indicated. (Also called “linked” benefits, combo products pay meaningful life insurance, annuity, or disability income benefits in addition to LTCI.)
If a business owner buys an individual policy and pays for it through her/his business, some participants may report such policies as “worksite” policies while others might not, if it was not processed as a worksite group.
If a business sponsors general long term care/LTCI educational meetings, with employees pursuing any interest in LTCI off-site, such sales are not treated as WS sales.
Highlights from This Year’s Survey
- Participants reported 2018 WS sales of 8,436 policies (15.0 percent of total sales) for $15.64 million (9.1 percent of new annualized premium). The premium includes 2018 future purchase options exercised on policies issued in the past.
- In 2018, the WS policies sold decreased by 41 percent and new annualized WS premium decreased 33 percent, compared to 2017 results, a much steeper drop than the whole stand-alone LTCI industry.
- Our worksite sales are representative of nearly 100 percent of the stand-alone WS LTCI market, but our statistical distributions reflect about 65 percent of worksite sales.
MARKET PERSPECTIVE
The worksite market consists of three types of programs (which may apply to different employee classes in a single case):
- In “core” (also known as “core/buy-up”) programs, employers pay for a small amount of coverage for generally a large number of employees; the employees can buy more coverage. “Core” programs generally have lower average ages, short benefit periods, low daily maximum benefits and few spouses insured.
- In “carve-out” programs, employers pay for robust coverage for generally a small number of executives and usually their spouses. Generally employees can buy more coverage for themselves or spouses. Carve-out programs cover more married people and spouses and have higher age distributions than “core” programs.
- In “voluntary” programs, employers pay nothing toward the cost of coverage. Coverage is more robust than “core” programs, but less robust than carve-out programs. Voluntary programs tend to be most weighted toward female purchasers.
MassMutual, New York Life and Northwestern write mostly executive carve-out programs, whereas Genworth, Transamerica and LifeSecure business includes a lot of voluntary and core buy-up business as well.
Prior to gender-distinct NWS pricing, many insurers simply offered a five or 10 percent worksite discount for a product that was already designed, state-approved and had illustration, sales material and administrative support.
Most people interpret Title VII of the 1964 Civil Rights Act to require that employer-involved LTCI sales use unisex pricing if the employer has had at least 15 employees for at least 20 weeks either in the current (or previous) year. Thus, to sell at the WS, insurers must create a separate unisex-priced product.
The added expense of separate pricing and administration for WS sales discourages insurers from serving both the WS and NWS markets. With the decrease in LTCI sales this century, insurers may be less confident that the effort of creating a WS program would be rewarded.
Because healthy, young, and less affluent people are less likely to buy, insurers and enrollers fear anti-selection (less-healthy people buying, while healthier people do not buy). Most WS programs offer health concessions which can exacerbate this risk.
Females get a good deal in a WS program compared to NWS pricing, but males pay more in the WS. Insurers fear that most worksite buyers might be female, hurting WS profitability. The Statistical section provides significant data in this regard. To the degree that sales skew to females, unisex pricing must approach gender-distinct female pricing (since females have higher expected future claims).
WS programs rarely offer “preferred health” discounts; insurers generally don’t get enough health information to grant such a discount. Thus, heterogeneous couples might pay more for a WS policy than a corresponding NWS policy, if the male spouse is older or buys more coverage and/or one or both spouses would qualify for a “preferred health” discount in the NWS market. In the carve-out market, a costlier LTCI product can still produce savings on an after-tax basis.
To control risk, most insurers will not accept a voluntary WS program if there are fewer than 100 employees. There is no “guaranteed issue” stand-alone LTCI coverage; however, some combo products offer some guaranteed issue with adequate WS participation. Insurers are also more careful about gender, age and income distributions of WS cases they accept. However, one insurer (which offers no health concessions) will, in half of US jurisdictions, accept voluntary LTCI programs with as few as twoemployees buying (the other jurisdictions require that three to five employees buy).
Some insurers have raised their minimum issue age to avoid anti-selection (few people buy below age 40) and reduce exposure to extremely long claims. Such age restrictions can discourage employers from introducing a program, especially a carve-out program if they have executives or spouses under age 40.
With increased remote work, more employers have employees stretched across multiple jurisdictions and eligible non-household relatives might live anywhere. But insurers are less likely than in the past to offer LTCI in jurisdictions with difficult laws, regulations or practices. So, it can be difficult to find an insurer which can cover everyone unless LTCI is sold on a group chassis and the employer does not have individuals in extra-territorial states.
One WS insurer no longer offers WS LTCI to non-household relatives. Reduced availability for such relatives does not have much impact on sales, because few non-household relatives buy WS LTCI. However, it undermines the suggestion that WS LTCI programs might reduce the negative impact of employees being caregivers.
In the past, an executive carve-out for two partners of a company with more than 15 employees could have been serviced by any LTCI company, but now it is hard to find a carrier that will offer unisex pricing under such circumstances. Thus, it is harder for some executives to benefit from the tax advantages of employer-paid coverage.
Some employee benefit brokers are reluctant to embrace LTCI because of declinations, the need to educate employees, certification requirements, their personal lack of expertise, etc. Increased WS sales are likely to depend upon LTCI specialists forming relationships with employee benefit brokers.
The Tax Cuts and Jobs Act of 2017 reduced the tax savings for C-Corporations buying LTCI for their employees and employees’ life partners. Pass-through entities may be the more attractive market now. Although the eligible premium is capped in a pass-through entity, a much higher marginal tax rate might apply.
Voluntary worksite LTCI sales, which lack the tax advantages of employer-paid coverage, may, like the NWS market, gravitate toward combo products, which have the added advantage of providing valuable life insurance that is viewed as a more immediate potential need by young employees with families.
The worksite is a great venue to serve people who can benefit substantially from LTCI and the state Partnership programs (described in the Partnership section below). Unfortunately, only 10.3 percent of 2018 WS sales qualified for Partnership programs.
Regulators have “stepped up,” as more than 20 jurisdictions now accept policies in their state Partnership programs even if maximum benefits compound by only one percent. By offering one percent compounding option, insurers can make core and voluntary WS programs more attractive.
Increased ong term care exposure coupled with attractive tax breaks for employer-paid coverage and Partnership and combo opportunities in the core and voluntary market may generate significant WS LTCI growth.
However, either consciously or subconsciously, employers understand that offering LTCI to their employees has little value for the employer. By the time the employee or spouse needs long term care, the employee will likely have terminated employment. The industry can help employers much more effectively by providing services which can reduce the likelihood of employees’ elders needing long term care and can make long term care more effective, more efficient and less expensive for employee caregivers.
STATISTICAL ANALYSIS
In reviewing the following data, remember that insurers’ sales distributions can vary greatly based on the submarket they serve (for example, in the WS market: Core, voluntary or carve-out). Therefore, distributions may vary significantly from year to year due to a change in participating insurers, in distribution within an insurer or in market share among insurers. Because our sales distributions reflect approximately 90 percent of NWS sales but only 65 percent of the worksite sales, the “total” distributions are skewed toward NWS characteristics.
Sales and Market Share
Table 1 shows historical WS sales and Table 2 shows WS sales as a percentage of total LTCI sales. The WS market dropped 41 percent in terms of number of new policies and 33 percent in new premium compared to 2016.
As shown in Table 3, most of the drop in sales resulted from an insurer which was #2 in the market in 2017 but was out of the market for most of 2018. Clearly, the other insurers did not gain market penetration as a result. The six top worksite carriers have been the same for several years and WS market share among carriers is distributed very differently from the NWS market. The percentage of each insurer’s new premium that comes from WS sales did not change dramatically from 2017 to 2018.
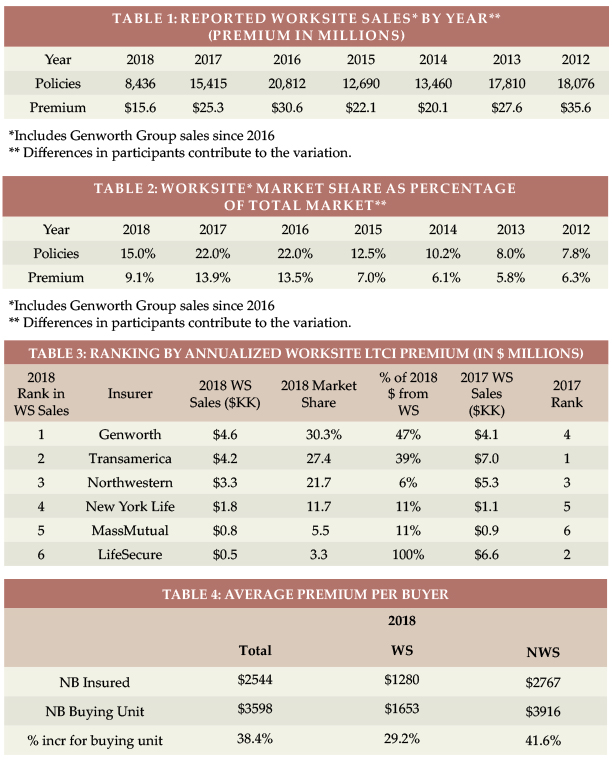
Average Premium Per Buyer
Table 4 shows the average premium per insured for new business (NB) in the WS market is about 50 percent as high as in the NWS market, because WS buyers are younger and purchase less robust coverage. While the NWS average premium per buying unit is 42 percent higher than the average premium per insured, the WS average premium per buying unit is only 29 percent higher because fewer spouses buy coverage in the WS.
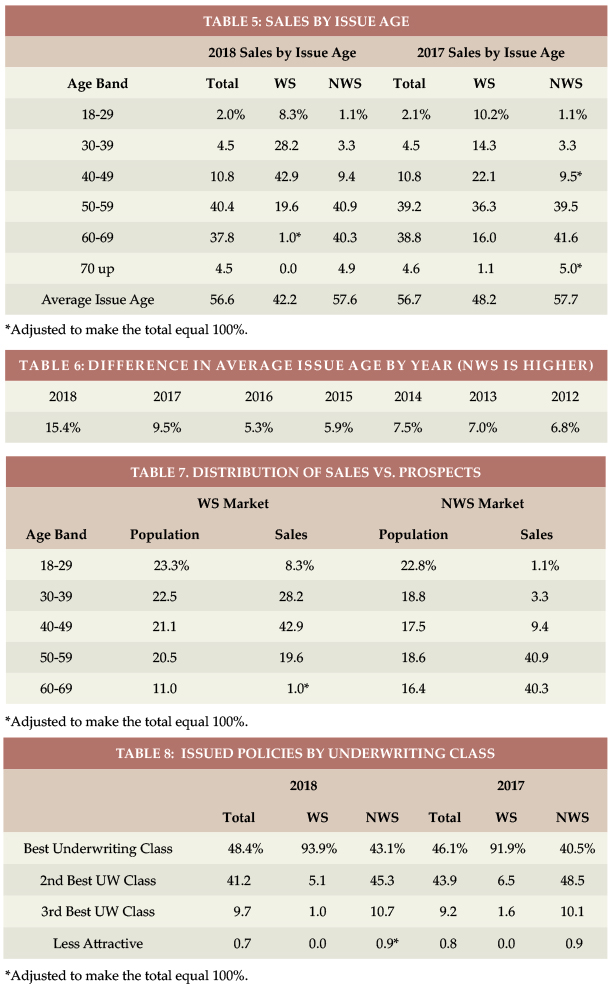
Issue Age
Table 5 shows 2018 WS data is concentrated much more to ages 30-50 than in 2017. The reduced WS sales at ages 60+ led to a very low average WS issue age (42.2). Hence, the difference in average issue age between WS and NWS has increased from 5.3 years in 2016 to 15.4 years in 2018 (see Table 6).
Table 7 displays the relative age distribution of the population compared to purchasers in the NWS and WS markets.
Rating Classification
Most WS sales are in the “best” underwriting class (see Table 8) because there generally is only one underwriting class. Insurers often do not get enough information in WS to determine whether a “preferred health” discount could be granted and use the additional revenue (from not having a “preferred health” discount) to fund extra cost resulting from health concessions. Some carve-out programs may offer a “preferred” discount. A higher percentage of NWS cases were in the “best” class in 2018 because one insurer eliminated its preferred health discount (hence “standard” ratings were its “best”).
Benefit Period
Table 9 shows the combined WS percentage of three- and four-year benefit periods increased from 49.7 to 55.1 percent. Table 10 shows historical variation in the average WS benefit period. A large increase in two-year benefit period sales explains the lower WS average benefit period the past two years, probably caused by a difference in carriers reporting data. As discussed later, the WS market issues much less Shared Care, so the advantage of the NWS market in terms of benefit period is significantly greater than indicated in Table 9.
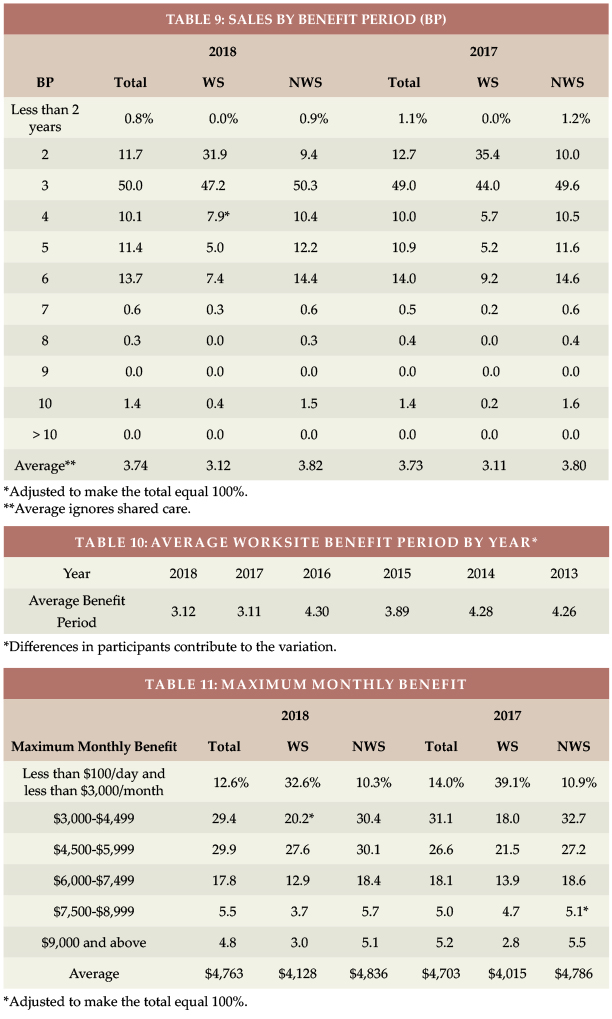
Maximum Monthly Benefit
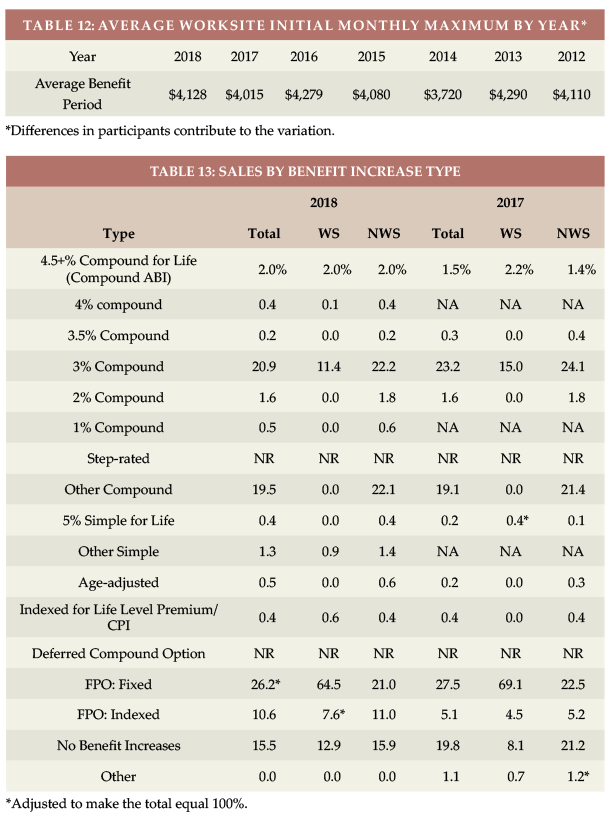
Table 11 shows that the average initial monthly maximum benefit increased by $113 in 2018 in the WS market and by $50 in the NWS market. Table 12 shows how the WS initial monthly maximum has varied over time.
Benefit Increase Features
As shown in Table 13, the WS market has a lot more future purchase options (FPO; 72.1 percent vs 32.0 percent in the NWS market) because of its core programs. Correspondingly, only 13.4 percent of WS policies had automatic compound increases, compared with 49.3 percent of NWS policies.
Both markets showed an increase in indexed FPOs. In the WS market, this was caused by distribution shift among insurers. In the NWS market, it was caused by reclassifying an insurer’s sales; the insurer guarantees FPOs of indeterminate amount but bases its decision on interest rates.
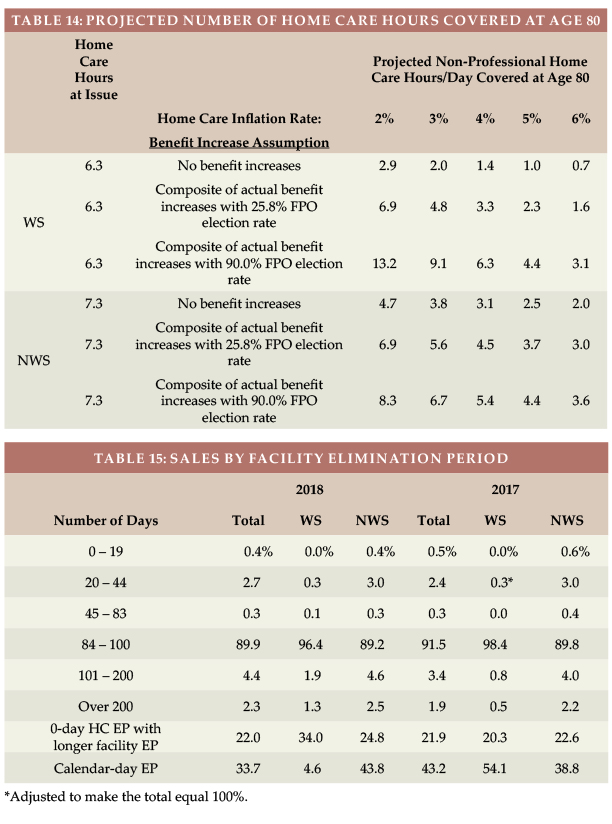
Based on a $22/hour cost for non-professional personal care at home ($22 is the median cost according to Genworth’s 2018 study, the average WS initial maximum daily benefit of $137.60 would cover 6.3 hours of care per day at issue, whereas the typical NWS initial daily maximum of $161.21 would cover 7.3 hours of care per day, as shown in Table 14.
The number of future home care hours that could be covered depends upon when care is needed (we’ve assumed age 80), the home care cost inflation rate between now (age 42 for WS and 58 for NWS) and age 80 (we’ve calculated with two, three, four, five and six percent inflation), and the benefit increases provided by the LTCI coverage between now and age 80.
Table 14 shows calculations for 3 different assumptions relative to benefit increase features:
- The first line presumes that no benefit increases occur (either sold without any benefit increase feature or no FPOs were exercised).
- The second line reflects the average benefit increase design using the methodology reported in the July article, except that it assumes 25.8 percent elections of five percent compound FPOs, which we inferred in July is indicative of “positive” election FPOs (the increase occurs only if the client elects it).
- The third line is like the second line except it assumes 90.0 percent FPO election, which we inferred in July is indicative of “negative” election FPOs (the increase occurs unless the client rejects it).
Table 14 indicates that:
1. Without benefit increases, purchasing power deteriorates significantly, particularly for the worksite purchaser because there are more years of future inflation for a younger buyer.
2. The “composite” (average) benefit increase design, assuming that 25.8 percent of FPO offers are exercised is much better, but still leads to significant loss of purchasing power. The exception: The WS client gains a bit of purchasing power if the inflation rate is only two percent (the composite with a 25.8 percent FPO election rate is equivalent to a bit more than two percent compounding).
3. With 90 percent FPO election rates, insured people will do much better retaining purchasing power. The average WS buyer would experience increased purchasing power if inflation averages less than four percent but would lose purchasing power if inflation exceeds four percent. The average NWS buyer would lose purchasing power even if inflation is only three percent.
Table 14 underscores the importance of considering future purchasing power when buying LTCI. Please note:
a) The average WS buyer was 16 years younger, hence has 16 more years of inflation and benefit increases in the above table. The effective inflation rate to age 80 is not likely to be the same for 42-year-olds versus 58-year-olds purchasing today.
b) WS sales have less automatic compounding and more FPOs, so WS results are more sensitive to FPO election rates.
c) Results vary significantly based on an insured’s issue age, initial maximum daily benefit, and benefit increase feature, as well as the inflation rate and the age at which the need for care occurs.
d) The median age of starting to need care is about age 83 and the median age of needing care is about age 85. By then, more purchasing power would be lost.
e) Table 14 does not reflect the cost of professional home care or a facility. According to the afore-mentioned 2018 Genworth study, the average nursing home private room cost is $275/day, which is currently comparable to 12.5 hours of non-professional home care. However, the inflation rate for facility costs is likely to differ from the inflation rate for home care.
f) Table 14 could be distorted by simplifications in our calculations. For example, we assumed that the FPO election rate does not vary by age, size of policy or market and that everyone buys a home care benefit equal to the average facility benefit.
Partnership Programs and Qualification Rates
When someone applies to Medicaid for long term care services, most states with Partnership programs disregard assets up to the amount of benefits received from a Partnership-qualified policy (some Indiana and New York policies disregard all assets). Partnership sales were reported in 44 jurisdictions in 2018, all but Alaska, District of Columbia, Hawaii, Massachusetts, Mississippi, Utah, and Vermont, where Partnership programs do not exist. Massachusetts has a somewhat similar program (MassHealth).
To qualify for a state Partnership program, a policy must have a sufficiently robust benefit increase feature, the requirement varying by issue age. Historically, a level premium with permanent annual three percent or higher compound increases or an otherwise similar consumer price index (CPI) increase was required for ages 60 or less. For ages 61 to 75, five percent simple increases also qualified, and for ages 76 or older, policies qualified without regard to the benefit increase feature. As noted above, many states now confer Partnership status with compounding as low as one percent. Three insurers offer one percent compounding. One of those insurers and three others offer two percent compounding.
The WS venue provides an efficient opportunity to serve less-affluent employees and relatives who would most benefit from Partnership qualification. Unfortunately, only 10.3 percent of WS sales in 2018 qualified for Partnership programs. Two insurers reported that 33 to 38 percent of their WS sales qualified, but the other two insurers reported that five to 6.5 percent qualified. Unfortunately, voluntary and core plans are less likely to qualify than carve-outs. As additional states permit one percent compounding and as insurers design products to offer one percent compounding, the percentage of Partnership policies sold in the WS market is likely to grow.
Jurisdictional Distribution
On the Broker World web-site (www.BrokerWorldMag.com), you can find a chart of the market share of each US jurisdiction relative to the total, WS and NWS markets, split by Partnership combined with non-Partnership policies and separately solely Partnership policies. This chart indicates where relative opportunity may exist to grow LTCI sales.
Elimination Period
Nearly 90 percent of the NWS market buys 90-day elimination periods (EPs). For that reason, most WS programs offer only a 90-day EP and 96 percent of 2018 WS sales had a 90-day EP, as shown in Table 15.
Table 15 also shows how many policies had a 0-day home care feature and a longer facility EP and how many policies had a calendar-day EP (as opposed to a service-day EP). We have reflected LifeSecure and Transamerica in the 0-day HC and calendar-day EP figures for both years. Policies which have 0-day EP, but define their EP as a service-day EP operate almost identically to a calendar-day EP.
Gender Distribution and Sales to Couples and Relatives
In 2018, women constituted 51.2 percent of the US age 20-79 population, but 54.8 percent of LTCI buyers in the NWS market. That’s not surprising; it has long been clear that women are more interested in LTCI. However, women constituted only 46.8 percent of the workers, but 57.7 percent of LTCI buyers in the worksite. This much larger discrepancy (10.9 vs. 3.6 percent in the NWS market) demonstrates that gender anti-selection occurs in the worksite. Table 16 shows that, in 2014 and prior years, more men purchased LTCI in the WS than women, because a significant part of the market was executive carve-out and more executives were male. But the LTCI industry adopted gender-distinct pricing in 2013 which spread through the industry the next few years. Since 2015, more women than men purchase WS LTCI. As noted earlier, carriers have taken a variety of steps to reduce such anti-selection or to reduce its impact. Considering that it is harder to find WS LTCI programs for employers with high percentages of females makes the statistics herein more striking. *Bureau of Labor Statistics, https://www.bls.gov/cps/demographics.htm
For insurers selling mostly executive carve-out programs, the percentage of females is lower than for insurers selling core and voluntary programs.
Table 17 digs deeper. In 2018, the difference in single females buying, between the WS and NWS markets, was the same as the difference for all females.
Not surprisingly, a higher percentage of the WS market consists of sales to single people and only one of a couple (core programs being one of the reasons). Over sixty percent (60.7 percent) of couples in the WS market insure only one person, which is particularly striking because the WS market should have fewer declines due to a younger age distribution, health concessions, and better health among working people than non-workers.
Shared Care is less common in the WS market because it is less commonly offered than in the NWS market.
As noted earlier, between 2006 and 2009, Broker World magazine published group LTCI surveys. At that time, parents and grandparents accounted for less than one percent (approximately 0.75 percent) of sales. This year, one insurer (one that focuses on the executive carve-out market) was able to share family sales data; 1.9 percent of its policies were issued on other relatives, which is a little broader net than parents and grandparents. Sixty-eight (68) spouses were written for every 100 employees, which seems to be characteristic of the executive carve-out market.
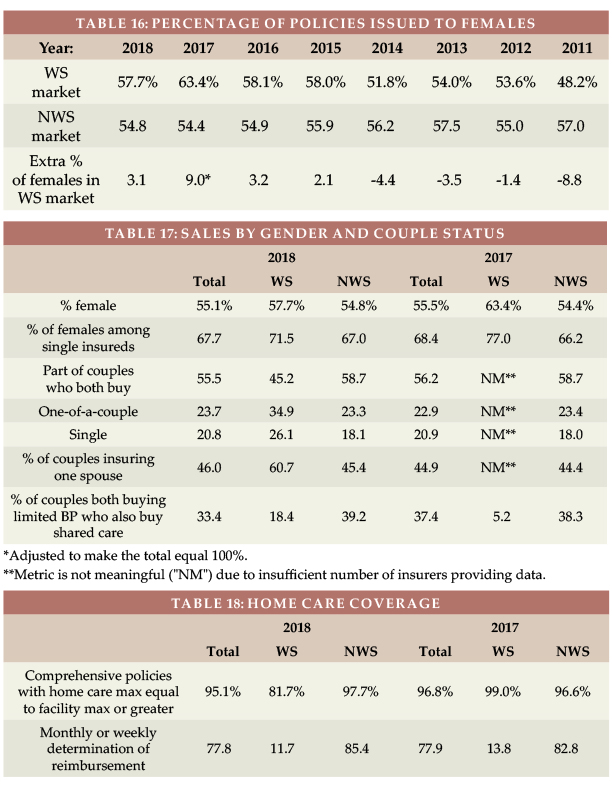
Type of Home Care Coverage
Table 18 summarizes sales by type of home care coverage. Historically, the WS market sold few policies with a home care maximum equal to the facility maximum. But with increasing emphasis on home care and simplicity, that difference faded. However, in 2018, one insurer sold 22 percent of its WS policies with a home care maximum equal to 75 percent of the facility maximum. Table 18 also shows that monthly determination dominates the NWS market, but daily determination still dominates the WS market.
Many worksite products embed a “partial cash alternative” feature (which allow claimants, in lieu of any other benefit that month, to use approximately one-third of their benefit for whatever purpose they wish, with the balance extending the benefit period) or a small informal care benefit.
Other Features
Return of Premium (ROP, see Table 19) dropped from 54.7 percent of WS policies in 2015 to 12.7 percent in 2018 (different participants). In the WS, 94.2 percent of the ROP benefits were embedded automatically versus 84.2 percent in the NWS market. In the WS market, 70.5 percent of the embedded ROP sales had death benefits that expire (such as expiring at age 67) or don’t reach 100 percent. ROP with expiring death benefits can provide an inexpensive way to encourage more young people to buy coverage, but may not provide a meaningful benefit.
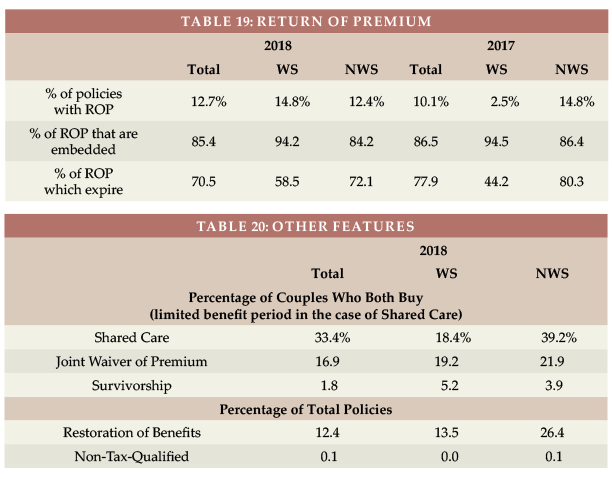
Table 20 shows that Shared Care and Restoration of Benefits are less frequently sold in the WS market and that all WS sales are tax-qualified.
CLOSING
We thank insurance company staff for submitting the data and responding to questions promptly. We also thank Nicole Gaspar and Alex Geanous of Milliman for managing the data expertly.
We reviewed data for reasonableness. Nonetheless, we cannot assure that all data is accurate.
If you have suggestions for improving this survey, please contact one of the authors.