

Wednesday, October 14, 2026

2024 Analysis Of Worksite LTCI

The 2024 Milliman Long Term Care Insurance Survey, published in the July/August issue of Broker World magazine, was the 26th consecutive annual review of long-term care insurance (LTCI) published by Broker World magazine. It analyzed product sales, reported sales distributions, and detailed insurer and product characteristics.

From 2006-2009, Broker World magazine published separate group LTCI surveys, but discontinued those surveys when the availability of group LTCI policies shrank. In 2011, Broker World magazine began this annual analysis of worksite (“WS”) sales to complement the overall market analysis.

The WS market consists of individual policies and group certificates (“policies” comprise both henceforth) sold with employer support, such as permitting on-site solicitation and/or payroll deduction. If a business owner buys a policy for herself and pays for it through her business, participants likely would not report her policy as a WS policy because it was not part of a WS group. If an employer sponsors LTC/LTCI educational meetings, with employees pursuing interest in LTCI off-site, sales would likely not be reported as WS sales.

We limit our analysis to US sales and exclude “combination” products, except where specifically indicated. (Combination products pay meaningful life insurance, annuity, or disability income benefits in addition to LTCI.)

The bulk of worksite sales that cover activities of daily living (ADLs) or cognitive impairment do not qualify as LTCI under section 7702(B) and are not covered in this survey (except as specifically mentioned).

In addition to “WS” to represent worksite sales, we use “NWS” to represent individual (non-worksite) sales and “Total” to refer to WS and NWS sales combined.

About the Survey
Participants: Seven insurers (Bankers Life, Knights of Columbus, Mutual of Omaha, National Guardian Life, New York Life, Northwestern, and Thrivent, referred to as “Participants” herein) contribute broadly to stand-alone sales distributions reported herein. Total 2023 sales data includes one additional contributor (LifeSecure) and 2023 inforce data includes two additional contributors (LifeSecure and CalPERS).

Our stand-alone LTCI WS sales and statistical distributions come from participants National Guardian Life, New York Life, and Northwestern; WS sales data from contributor LifeSecure; and inforce business from those insurers plus Mutual of Omaha.

The following ten insurers participated in our combination sales data: AFLAC, John Hancock, Mass Mutual, New York Life, Nationwide, Northwestern Mutual (Northwestern), OneAmerica, Securian, Trustmark and United of Omaha.

Comparisons of sales distributions: WS statistical distributions can vary significantly from year-to-year if particular segments of the WS market are over- or under-represented (the three segments are core, carve-out, and voluntary, described later). Carriers that provided our 2023 distributions had an average worksite annual premium of $2,271, excluding FPOs and single premium policies, whereas insurers that provided sales, but not distributions, had an average annual worksite premium of $1,476. That discrepancy, consistent with the past several years, suggests that our worksite sales distributions are dominated by carve-out executive sales.

Highlights from This Year’s Survey
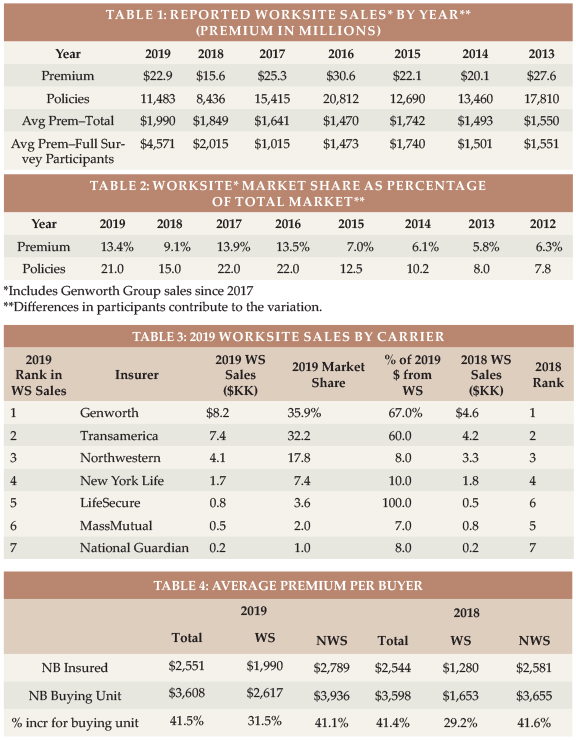
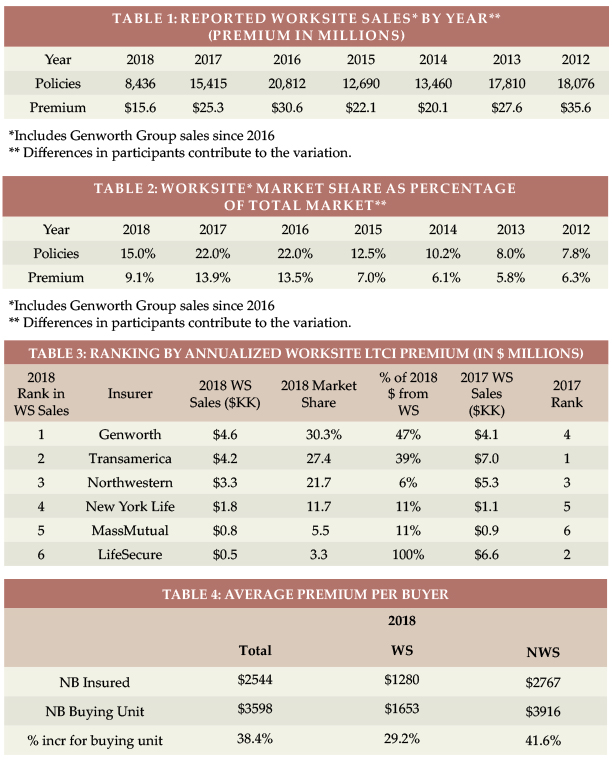
Table 1 shows WS new sales by year (for 2023: 1,324 lives, down 40 percent from 2022, and $7.1 million of annualized premium, including FPOs, down 18 percent) and Table 2 shows the percentage of Total sales that were made in the WS by year (5.4 percent of lives and 5.9 percent of premium in 2023). The WS stand-alone LTCI market has reduced substantially since the major writer discontinued sales in 2021 and is a decreasing percentage of the Total market. As discussed previously, some sales that are worksite-related may not be classified as WS sales.

Over at least a 20-year period prior to 2022, the fewest stand-alone worksite LTCI policies sold in a year was 8,436 policies (2018). Worksite sales with coverage for ADL-deficiency and cognitive impairment have shifted to combination policies, most of which do not qualify as LTCI under section 7702(B). Only two of the carriers in that market reported combo worksite sales for our survey, but those two carriers sold roughly 80,000 such worksite policies in 2023 (up 16 percent from 2022) compared to the industry’s 1,324 stand-alone LTCI WS sales. Among our combination contributors, WS sales accounted for 36.3 percent of reported lives and 9.9 percent of annualized premium. We have a good-sized sample of combination insurers, but a lower percentage of industry sales than in the stand-alone market.

MARKET PERSPECTIVE
There are three segments of the WS market. A single WS case may involve different segments for different employee classes.

  • In “core” (“core/buy-up”) programs, employers pay for a small amount of coverage for generally a large number of employees. Employees can buy more coverage. “Core” programs generally have low average ages, short benefit periods, low daily maximum benefits and a small percentage of spouses insured.
  • In “carve-out” programs, employers pay for robust coverage for key executives and usually their spouses. Generally, executives can buy more coverage for themselves or spouses. Compared to “core” programs, a higher percentage of insureds are married and more spouses buy coverage. Because the age distribution is older, the maximum monthly benefit is higher, and the benefit period is longer, the average premium is much higher than for core programs.
  • In “voluntary” programs, employers pay none of the cost. The typical coverage is more robust than “core” programs, but less robust than “carve-out” programs. Voluntary programs tend to be most weighted toward female purchasers.

Because of tax savings, small executive carve-out issue dates may have effective dates weighted toward the end of the year. On the other hand, large voluntary cases are more likely to have fall enrollments with January 1 effective dates.

National Guardian, New York Life, and Northwestern write mostly executive carve-out programs and are the only insurers that provided statistical worksite distributions; therefore, our distributions are heavily weighted to the executive carve-out market.

Carrier and product shift: Voluntary WS programs have gravitated toward combination products that include life insurance because insurers, brokers, employers, and employees tend to favor combination products.

Insurers’ pricing, underwriting, and distribution considerations favor combination products. Prior to 2012, insurers used unisex “street” pricing and typically discounted “street” prices by five percent for the worksite. Gender-distinct “street” pricing made WS pricing more complicated for insurers who believe unisex pricing is preferable in the WS due to Title VII of the 1964 Civil Rights Act. Pricing, state filing, administration, and illustration work increased when insurers could no longer simply reduce “street” prices by five percent.

Because women have higher expected future claims, unisex pricing saves women money compared to gender-distinct NWS pricing. On the other hand, men pay much more (e.g., roughly 50 percent more for some insurers) with unisex pricing than with gender-distinct pricing, possibly complicating WS sales and raising insurer concerns about gender anti-selection (a higher percentage of females in WS cases).
Insurers also fear health anti-selection (unhealthy people being over-represented among buyers), as stand-alone LTCI does not have a high voluntary participation rate. Therefore, WS stand-alone LTCI programs have limited, if any, underwriting (health) concessions.

Combination products with LTC-related benefits are less affected by unisex pricing as females pay less for the death benefit but more for the LTCI (or chronic illness) benefit. Furthermore, products with chronic illness riders do not require salespeople to be LTCI-certified, which provides insurers access to a broader distribution system than with stand-alone LTCI. As combination life programs have higher penetration rates, insurers often offer “guaranteed issue,” coverage based on the number of employees and participation rates.

From the broker, employer, and employee perspective, simplicity is very attractive. “Guaranteed issue,” along with typically fewer age restrictions than for unisex stand-alone LTCI pricing, allows any employee to be covered and makes enrollment easier and faster, like other employee benefit offerings.

Additionally, combination products’ death benefit avoids the “use it or lose it” issue and is more meaningful for young and less affluent people than is LTCI. Such products can allow 100 to 300 percent of the death benefit to be used for help with ADLs or cognitive impairment, typically using up to four percent of the death benefit each month. Alternatively, they can allow 100 to 200 percent of the death benefit (at a rate of four percent per month) but restore the death benefit each month when a LTCI claim is processed. With “restoration”, beneficiaries will receive the full death benefit regardless of how much LTCI benefit was received. Most of these provisions qualify as “chronic illness” under IRS §101(g); others qualify as “long-term care insurance” under IRS §7702(B). The chronic illness products do not require broker LTCI certification, which makes those products “simpler” than §7702(B) products.

While stand-alone (and linked-benefit) individual LTCI products generally offer annually-increasing coverage to try to maintain purchasing power in the face of inflationary increases in the costs to provide long-term care, WS combination products have a fixed benefit. For example, if a 30-year-old employee buys a $100,000 death benefit, she will have a $4,000 monthly benefit for chronic illness (assuming the benefit features described above). That $4,000 benefit would have much more purchasing power if she needs care in the next few years than if she needs care 50 years from now.

Stand-alone LTCI is still popular in executive carve-out programs. Executives can more easily afford to continue coverage after termination of employment, hence appreciate the value of compound benefit increases. Income tax advantages encourage employer-paid coverage, particularly for executives, and tax advantages may increase in the future if income tax rates rise or if such LTCI coverage permits opting out of future state LTCI programs. Because of tax advantages and employer premium payment, higher unisex prices for men are less of an issue in the executive carve-out market. Two stand-alone LTCI insurers offer unisex pricing with as few as 2 to 5 (varies by jurisdiction) employees buying, an approach that caters to this market.

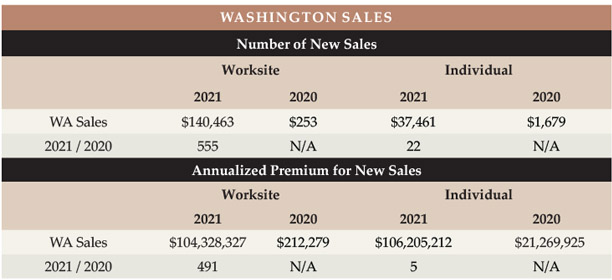
State-run LTCI programs: We discussed state-run LTCI programs in the July/August issue and prior years’ articles. Washington state’s “Washington Cares Fund” (WCF) stimulated tremendous market demand in the state of Washington, causing WS sales and distributions to vary greatly from historical trends in 2021 and 2022. However, the Washington Cares Fund and other potential state-run programs appear to have had little impact on 2023 WS sales.

Availability of coverage: As few people younger than age 40 buy stand-alone LTCI, some insurers have raised their minimum issue age to avoid anti-selection and to reduce exposure to extremely long claims. One insurer limits the maximum age to 69. Such age restrictions can discourage employers from introducing a program (even a carve-out program if they have executives or spouses too young to be covered).

Younger employees who are ineligible for coverage may still benefit from a program because their elders are often eligible for WS stand-alone LTCI programs. However, one contributor no longer offers WS LTCI to non-household relatives. Reduced availability for such relatives does not have much impact on sales, because typically 99 percent of worksite sales are to employees or their partners. Thus, even if a program is available to elder relatives, it is not likely to meaningfully address the negative impact of employees being caregivers.

With increased remote work, more employers have employees stretched across multiple jurisdictions. Eligible non-household relatives might live anywhere. However, insurers may not offer a product in jurisdictions with difficult laws, regulations, or practices, such as slow policy form approval. It can be hard to find a product which can cover everyone unless LTCI is sold on a group policy form and the employer does not have individuals in extra-territorial states. Combination products also run into jurisdictional issues because some jurisdictions do not allow LTCI benefits to exceed the death benefit and/or do not allow death benefit restoration.

Increasing hurdles for coverage have discouraged brokers as well as insurers. Some employee benefit brokers are reluctant to embrace stand-alone LTCI because of declinations, the enrollment effort compared to typical group coverages, certification requirements, their personal lack of expertise, etc. These issues could be mitigated by LTCI specialists forming relationships with employee benefit brokers.

Support for Employees who are Caregivers: Various programs offer LTC-related services to employees and their families. Regardless of whether the employee is insured or the relative is insurable, they may be able to access information, advice, services, and products that make caregiving more efficient, more effective, safer, and less expensive. Enabling employees and their families to have better LTC experiences and to use more (not necessarily 100 percent) commercial care should boost productivity at work. Some of these programs are packaged with WS LTCI.

STATISTICAL ANALYSIS
In addition to fundamental industry changes, distributions may vary significantly from year to year due to different participants, shifting distribution within an insurer, and changing market share among insurers. Our sales distributions reflect only stand-alone LTCI. Two insurers reported their number of new employer cases as well as the number of new worksite sales. Combined, they averaged 5 applications per new employer case, which seems to confirm the executive carve-out concentration in our data.

Aggregate Sales
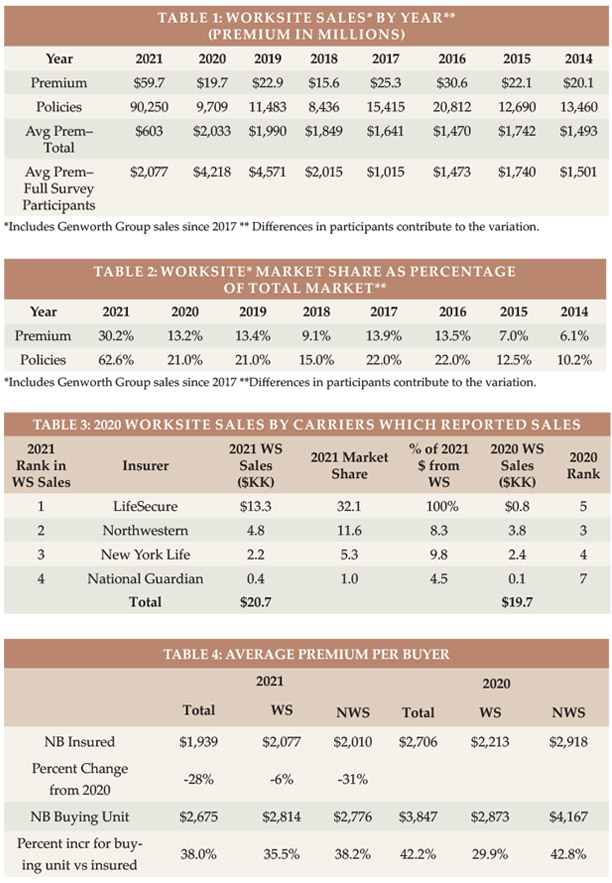
Table 1 shows the number of sales and premium in the worksite market by year. As noted above, the worksite market is in decline, with the exception of 2021 due to sales stimulated by the WCF. The shrinkage of the stand-alone WS market is underscored when you consider that nearly two-thirds of 2023 WS premiums came from FPOs on past years’ sales.

Table 2 shows WS sales as a percentage of total LTCI sales. As the market shrinks, the impact of FPOs on past sales becomes larger. FPOs account for WS being a higher percentage of premium (5.9 percent) than policies (5.4 percent). Removing FPOs, the WS premium is 3.2 percent of the total. The 2022 percentages are slightly inflated due to runout sales in Washington.

Market Share
Table 3 shows the insurers’ reported WS sales, including FPOs and new sales to worksite cases issued in prior years. Excluding FPOs, New York Life would have been in the lead, followed by LifeSecure.

Average Premium Per Buyer
Table 4 shows the average premium (without FPOs and without single premiums) per new insured for WS contributors, for WS participants (insurers which provided distributions), and for the NWS market. The total WS market has a lower average premium than those WS carriers that provided distributions. When comparing the WS market to the NWS market, influences such a younger average issue age drive the lower WS average premium.
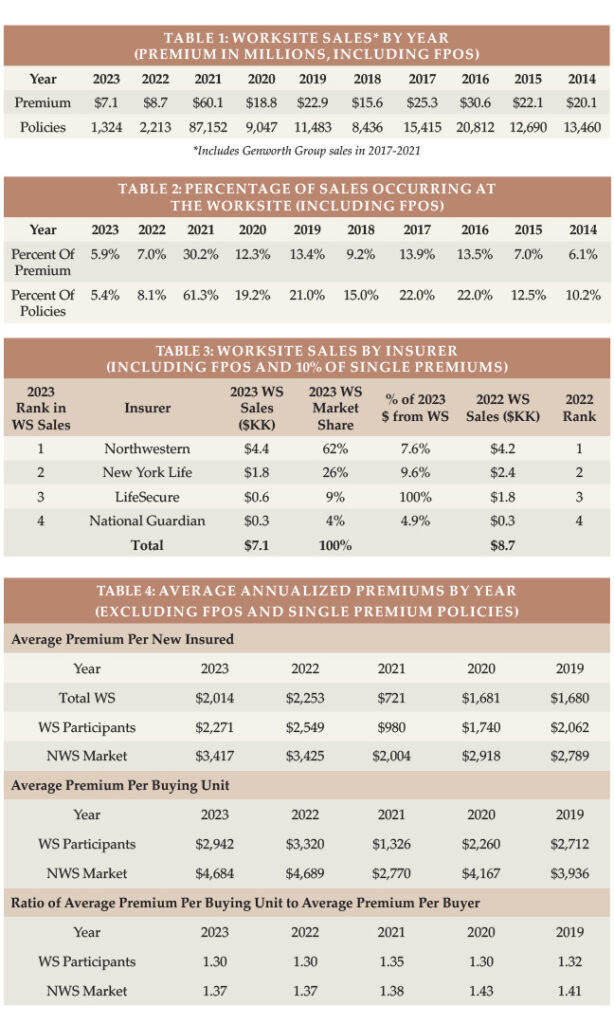
Table 4 also shows the average premium per buying unit for insurers that provided distributions (a couple comprise a single buying unit). The average premium per buying unit is higher because there are fewer buying units than insureds. The ratio between average premium per buying unit and average premium per insured life is consistently lower for WS sales, because more WS buyers are single and because spouses are less likely to buy in the WS. However, Table 4 likely understates the difference because our WS distributions reflect a higher concentration from the carveout market, which has a lot of couples who both buy.

Issue Age
In reviewing the balance of the statistical presentations, we urge you to be selective in how you use the data because it is not representative of the entire WS market as explained above.

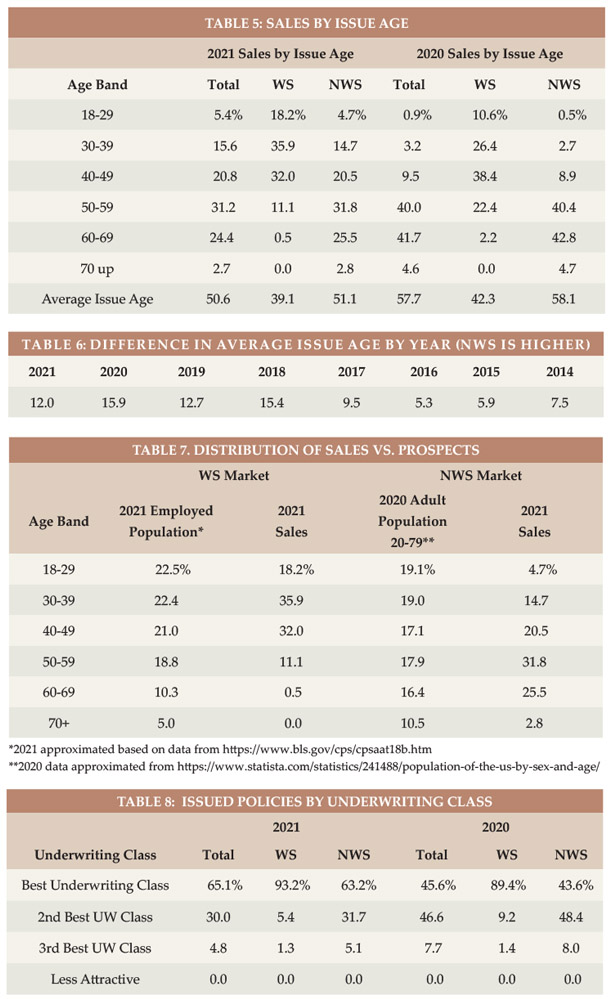
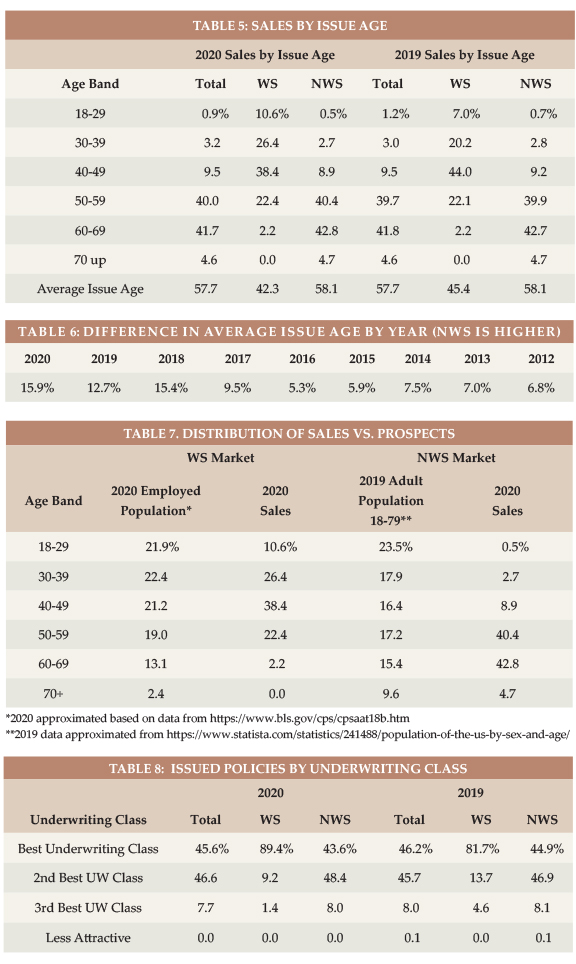
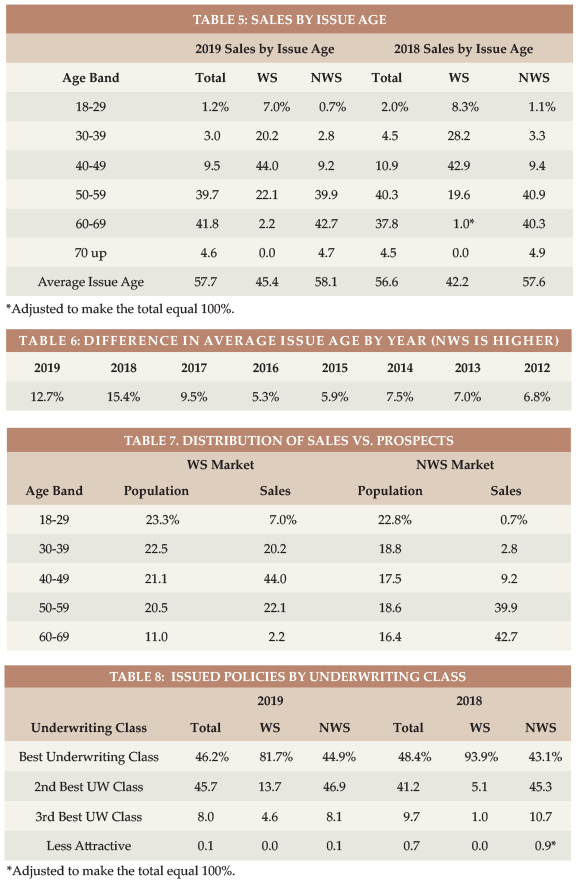
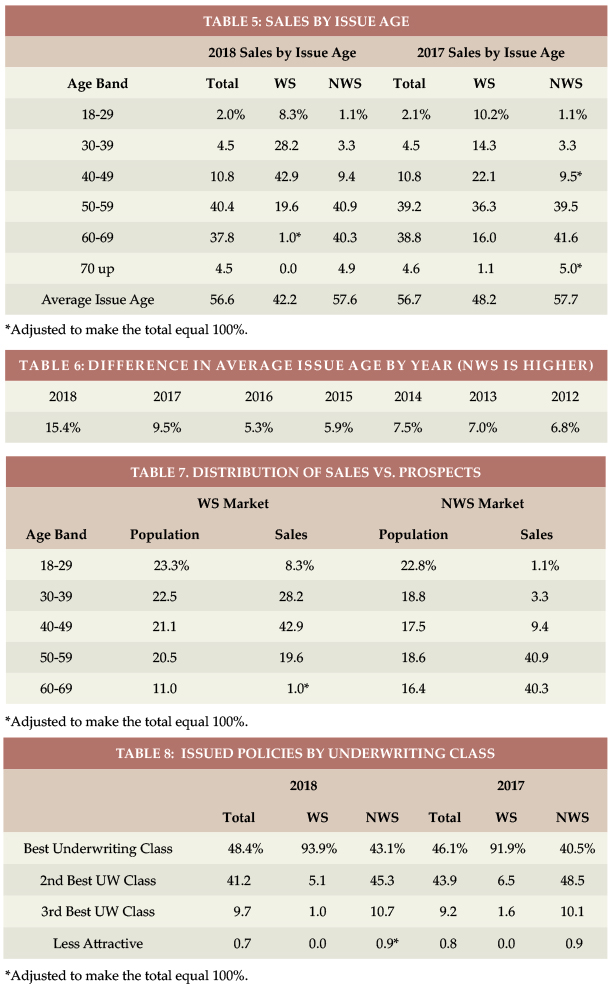
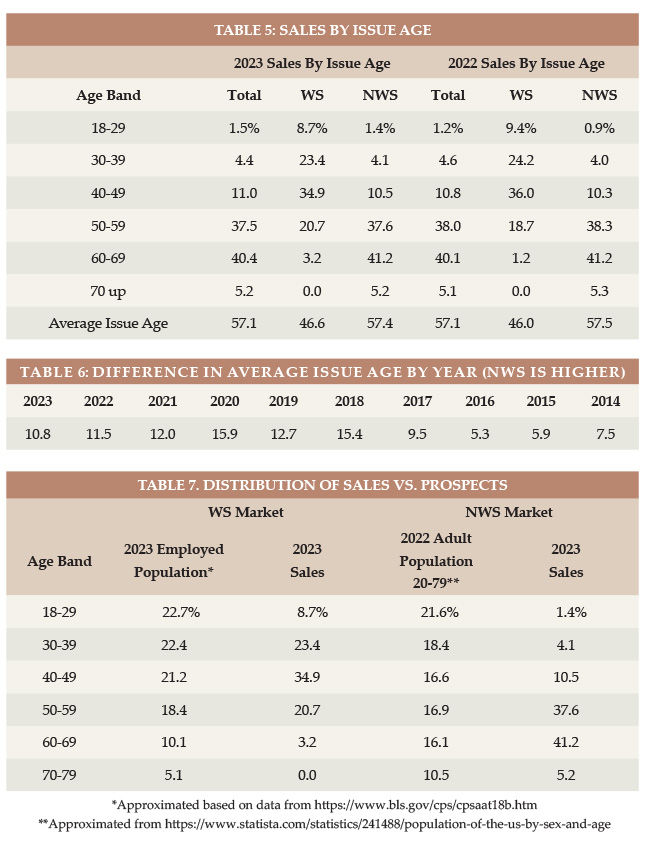
Table 5 shows the distributions by issue age and Table 6 shows, by year, how much older the average age NWS buyer is than the average age WS buyer.

Table 7 displays the relative age distribution of workers ages 18+ compared to the age distribution of purchasers in the WS market and the age distribution of adults 20-79 compared to the age distribution of purchasers in the NWS market. If the percentage of sales in a particular age group is higher than the percentage of population in that age group, we can conclude that LTCI is more appealing to that age group, the industry gets in front of that age group more, and/or more of the applicants in that age group qualify for coverage. In the WS market, the industry is particularly effective with ages 40-49. In the NWS market, the industry is particularly effective for ages 50-69.
Rating Classification
Three of our seven contributors do not offer a “preferred health” discount, so the bulk of their sales are in their best underwriting class. They are also the insurers providing WS distributions, which contributes to the high percentage (92 percent) of worksite policies issued in the best underwriting class, as shown in Table 8.

Benefit Period
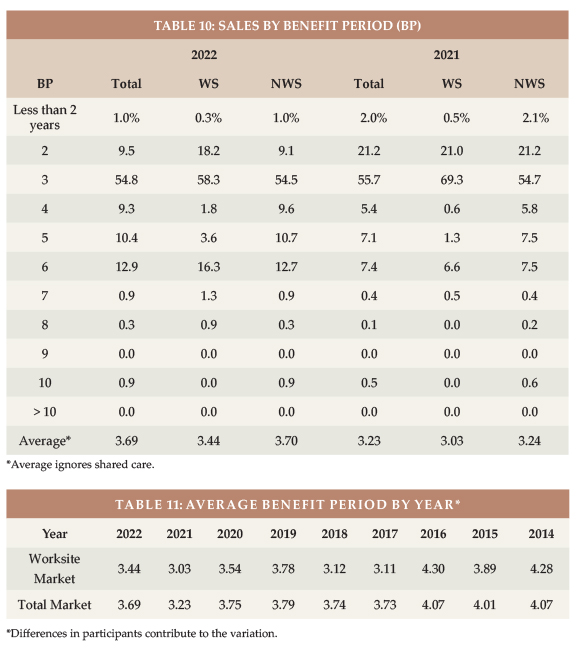
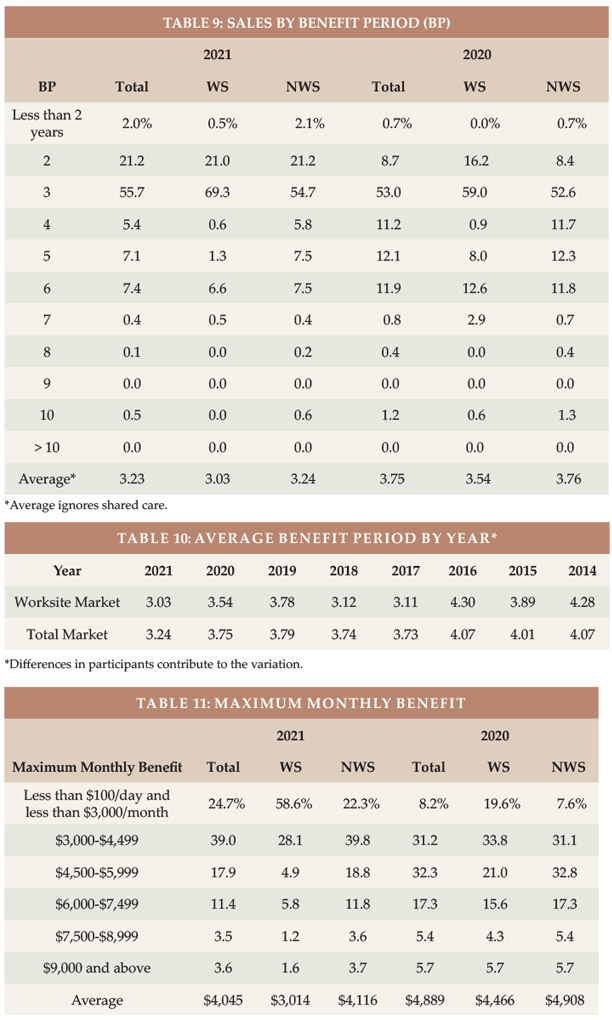
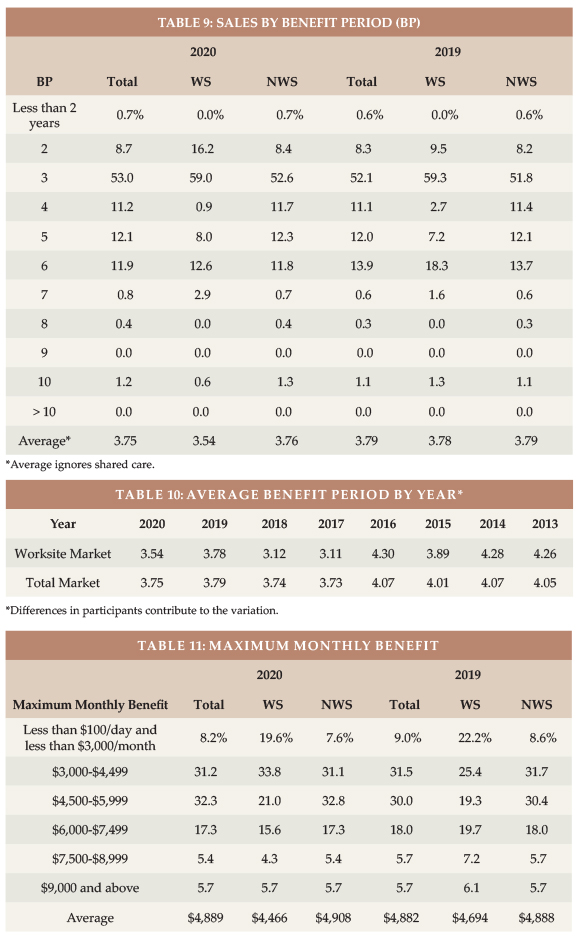
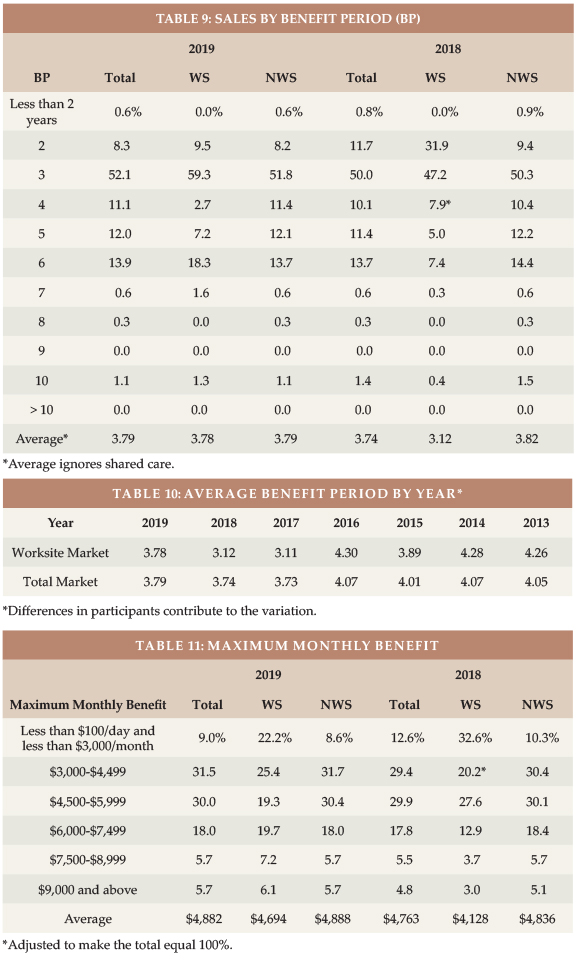
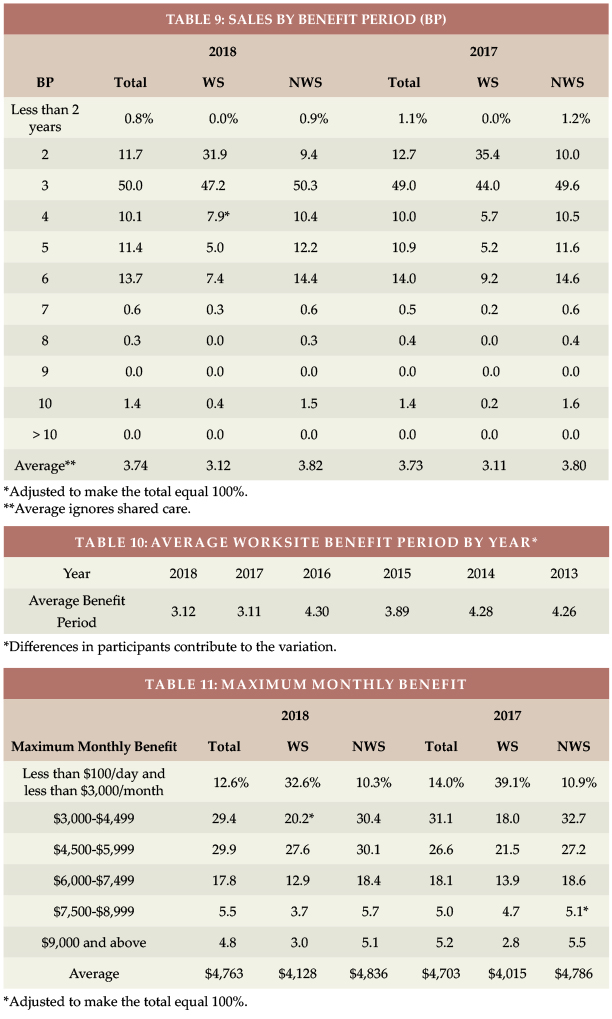
The WS average benefit period is low for core/buy-up programs and somewhat low for voluntary programs. Executive carve-out programs sometimes have longer benefit periods than the NWS market. In 2023, the WS market, for the first time since 2016, had a slightly longer average benefit period than the total market (see Table 9). Table 10 shows the results by year. Note that these statistics ignore Shared Care which, in effect, lengthens benefit period and is more prevalent in the NWS market.

Maximum Monthly Benefit
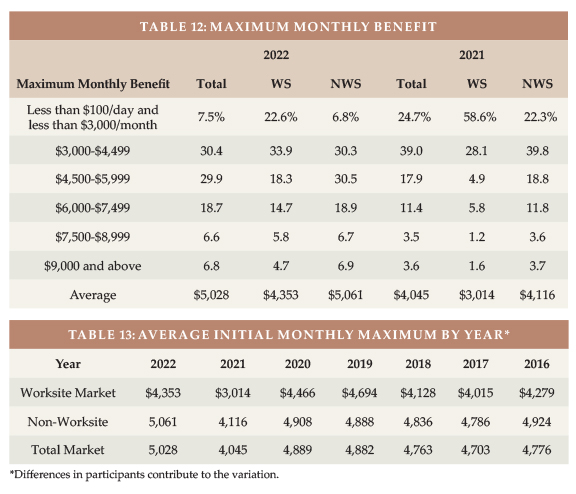
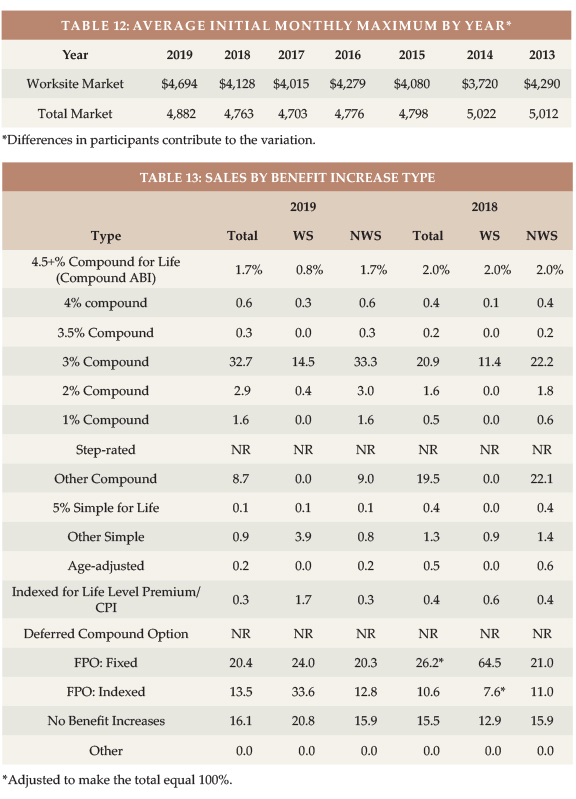
To calculate the average initial monthly maximum, we presume an average size in each size range shown in Table 11. While the WS market had a slightly longer average benefit period in 2023 than did the NWS market, it had a smaller average initial monthly maximum.
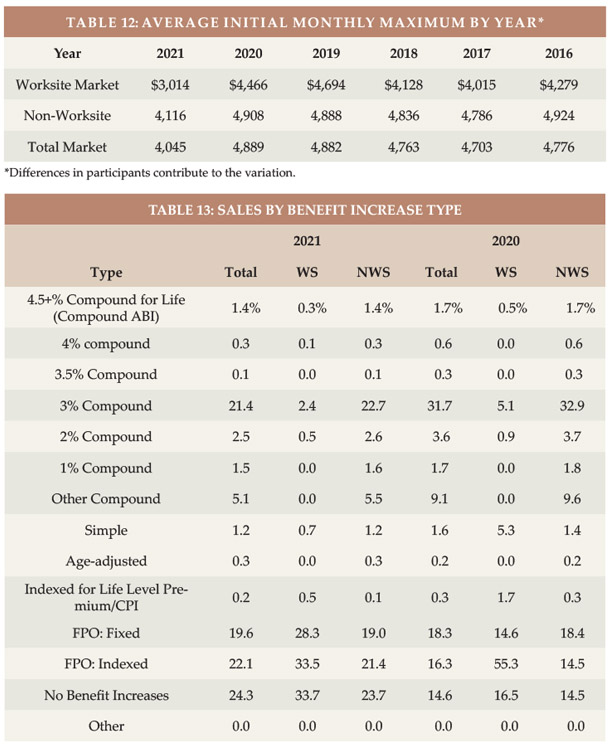
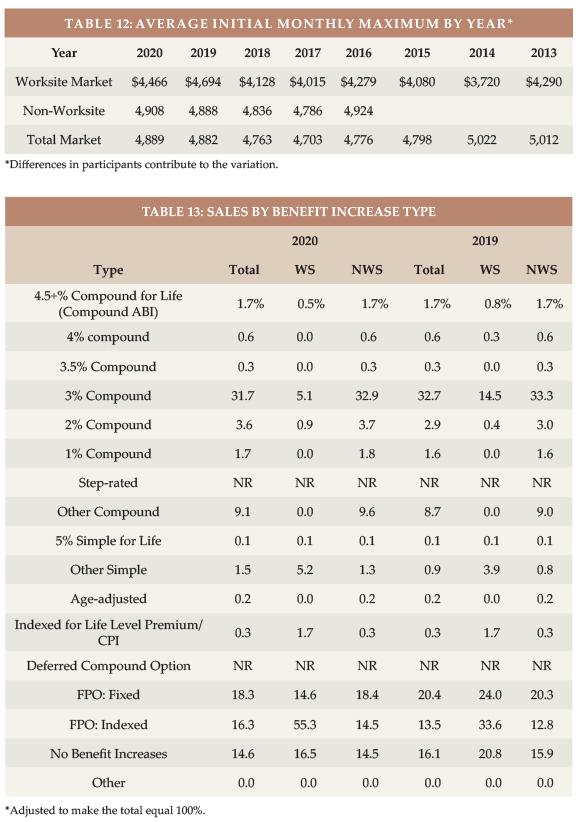
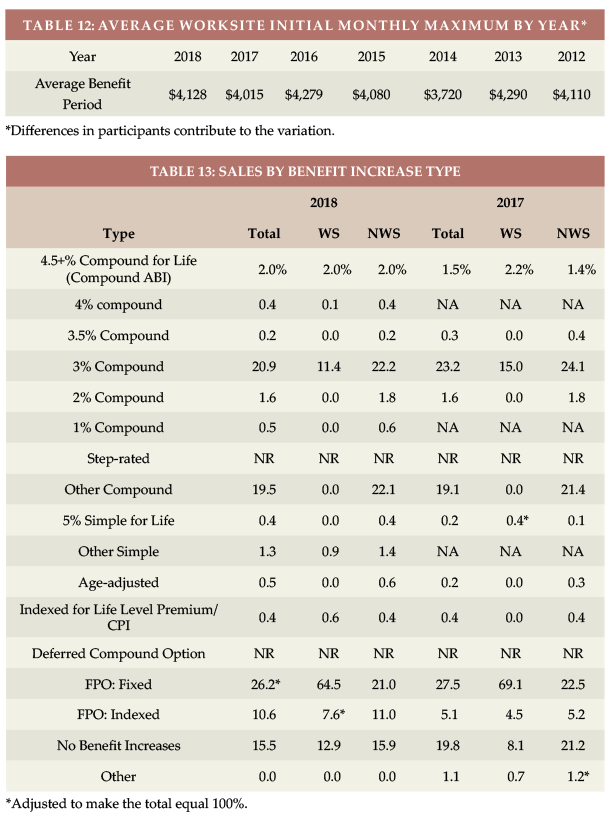
Table 12 shows that the initial maximum monthly benefit hit record high levels in 2023. The WS initial monthly maximum varies more over time than the total market because of participant changes and how many core/buy-up plans were sold in a particular year.

Benefit Increase Features
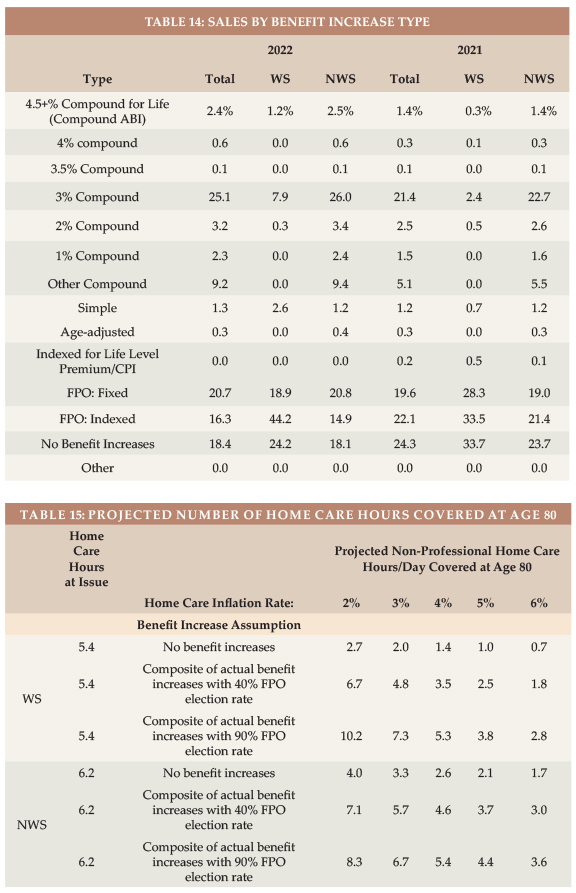
As shown in Table 14, 10.8 percent of 2023 WS sales had compounding of three percent or higher, compared to 9.1 percent in 2022. Of the 2023 WS sales, 17.4 percent had no increase feature and 67 percent had a FPO feature.
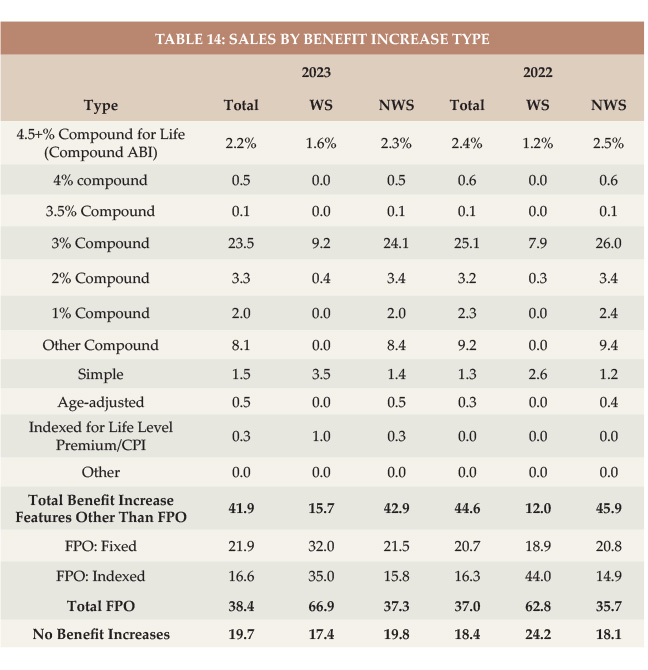
In the NWS market, 26.9 percent had three percent or higher compounding compared to 29.2 percent in 2022. While three percent or more compounding is dropping in the NWS, it is increasing in the WS market, albeit still much less common in the WS market.

Future Protection
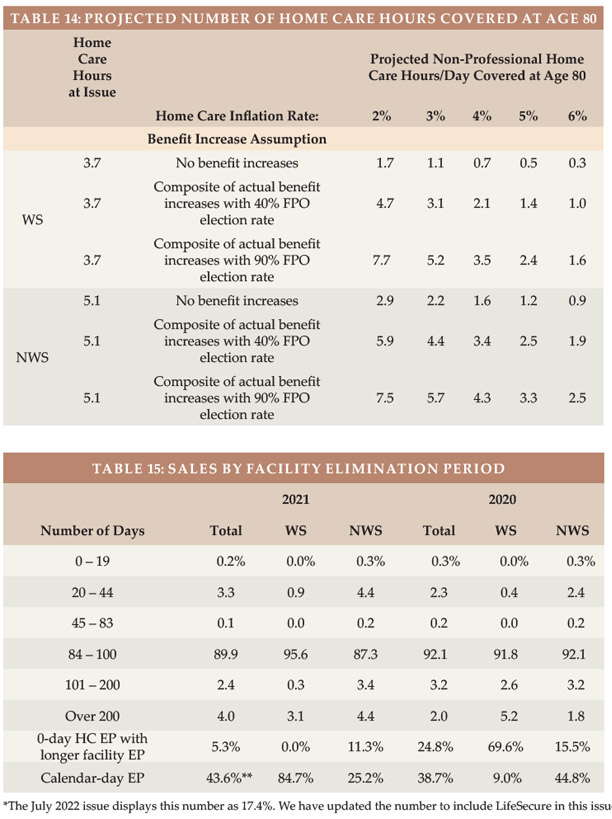
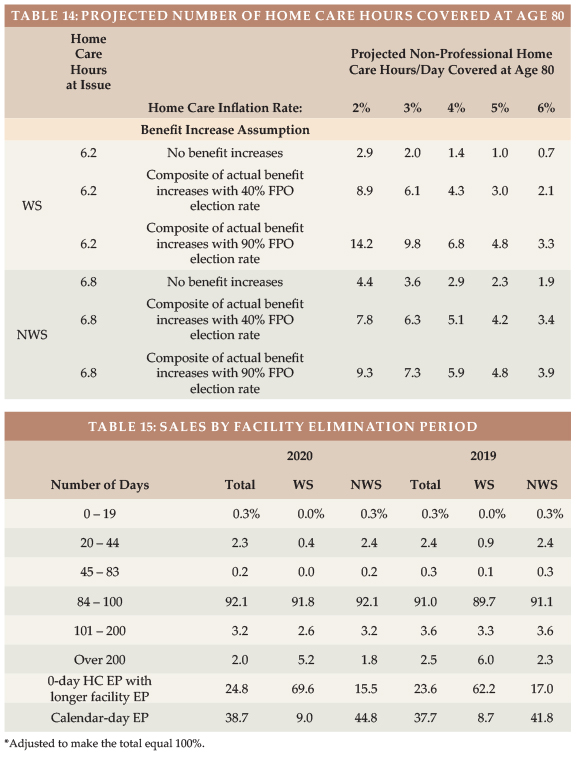
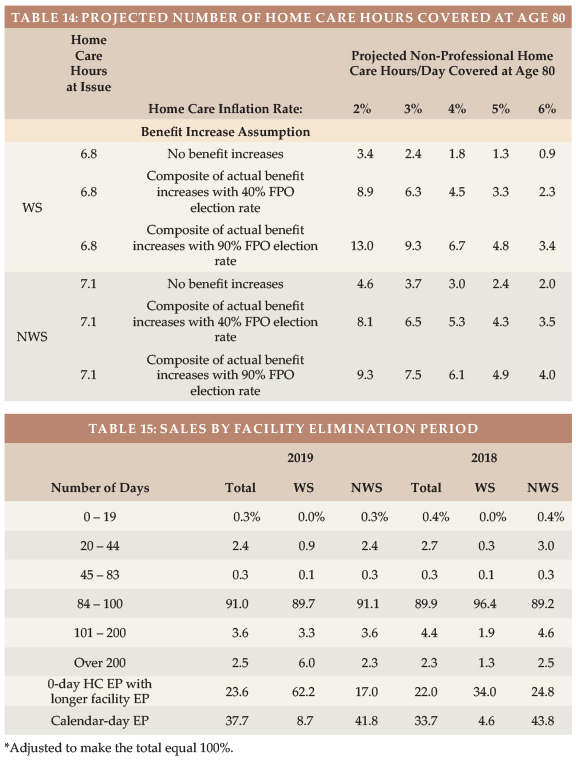
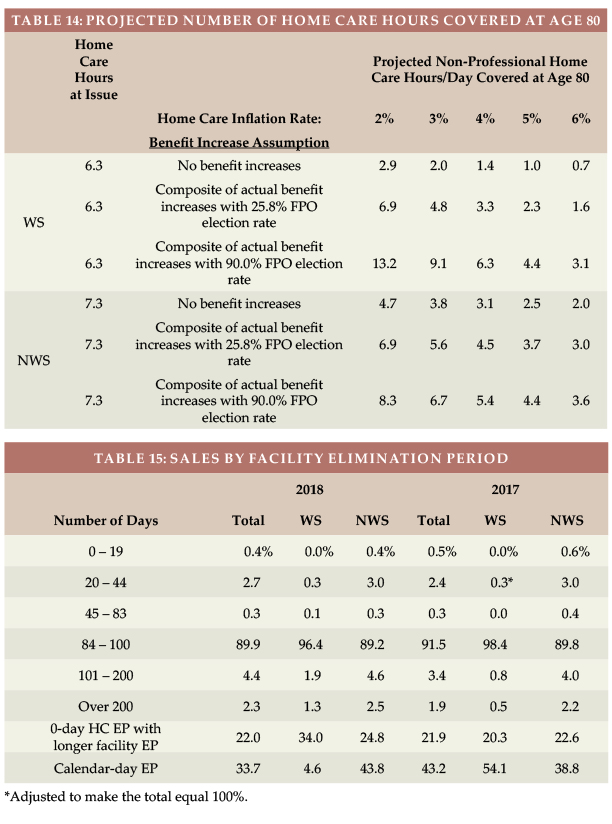
Based on a $33/hour cost for home health aides (the median cost according to Genworth’s 2023 Cost of Care Survey), the average WS initial maximum daily benefit of $166 would cover 5.0 hours of such care per day at issue, whereas the typical NWS initial daily maximum of $173 would cover 5.2 hours of such care per day, as shown in Table 15.

The number of future home care hours that could be covered depends upon when care is needed (we have assumed age 80), the home care cost inflation rate between now (age 47 for WS and 57 for NWS) and age 80 (we have calculated with 2, 3, 4, 5 and 6 percent inflation), and the benefit increases provided by the LTCI coverage between now and age 80.

Table 15 shows calculations for three different assumptions relative to benefit increase features:

  • The first line presumes that no benefit increases occur (either sold
  • without any benefit increase feature or no FPOs were exercised).
  • The second line reflects the average benefit increase design using the methodology reported in the July/August article, except it assumes that 40 percent of FPOs are elected (intended to be indicative of “positive” election FPOs, in which the increase occurs only if the client elects it) and provide five percent compounding.
  • The third line is like the second line except it assumes 90 percent of FPOs are elected (intended to be indicative of “negative” election FPOs, in which the increase occurs unless the client rejects it). It also assumes the FPOs reflect five percent compounding.
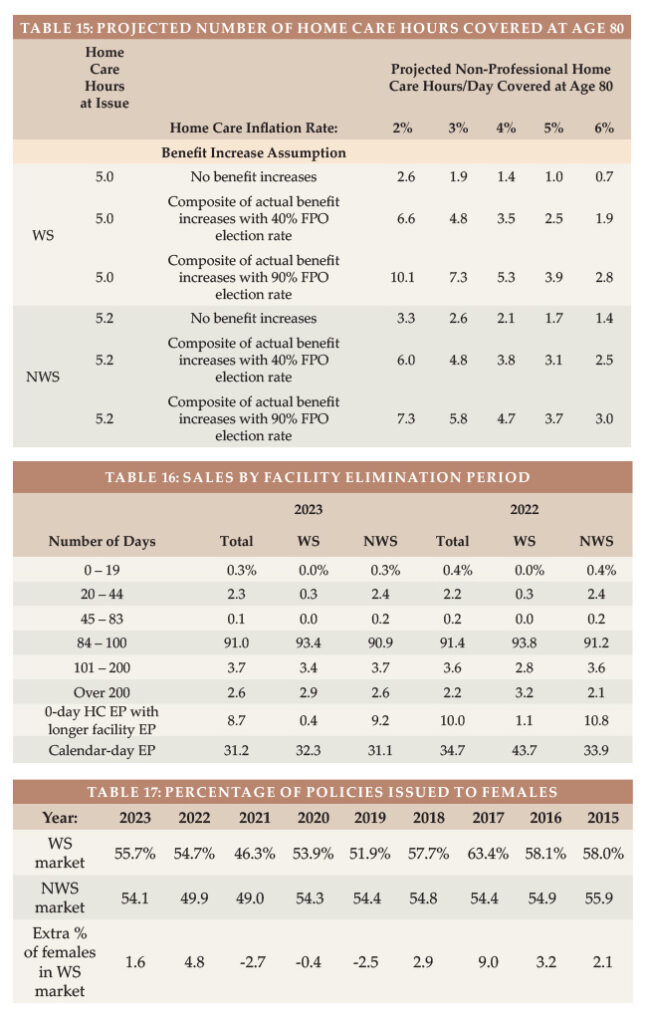
Table 15 indicates that:

  1. Without benefit increases, purchasing power deteriorates significantly, particularly for the WS purchaser as younger buyers have more years of future inflation prior to claim onset. For example, with a flat benefit, the number of covered hours of home care at age 80 drops to 1.9 hours for the average WS purchase age if there is three percent inflation. The average NWS buyer would have 2.6 hours of care (rather than 1.9 hours) at age 80 if they had no benefit increases and inflation was three percent because the average NWS buyer is older (and secondarily, buys a larger daily benefit).
  2. The “composite” (average) benefit increase design assuming that 40 percent of FPO offers are exercised preserves purchasing power better than when no increases are assumed. The average WS buyer gains buying power over time if the inflation rate is two percent, being able to pay for 6.6 hours at age 80. But if the inflation rate is four percent, this drops to 3.5. The average NWS buyer generally does better because of a higher issue age, more robust benefit increase features and a higher initial maximum daily benefit. However, the WS market has more FPOs, so when we assume 90 percent FPOs election, the WS market does better. It also does better with 40 percent FPO election and a two percent inflation rate because we presume a full five percent FPO will be exercised.

Assuming that 90 percent of FPO offers are exercised, the average WS buyer would have at least as much coverage at age 80 as at issue if the inflation rate is less than four percent. The average NWS buyer has increasing purchasing power unless inflation averages four percent.

Table 15 underscores the importance of considering future purchasing power when buying LTCI. Please note:

a) The average 2023 WS buyer was 10 years younger at issue than the average 2023 NWS buyer, hence has 10 more years of inflation and benefit increases in Table 15. The actual inflation rate to age 80 is not likely to be the same for today’s 47-year-olds as for today’s 57-year-olds.

b) Individual results vary significantly based on issue age, initial maximum monthly benefit, and benefit increase
feature, as well as the inflation rate and the age at which the need for care occurs.

c) By the median age of starting to need care (about age 83) and the median age of needing care (about age 85), more purchasing power could be gained or lost.

d) Table 15 does not reflect coverage for professional home care or facility care. According to the 2023 Genworth study, the median nursing home private room cost is $320/day, which is currently comparable to 10 hours of non-professional home care. However, the inflation rate for facility costs is likely to differ from the inflation rate for home care. From 2004-2023, Genworth’s studies showed the following compound growth rates: private room in a nursing home (3.1 percent), assisted living facility (4.3 percent), home health aide (2.7 percent), and home care homemaker (3.1 percent).

e) Table 15 could be distorted by simplifications in our calculations. For example, we assumed that the FPO election rate does not vary by age, size of policy or market and that everyone buys a home care benefit equal to the average facility benefit.

Partnership Program Background
When someone applies to Medicaid for long-term care services, most states with Partnership programs disregard assets up to the amount of benefits received from a Partnership-qualified policy (with some policies, IN and NY disregard all assets). Partnership programs exist in 44 jurisdictions (all but AK, DC, HI, MA, MS, UT, and VT), but MA has a similar program (MassHealth). The first four states to develop Partnerships (CA, CT, IN and NY) have different rules, some of which have become a hindrance to sales. We are not aware of a Partnership-qualified WS LTCI product in those four states, which is unfortunate because the WS market serves many people who could benefit from Partnership.

To qualify for a state Partnership program, a policy must have a sufficiently robust benefit increase feature. At least 29 jurisdictions have lowered the minimum Partnership-eligible compounding benefit inflation rate to one percent. To facilitate Partnership sales in such jurisdictions, an insurer could lower its minimum size from $1,500 to $1,000 if one percent compounding is included in a core program. The policies would qualify for the state Partnership and case revenue and core sales would likely increase. The premium would be more level by issue age, shifting risk to younger ages which can be preferable for the insurer in a core program.

Jurisdictional Distribution
We also examined the market share (based on number of new insureds) by jurisdiction. As was the case last year, the WS market share of five states (AL, AK, HI, NC, & VT) was at least 50 percent higher than that state’s overall market share (e.g., if they had a two percent overall market share, they had at least a three percent market share in WS). This could be the result of a single large case in that state. In 18 jurisdictions (same number as last year), the market share of total sales was at least 50 percent greater than the WS market share, suggesting that there may be opportunity for WS sales in these jurisdictions: CO, DE, IN, KS, KY, LA, MA, MD, ME, MO, MS, NE, NH, NV, OR, RI, SD, and VA. (The 9 bold italicized states were in this list last year.) In 7 jurisdictions (up from 5), our participants had no stand-alone WS sales at all (DC, ID, NM, UT, WV, WY and Puerto Rico).

Click here for a chart of the market share of each US jurisdiction relative to the total, WS and NWS markets, and the Partnership percentage by state. This chart indicates where relative opportunity may exist to grow LTCI sales.

Elimination Period
More than 90 percent of the NWS market buys 90-day elimination periods (EPs). For that reason, many WS programs offer only a 90-day EP.

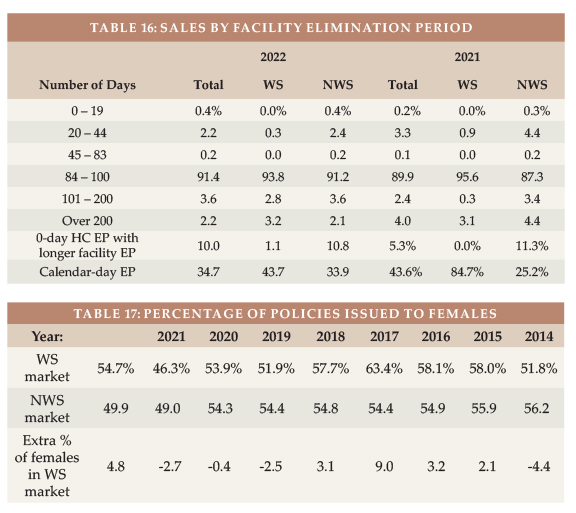
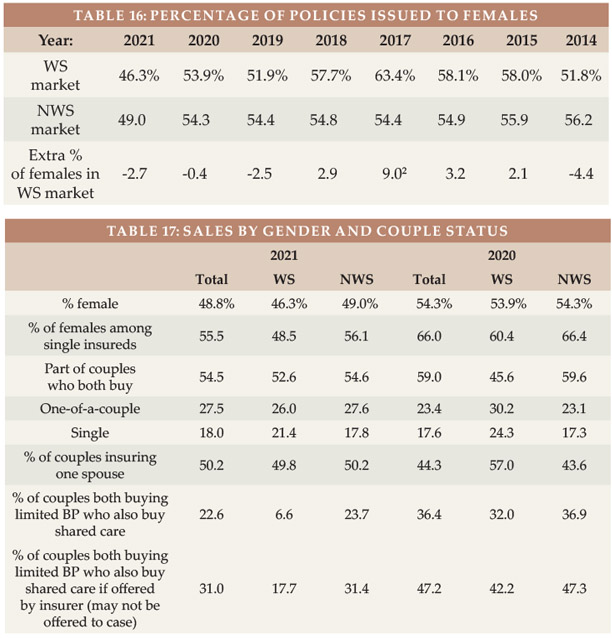
Table 16 shows distribution by EP and how many policies had a 0-day home care feature and a longer facility EP and how many policies had a calendar-day EP (as opposed to a service-day EP). We have reflected that all LifeSecure policies are 90-day EP with a calendar-day definition. Policies which have 0-day home care EP and define their EP as a service-day EP operate almost identically to a calendar-day EP, because people in facilities get daily care.

Gender Distribution and Sales to Couples and Relatives
Insurers began gender-distinct LTCI pricing in 2013, but unisex pricing continues to be typical in the WS market because of Title VII of the 1964 Civil Rights Act.

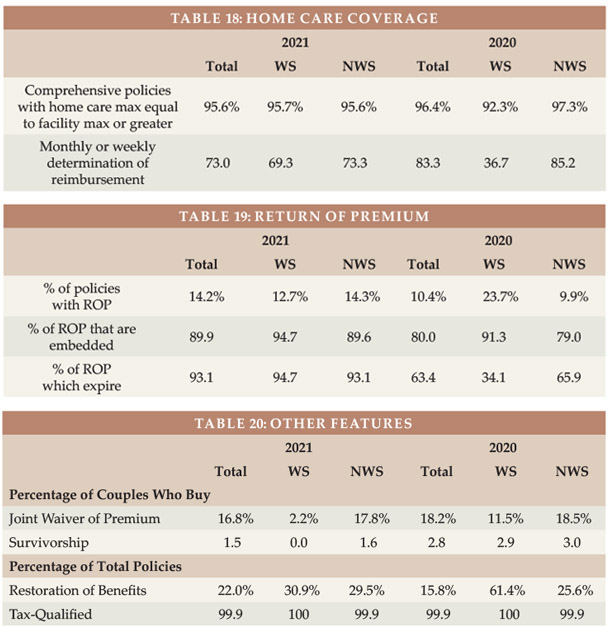
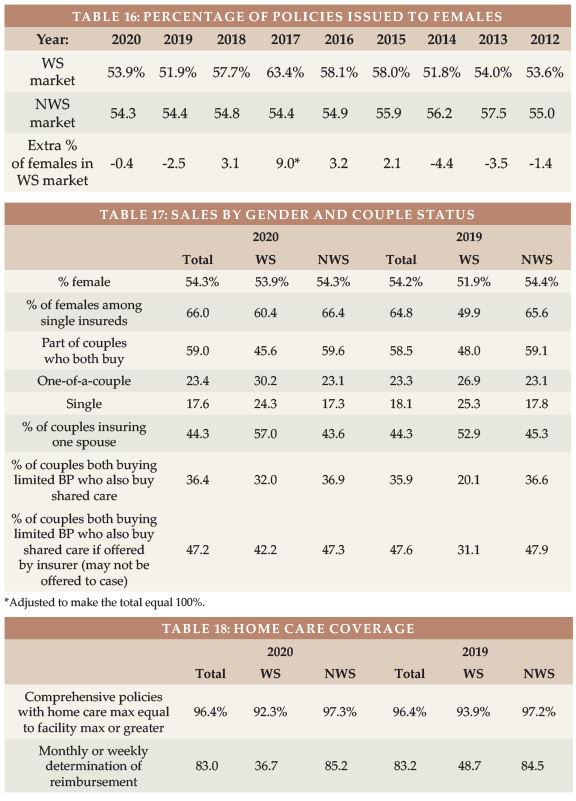
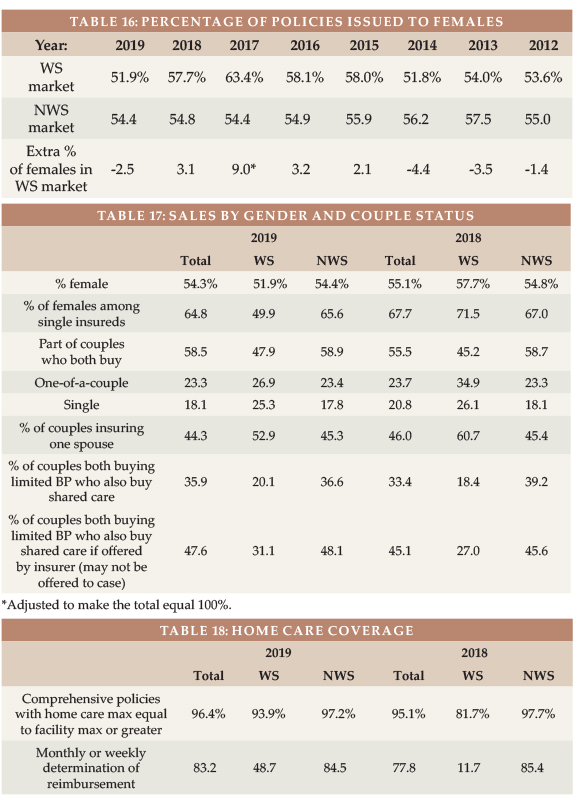
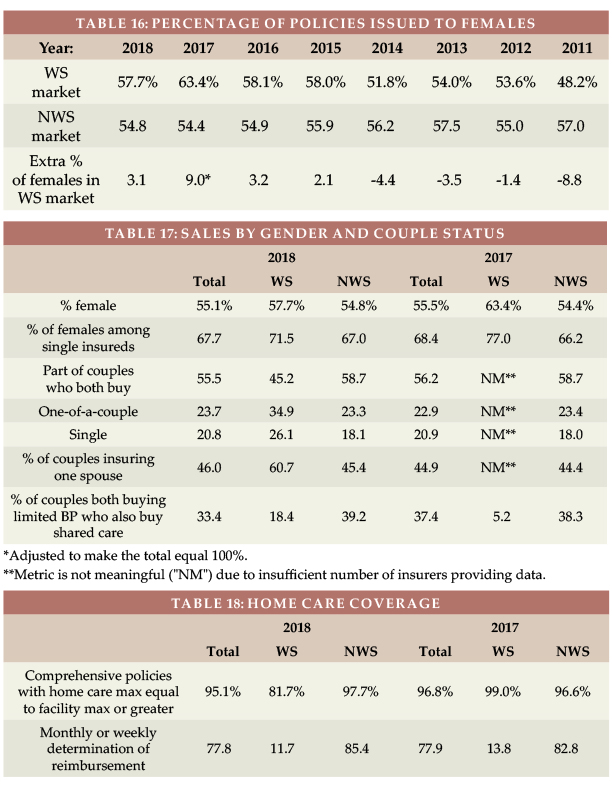
Women are 49.9 percent of the US age 20-79 population but have nearly always dominated LTCI sales1. Since 2016, the percentage of female buyers in the NWS has fluctuated from 54.1 to 54.9 percent (see Table 17), except for 2021 when the percentage of females dipped below 50 percent in both the WS and NWS markets because of the higher number of males purchasing coverage in WA. In 2022, the NWS market also had fewer than 50 percent females because of delayed processing of 2021 WA sales, but the Total market reverted to mostly female.

Table 17 also shows that the WS market generally experiences a higher percentage of female buyers (presumably because of unisex pricing), quantifying the above-mentioned “gender anti-selection” compared to the NWS market. To the degree that our WS data is over-weighted to executive carve-out programs, it likely understates the gender anti-selection of voluntary WS LTCI programs. Women make up 46.9 percent of workers but accounted for 55.7 percent of our reported 2023 WS sales2.

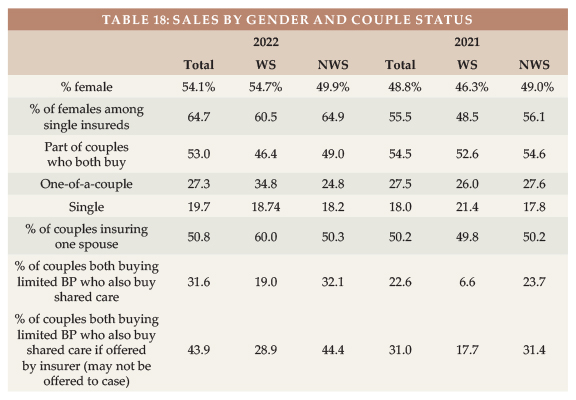
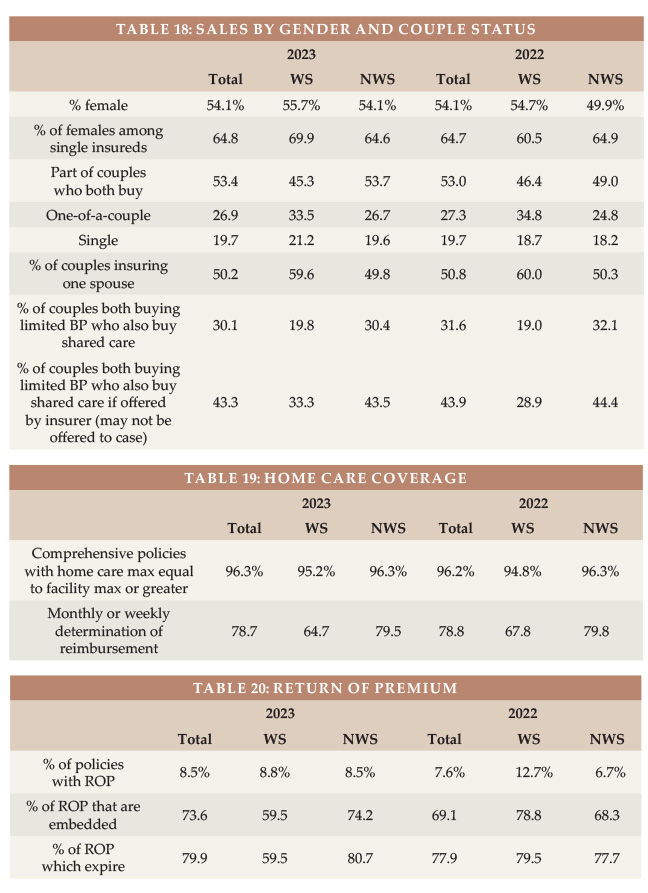
Table 18 digs deeper, exploring the differences between the WS and NWS markets in single female, couples, and Shared Care sales.
Our WS data has more couples who insure only one partner (59.6 to 49.8 percent in the NWS market). Shared Care is less often offered in a WS program.

Our limited data with regard to relatives who buy shows that two spouses are insured for every three employees. That’s a high percentage reflective of executive carve-out data. Over time, we have seen about one percent of purchasers are relatives other than the employees and employees’ spouses.
Type of Home Care Coverage
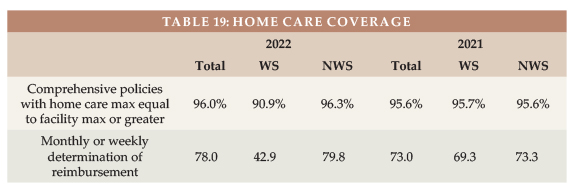
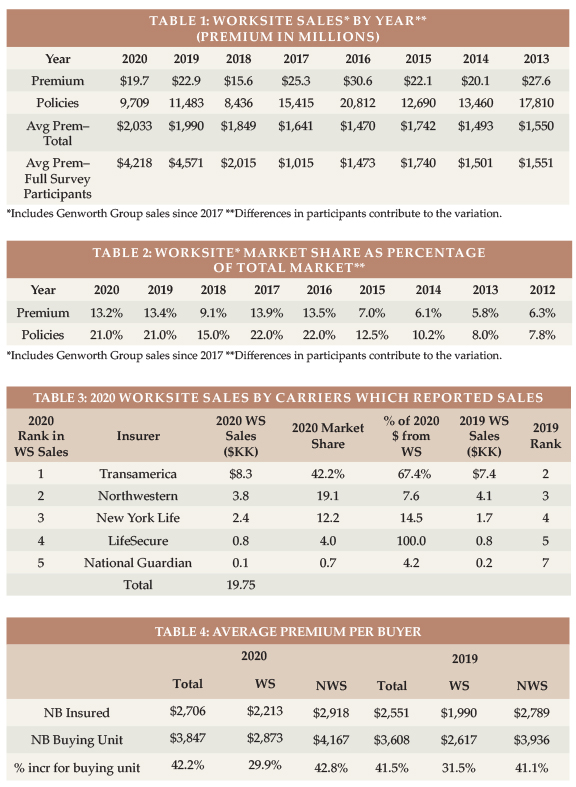
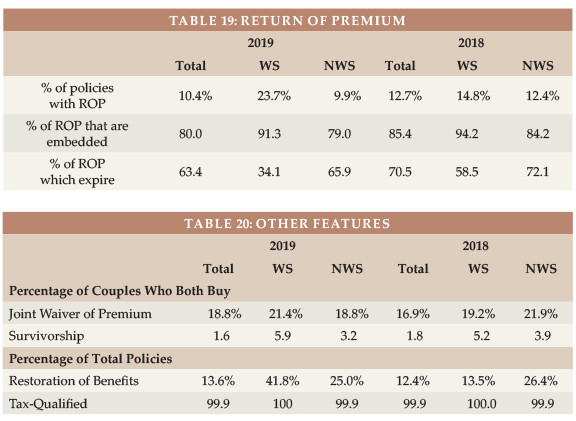
Table 19 summarizes sales by type of home care coverage and shows the frequency of monthly determination of benefits. Long ago, WS policies’ home care maximum monthly benefits were 50 percent of the facility benefit; today they are generally identical.

Other Features
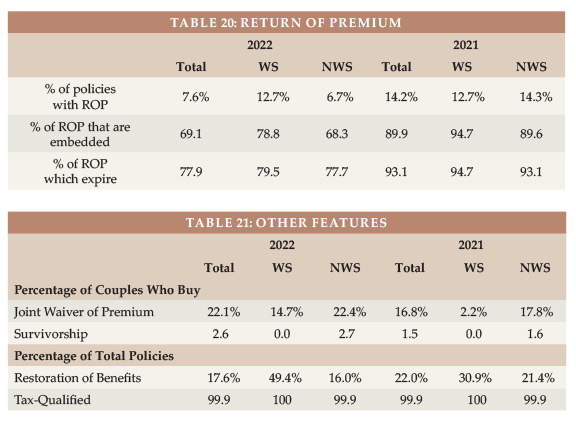
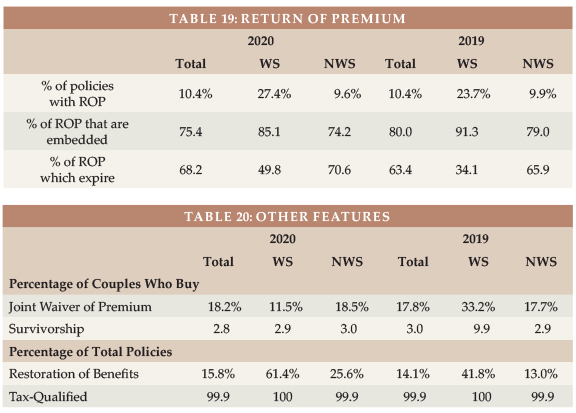
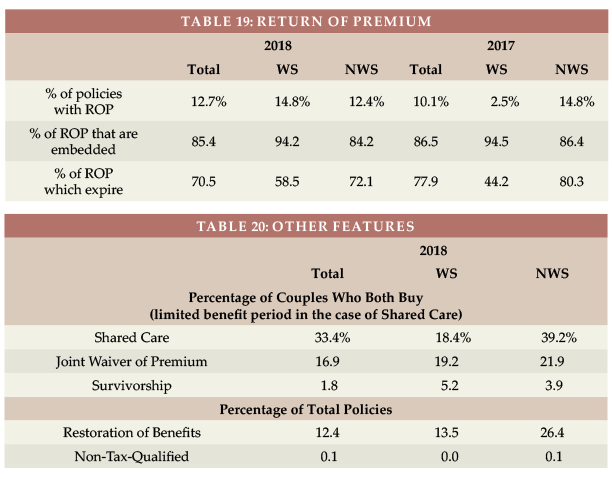
Table 20 shows that most Return of Premium (ROP) features are automatically included and phase out before death would be likely. ROP with expiring death benefits may provide an inexpensive way to encourage more young people to buy LTCI but does not address the buyer’s concern that they might pay all their life, then die in their 90s without qualifying for benefits.

Table 21 shows lower Joint Waiver of Premium and Survivorship sales to couples in the WS market than in the NWS market. Some products automatically provide Joint Waiver of Premium if a couple buys identical coverage or if a couple buys Shared Care. Employers sometimes are disinclined to add an optional couples’ feature because they are already contributing more money to cover both a married employee and that employee’s spouse than the cost for a single employee the same age.

CLOSING
We thank insurance company staff for submitting the data and responding to questions promptly. We also thank Sophia Fosdick and Quentin Clemens of Milliman for managing the data expertly.

We reviewed data for reasonableness. Nonetheless, we cannot assure that all data is accurate. If you have suggestions for improving this survey, please contact one of the authors.

References
1. https://www.statista.com/statistics/241488/population-of-the-us-by-sex-and-age/
2. Bureau of Labor Statistics, https://www.bls.gov/cps/cpsaat18b.htm
2023 Analysis Of Worksite LTCI

The 2023 Milliman Long Term Care Insurance Survey, published in the July issue of Broker World magazine, was the 25th consecutive annual review of long term care insurance (LTCI) published by Broker World magazine. It analyzed product sales, reported sales distributions, and detailed insurer and product characteristics.

From 2006-2009, Broker World magazine published separate group LTCI surveys, but discontinued those surveys when the availability of group LTCI policies shrank. In 2011, Broker World magazine began this August annual analysis of worksite (“WS”) sales to complement the July overall market analysis.

The WS market consists of individual policies and group certificates (“policies” comprises both henceforth) sold with employer support, such as permitting on-site solicitation and/or payroll deduction. If a business owner buys a policy for herself and pays for it through her business, participants likely would not report her policy as a WS policy because it was not part of a WS group. If an employer sponsors LTC/LTCI educational meetings, with employees pursuing any interest in LTCI off-site, sales would likely not be reported as WS sales.

We limit our analysis to US sales and exclude “combination” products, except where specifically indicated. (Combination products pay meaningful life insurance, annuity, or disability income benefits in addition to LTCI.)

As reported in Market Perspective, the bulk of worksite sales that cover support with activities of daily living (ADLs) or cognitive impairment do not qualify as LTCI under section 7702(B) and are not covered in this survey (except as specifically mentioned).

About the Survey
Participants
Seven participants (Bankers Life, Knights of Columbus, Mutual of Omaha, National Guardian Life, New York Life, Northwestern, and Thrivent) contributed broadly to stand-alone sales distributions reported herein. Total 2022 sales data includes one additional contributor (LifeSecure) and 2022 inforce data includes two additional contributors (LifeSecure and CalPERS).

Our survey includes stand-alone WS sales and statistical distributions from participants National Guardian Life, New York Life, and Northwestern, and WS sales data from contributor LifeSecure.

The following eleven insurers participated in our combination sales data: AFLAC, John Hancock, Mass Mutual, New York Life, Nationwide, Northwestern Mutual (Northwestern), OneAmerica, Pacific Life (2021 survey only), Securian, Trustmark and United of Omaha.

Comparisons of sales distributions
We compare WS sales to individual LTCI policies that are not WS policies (NWS) and to total sales (Total).

Our WS stand-alone statistical distributions can vary significantly from year-to-year because insurers focusing on particular WS markets may be over- or under-represented. As has been the case for several years, our worksite sales distributions are dominated by executive sales. Carriers that provided 2022 distributions had an average worksite annual premium of $2,565, excluding FPOs, whereas the insurers that provided sales, but not distributions, had an average worksite premium of $1,876 annually. We believe this difference is narrower than in the past several years because of the inclusion of delayed Washington sales in our 2022 WS data.

Highlights from This Year’s Survey
As explained in the July issue, a large number of 2021 applications were delayed by insurer backlog in 2021, eventually being issued in 2022. We successfully worked with most participants to reassign cases to 2021 so we could isolate the boost in 2021 sales driven by the Washington Cares Fund (WCF) exemption rules. Nonetheless, our total sales distributions are still somewhat impacted by delayed 2021 sales in the state of Washington.

Reassigning those policies was a lot of work for participants, so we chose not to reassign corresponding worksite policies to 2021. Thus, while our total distributions are largely adjusted for such lag, our WS distributions are not adjusted for such lag. Our NWS distributions are also not adjusted for such lag, because we calculated NWS distributions by subtracting unadjusted WS sales from unadjusted total sales. Readers should keep in mind that some results may be meaningfully different next year when all data will be on the same basis.

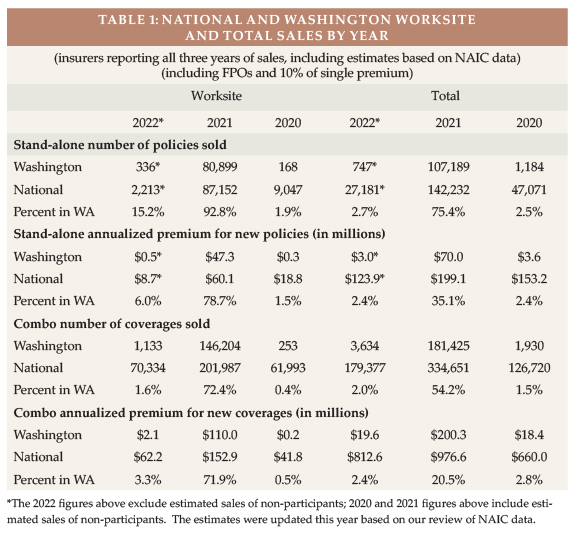
Table 1 shows the number of sales and premium in the total market and in the worksite market both nationally and in Washington for years 2020 to 2022. Including NAIC data for non-participants, it shows that Washington accounted for 75 percent of reported stand-alone LTCI policies sold in 2021 (an estimated 35 percent of premium) and 54 percent of combination life/LTCI policies (21 percent of premium).

Stand-alone worksite 2022 sales receded significantly from their higher, Washington-impacted 2021 sales. Participants reported worksite sales of 2,213 lives and $8.7 million in premium, compared to (for same companies) pandemic-influenced 2020 sales of 2,124 lives and $7.1 million of premium. Transamerica, which produced more 2020 worksite sales than all our participants combined, stopped selling in the first half of 2021 and is not included in the prior sentence. Thus, our participants appear to have, at best, absorbed a small portion of Transamerica’s share of the worksite market. As discussed in Market Perspective, many worksite sales with coverage for ADL-deficiency and cognitive impairment shifted to products that do not qualify as LTCI under section 7702(B).

As shown in Table 1, stand-alone WS sales (including Transamerica) dropped significantly from 2020 to 2022, but combo worksite reported sales increased by 13 percent (number of coverages) and 49 percent (annualized premium).

Worksite sales contributed eight percent of participants’ stand-alone sales in 2022 and seven percent of stand-alone annualized premium, as explained in the discussion of Table 3. Table 1 also shows that Washington accounted for 15 percent of the reported 2022 worksite cases and six percent of the worksite premium, indicating a low average premium for Washington sales compared to National. Washington’s higher market share in terms of policies is an indicator that our stand-alone worksite sales include many delayed 2021 sales. Our numbers reflect a significant drop in stand-alone LTCI sales in the worksite, which would be even greater had we adjusted worksite sales for the Washington sales lag.

As reported in our July issue, the number of 2021 Washington stand-alone LTCI sales was approximately 90 times the 2020 Washington sales. The ratio varies significantly between worksite insurers (483) and individual insurers (26).

In the combo market, worksite sales accounted for 39 percent of participants’ reported coverages sold and eight percent of annualized premium. Life/LTCI combo insurers sold 89 times as many coverages in Washington in 2021 than in 2020. The ratio also varies significantly between worksite insurers (578) and individual insurers (21). We include here some WS policies that qualified for exemption from the WCF tax even though they do not qualify under section 7702(B), which largely explains different results than some other reports. We have a good-sized sample of combo insurers, but a lower percentage of industry sales than in the stand-alone market.

MARKET PERSPECTIVE
There are three segments of the WS market. A single WS case may involve different segments for different employee classes.

  • In “core” (also known as “core/buy-up”) programs, employers pay for a small amount of coverage for generally a large number of employees. Employees can buy more coverage. “Core” programs generally have low average ages, short benefit periods, low daily maximum benefits and a small percentage of spouses insured.
  • In “carve-out” programs, employers pay for robust coverage for key executives and usually their spouses. Generally, executives can buy more coverage for themselves or spouses. Compared to “core” programs, a higher percentage of insureds are married, more spouses buy coverage, the age distribution is older and average premium is higher.
  • In “voluntary” programs, employers pay none of the cost. The typical coverage is more robust than “core” programs, but less robust than “carve-out” programs. Voluntary programs tend to be most weighted toward female purchasers.

National Guardian, New York Life, and Northwestern write mostly executive carve-out programs and are the only insurers that provided statistical distributions; therefore, our data is heavily weighted to the executive carve-out market. If an employer purchases coverage for only one or two employees, the insurer may not recognize the case as executive carve-out, in which case we would under-report executive carve-out sales.

Because of tax savings, small executive carve-out issue dates are weighted toward the end of the year. On the other hand, large voluntary cases are traditionally weighted toward fall enrollments with January 1 effective dates. Large voluntary cases are probably more evenly distributed through the year than in the past, but differences remain.

Carrier and product shift: Last year, we noted that the future of the non-executive carve-out LTCI market was unpredictable with Transamerica’s departure. This year’s decline in the stand-alone WS market was not surprising.

WS programs have gravitated toward products that include life insurance, which is viewed as a more immediate potential need by young employees with families. The possibility of guaranteed issue also draws employee benefit advisors and employers to such products. Such products can allow 100 to 300 percent of the death benefit to be used for “chronic illness” (defined in terms of ADLs and cognitive impairment), typically using up to four percent of the death benefit each month. Alternatively, they can allow 100 to 200 percent of the death benefit to be used, restoring used death benefit each month so beneficiaries will receive the full death benefit.

These products do not qualify as LTCI under section 7702(B). As they have a fixed chronic illness benefit, the purchasing power of the coverage typically deteriorates over time. For example, if a 30-year-old employee buys a $100,000 death benefit, she will have a $4,000 maximum monthly benefit for chronic illness (assuming the benefit features described above). That $4,000 benefit would cover a much higher percentage of her cost of care if she needed care in the next few years compared to if she needs care 50 years from now.

Washington Cares Fund: Washington state’s “Washington Cares Fund” (WCF) imposes a 0.58 percent employee-paid payroll tax to fund a $36,500 lifetime pool (intended to inflate according to the Washington consumer price index) for care, as defined in the Revised Code of Washington 50B.04, received in Washington. People who purchased private stand-alone or combination LTCI by November 1, 2021 could file to be exempt from the tax. WCF received approximately 484,000 applications for exemption.1

Other states are interested in state-run LTCI programs. Examples include:

  • California: A task force identified alternative programs which are being priced in 2023. Recommendations will be made to the legislature for possible 2024 legislation.
  • New York SB 9082 did not pass in 2022 and no legislation was proposed in NY’s 2023 legislative session. However, Governor Hochul issued an executive order in November 2022 citing her “vision of a long-term care system that is accessible, effective, and affordable.”2
  • In Minnesota, bills for a state LTCI program have been introduced twice. The state has commissioned a study to be produced in 2023 to explore alternatives.

Pricing and Underwriting Considerations: Most people interpret Title VII of the 1964 Civil Rights Act to require that employer-involved LTCI programs use unisex pricing if the employer has had at least 15 employees for at least 20 weeks either in the current or previous year. Some states apply similar laws to employers with fewer employees. The expense of separate pricing, marketing and administration discourages insurers from serving both the WS and NWS markets.

Moreover, insurers fear anti-selection. Because women have higher expected future claims, unisex pricing saves women money compared to gender-distinct NWS pricing, whereas men pay much more with unisex pricing than with gender-distinct pricing. Insurers may vary pricing based on the employees’ gender distribution.

Insurers also fear health anti-selection (less-healthy people buying, while healthier people do not buy). Insurers are more vulnerable to health- or gender-anti-selection if the group has a large portion of young or less affluent employees as this group is generally less likely to buy LTCI. When the coverage has a life insurance component, more employees are likely to buy, which can help reduce the insurer’s anti-selection concerns.

Furthermore, because WS programs rarely offer “preferred health” discounts, healthy couples may pay more for WS coverage than for corresponding NWS coverage.

To control risk, most insurers will not accept a voluntary WS program if there are fewer than 100 employees. However, one insurer (which offers no health concessions) will accept voluntary LTCI programs with as few as 2 to 5 (varies by jurisdiction) employees buying.

Because of tax advantages when an employer pays the premium, a more expensive WS product can still produce after-tax savings compared to a cheaper NWS policy. The specter of future tax increases enhances the attractiveness of employer-paid premium.

Availability of coverage: As few people younger than age 40 buy stand-alone LTCI, some insurers have raised their minimum issue age to avoid anti-selection and to reduce exposure to extremely long claims. Such age restrictions can discourage employers from introducing a program, especially a carve-out program if they have executives or spouses too young to be covered.

With increased remote work, more employers have employees stretched across multiple jurisdictions and eligible non-household relatives might live anywhere. But insurers may not offer a product in jurisdictions with difficult laws, regulations or practices, such as slow policy form approval. So, it can be difficult to find a product which can cover everyone unless LTCI is sold on a group policy form and the employer does not have individuals in extra-territorial states.

One contributor no longer offers WS LTCI to non-household relatives. Reduced availability for such relatives does not have much impact on sales, because typically a small percentage (about one percent of 2022 sales) of WS buyers are not an employee or partner. If a program does help elder relatives, it is still not likely to meaningfully address the negative impact of employees being caregivers.

Prior to gender-distinct pricing, an executive carve-out for two partners of a company with more than 15 employees could have been serviced by any LTCI company, but now it is hard to find a carrier that offers unisex pricing under such circumstances. Such executives may buy policies with gender-distinct pricing either because they are unaware of the requirement under Title VII of 1964 Civil Rights Act; they may disagree with the interpretation that such policies should have unisex pricing to avoid the risk of a civil rights complaint; etc.

Some employee benefit brokers are reluctant to embrace LTCI because of declinations, the effort of enrollment, certification requirements, their personal lack of expertise, etc. WS sales gain from LTCI specialists forming relationships with employee benefit brokers.

Support for Employees who are Caregivers: Various programs offer LTC-related services to employees and their families. Regardless of whether the employee is insured or the relative is insurable, they may be able to access information, advice, services, and products that make caregiving more efficient, more effective, safer, and less expensive. Enabling employees and their families to have better LTC experiences and to use more (not necessarily 100 percent) commercial care should boost productivity at work. Some of these programs are packaged with WS LTCI.

STATISTICAL ANALYSIS
As mentioned earlier, insurers’ sales distributions can vary greatly based on the submarket they serve (for example, in the WS market: core, voluntary, or carve-out). Therefore, in addition to fundamental changes in the industry, distributions may vary significantly from year to year due to a change in participating insurers, distribution within an insurer, and market share among insurers. Policies in the carve-out market are designed similarly to those in the NWS market. Our sales distributions reflect only stand-alone LTCI. Two insurers reported their number of new employer cases as well as the number of new worksite sales. Combined, they averaged 7 applications per new employer case, which seems to confirm the executive carve-out concentration in our data.

The aggregate sales section includes estimates for 2021 and 2020 to reflect a more accurate picture of the industry. Subsequent sections do not include sales estimates.

Aggregate Sales
Table 1 shows the number of sales and premium in the total market and in the worksite market both nationally and in Washington for years 2020 to 2022. Table 1 spotlights the impact of Washington on 2021 sales and the drop in worksite sales in 2022.

Last year, to provide a clearer view of what happened in Washington in 2021, we estimated 2020 and 2021 sales from non-participants. A lot of 2021 sales, particularly worksite sales, were made by non-participants. However, the non-participant with the bulk of the 2021 sales stopping selling in mid-2021. In 2022, we did not estimate sales of non-participants, as our general observations of the market would be unchanged.

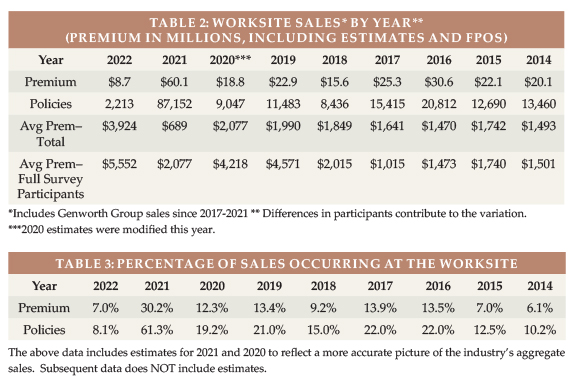
Table 2 shows historical WS sales over a longer period of time, including some estimates based on our review of NAIC data. It shows overall average WS premium for all carriers that reported sales compared to the average WS premium for the participants who contributed statistical data beyond sales. As shown in Table 2, our WS statistics likely represented the broad WS market reasonably until 2017 (the WS average premium for survey participants was similar to the total average premium before 2017). Average premiums plummeted last year because of the WA sales. We believe the full survey participant average premium was lowered by delayed Washington policies.

Table 3 shows WS sales as a percentage of total LTCI sales. As noted earlier, the WS percentage declined in 2022 due to an insurer dropping out of the market. The 2022 percentages would be significantly lower if we had removed the sales pushed into 2022 by the flood of 2021 applications.

Chart02-03-2023-Of-Worksite-LTCI

Market Share
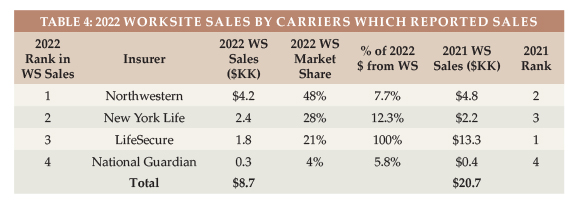
Table 4 shows the insurers’ reported WS sales, including FPOs and additions to worksite cases issued in prior years. Excluding FPOs, New York Life would have been in the lead, followed by LifeSecure.

Chart04-2023-Of-Worksite-LTCI

We also examined the distribution of new insureds by jurisdiction for both the total market and the WS market. The WS market share of five states (AK, IA, ND, VA and WA) was 50 percent or more greater than their overall market share (e.g., if they had a two percent overall market share, they had at least a three percent market share in WS). In 18 jurisdictions, the market share of total sales was at least 50 percent greater than the WS market share, suggesting that there may be opportunity for WS sales in these jurisdictions: AL, CO, IN, KS, ME, MD, MA, MI, MO, NE, NH, NM, PA, SC, TX, UT, VT, and WI. In five jurisdictions, our participants had no stand-alone WS sales at all (DC, RI, WV, WY, and Puerto Rico).

Average Premium Per Buyer
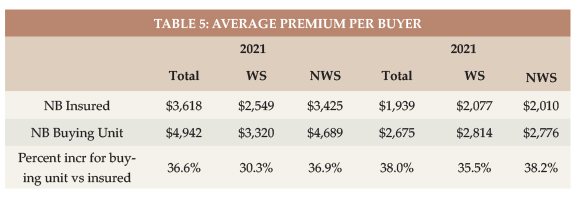
Table 5 shows the average premium per new insured (NB Insured) and per buying unit (a couple comprise a single buying unit). For these two average sizes to be comparable, we must include only insurers which report sales for couples. The average premium per new insured including all insurers that reported sales is $3,556.

Chart05-2023-Of-Worksite-LTCI

As always, the average premium per buying unit (a couple comprise a single buying unit) is higher because there are fewer buying units than insureds. Normally, the increase in average premium per buying unit compared to per insured is lower for WS sales, because more WS buyers are single and because spouses are less likely to buy in the WS. However, in the carveout market, more buyers are married and spouses are more likely to buy.

Issue Age
In reviewing the balance of the statistical presentations, we urge you to be selective in how you use the data because it is not representative of the entire WS market as explained above.

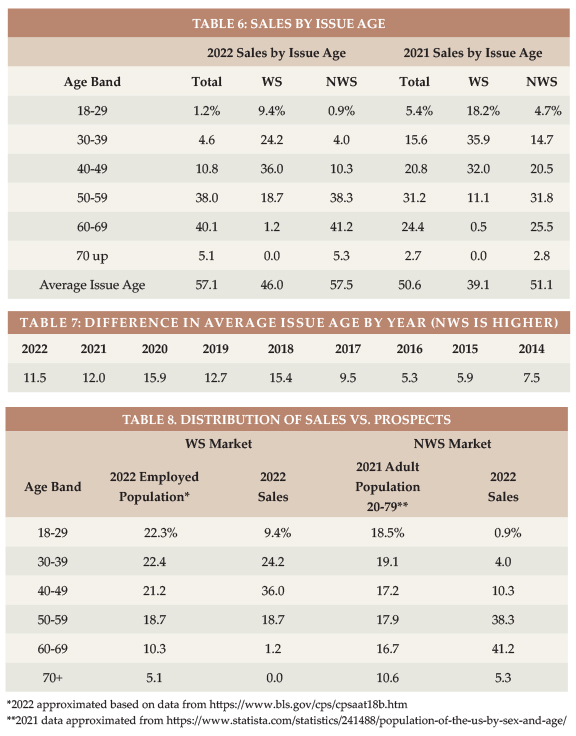
Table 6 shows that the average age increased 6 to 7 years for both the NWS market and the WS market, which was generally expected due the influence of 2021 Washington sales.

Table 7 shows how much older the average NWS buyer has been compared to the average WS buyer.

Table 8 displays the relative age distribution of workers ages 16+ vs. the age distribution of purchasers in the WS market. It also shows the age distribution of adults 20-79 compared to the age distribution of purchasers in the NWS market. If the percentage of sales in a particular age group is higher than the percentage of population in that age group, we can conclude either that LTCI is more appealing to that age group or that the industry gets in front of that age group more. For whichever reason, the industry is particularly effective with ages 40-49 in the WS market. In the NWS market, the industry is particularly effective for ages 50-69.

Chart06-08-2023-Of-Worksite-LTCI

Rating Classification
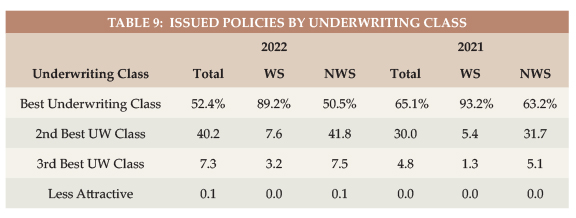
Most WS sales are in the “best” underwriting class (see Table 9) because there generally is only one underwriting class. Insurers often do not get enough information in WS to determine whether a “preferred health” discount could be granted and use the additional revenue (from not having a “preferred health” discount) to fund extra cost resulting from gender or health anti-selection. Carve-out programs are more likely to offer a “preferred” discount, which means a higher percentage of carve-out policies are issued in the second-best underwriting class. The percentage of policies issued in the best underwriting class soared in the NWS market in 2021 because younger and healthier buyers were drawn to LTCI in WA.

Chart09-2023-Of-Worksite-LTCI

Benefit Period
The WS average benefit period is low for core/buy-up programs and somewhat low for voluntary programs. Executive carve-out programs sometimes have longer benefit periods than the NWS market. In 2022, the average benefit period returned to pre-2021 levels. The NWS market had an average benefit period of 3.70 years compared to 3.76 in 2020. The WS market had an average benefit period of 3.44 compared to 3.54 in 2020.

The difference in benefit periods between the markets is larger than these statistics indicate, because these statistics ignore Shared Care (the WS market issues much less Shared Care).

Table 11 shows corresponding data back to 2014. As noted elsewhere, this data can jump around based on which insurers provide such detail and whether large core/buy-up cases are written in a particular year.

Chart10-11-2023-Of-Worksite-LTCI

Maximum Monthly Benefit
In 2020, the average initial monthly maximum was about nine percent lower in the WS market than in the NWS market. In 2021, the difference tripled to 27 percent lower in the WS market. To calculate the average initial monthly maximum, we presume an average size in each size range. The $2,100/month we assume for the smallest size range seems to overstate dramatically in 2021 as many people opted for the minimum $1,500/month.

The Total Market average initial monthly maximum was the highest we have seen since 2015 partly due to a shift in distribution away from the WS market (see Table 13). The WS initial monthly maximum varies more over time than the whole market because of participant changes and how many core/buy-up plans were sold in a particular year.

Chart12-13-2023-Of-Worksite-LTCI

Benefit Increase Features
As shown in Table 14, 9.1 percent of 2022 WS sales had compounding of three percent or higher, compared to 2.8 percent in 2021 (and 5.6 percent in 2020). Of the 2022 WS sales, 24 percent had no increase feature and 63 percent had a FPO feature.

In the NWS market, 29.2 percent had three percent or higher compounding compared to 24.5 percent in 2021 (and a 35.5 percent in 2020).

Future Protection
Based on a $27/hour cost for non-professional personal care at home ($27 is the median cost according to Genworth’s 2021 Cost of Care Survey), the average WS initial maximum daily benefit of $145 would cover 5.4 hours of such care per day at issue, whereas the typical NWS initial daily maximum of $169 would cover 6.2 hours of such care per day, as shown in Table 15.

Chart14-15-2023-Of-Worksite-LTCI

The number of future home care hours that could be covered depends upon when care is needed (we have assumed age 80), the home care cost inflation rate between now (age 46 for WS and 58 for NWS) and age 80 (we have calculated with two, three, four, five and six percent inflation), and the benefit increases provided by the LTCI coverage between now and age 80.

Table 15 shows calculations for three different assumptions relative to benefit increase features:

  • The first line presumes that no benefit increases occur (either sold without any benefit increase feature or no FPOs were exercised).
  • The second line reflects the average benefit increase design using the methodology reported in the July article, except it assumes that 40 percent of FPOs are elected (intended to be indicative of “positive” election FPOs, in which the increase occurs only if the client elects it) and provide five percent compounding.
  • The third line is like the second line except it assumes 90 percent of FPOs are elected (intended to be indicative of “negative” election FPOs, in which the increase occurs unless the client rejects it). It also assumes the FPOs reflect five percent compounding.

Table 15 indicates that:

  1. Without benefit increases, purchasing power deteriorates significantly, particularly for the WS purchaser as younger buyers have more years of future inflation prior to claim onset. For example, with a flat benefit, the number of covered hours of home care at age 80 drops to 2.0 hours for the average WS purchase age if there is three percent inflation and fewer than 2 hours if inflation is higher. The average NWS buyer would have 3.3 hours of care (rather than 2 hours) at age 80 if they had no benefit increases and inflation was three percent because the average NWS buys a larger daily benefit and is older.
  2. The “composite” (average) benefit increase design assuming that 40 percent of FPO offers are exercised preserves purchasing power better than when no increases are assumed. The average WS buyer gains buying power over time if the inflation rate is two percent, being able to pay for 6.7 hours at age 80. But if the inflation rate is four percent, this drops approximately in half. The average NWS buyer does better because of a higher initial maximum daily benefit and a higher issue age.

Assuming that 90 percent of FPO offers are exercised, this buyer would have at least as much coverage at age 80 as at issue if the inflation rate is less than four percent. The average NWS buyer has increasing purchasing power until inflation averages more than 3.3 percent.

Table 15 underscores the importance of considering future purchasing power when buying LTCI. Please note:

  • The average 2022 WS buyer was 12 years younger at issue than the average 2022 NWS buyer, hence has 12 more years of inflation and benefit increases in the above table. The actual inflation rate to age 80 is not likely to be the same for today’s 46-year-olds as for today’s 58-year-olds.
  • Individual results vary significantly based on issue age, initial maximum monthly benefit, and benefit increase feature, as well as the inflation rate and the age at which the need for care occurs.
  • Between the median age of starting to need care (about age 83) and the median age of needing care (about age 85), more purchasing power could be gained or lost.
  • Table 15 does not reflect coverage for professional home care or facility care. According to the 2021 Genworth study, the average nursing home private room cost is $297/day, which is currently comparable to 11 hours of non-professional home care. However, the inflation rate for facility costs is likely to differ from the inflation rate for home care. From 2004-2021, Genworth’s studies showed the following compound growth rates: private room in a nursing home (3.0 percent), assisted living facility (3.8 percent), home health aide (2.2percent), and home care homemaker (2.6 percent).
  • Table 15 could be distorted by simplifications in our calculations. For example, we assumed that the FPO election rate does not vary by age, size of policy or market and that everyone buys a home care benefit equal to the average facility benefit.
  • FPO election rates might be different for policies purchased in 2021. How likely is it that 2021’s WA buyers will exercise FPOs?

Partnership Program Background
When someone applies to Medicaid for long-term care services, most states with Partnership programs disregard assets up to the amount of benefits received from a Partnership-qualified policy (with some policies, IN and NY disregard all assets). Partnership programs exist in 44 jurisdictions (all but AK, DC, HI, MA, MS, UT, and VT), but MA has a similar program (MassHealth). The first four states to develop Partnerships (CA, CT, IN and NY) have different rules, some of which have become a hindrance to sales. We are not aware of a Partnership-qualified WS LTCI product in those four states, which is unfortunate because the WS market serves many people who could benefit from Partnership.

To qualify for a state Partnership program, a policy must have a sufficiently robust benefit increase feature. Many jurisdictions have lowered the minimum Partnership-eligible compounding benefit inflation rate to one percent. To facilitate Partnership sales in such jurisdictions, an insurer could lower its minimum size by 1/3 (e.g., from $1,500 to $1,000) if one percent compounding is included in a core program. The revenue from the core program would typically increase. The premium would be more level by issue age, shifting risk to younger ages which can be preferable for the insurer in a core program.

Jurisdictional Distribution
The 2023 Milliman Long Term Care Survey includes a chart of the market share of each US jurisdiction relative to the total, WS and NWS markets, and the Partnership percentage by state. This chart indicates where relative opportunity may exist to grow LTCI sales.

Elimination Period
More than 90 percent of the NWS market buys 90-day elimination periods (EPs). For that reason, many WS programs offer only a 90-day EP.

Table 16 shows distribution by EP and how many policies had a 0-day home care feature and a longer facility EP and how many policies had a calendar-day EP (as opposed to a service-day EP). We have reflected that all LifeSecure policies are 90-day EP with a calendar-day definition. Policies which have 0-day home care EP and define their EP as a service-day EP operate almost identically to a calendar-day EP, because people in facilities get daily care.

Gender Distribution and Sales to Couples and Relatives
Insurers began gender-distinct LTCI pricing in 2013, but as explained above, unisex pricing continues in the WS market.

In the NWS market, the 2013-2015 percentages of females were high as insurers that still offered unisex pricing attracted single females. The next 5 years, the percentage of female buyers in the NWS was stable, fluctuating from 54.3 to 54.9 percent. In 2021, women constituted 50.5 percent of the US age 20-79 population3, but in 2021 the percentage of females dipped below 50 percent in both the WS and NWS markets because of the higher number of males purchasing coverage in WA.

Chart16-17-2023-Of-Worksite-LTCI

In the WS market, the high percentage of female WS buyers from 2015-2018 suggests that women were particularly attracted to WS LTCI (presumably because of unisex pricing). To the degree that our more recent WS data is over-weighted to executive carve-out programs, it reflects less of the gender anti-selection that likely still exists. Although most executives are male, executive ranks are becoming more gender-balanced and many executive carve-out programs cover spouses. Women make up 47 percent of workers4 but accounted for 55 percent of our reported 2022 WS sales.

Table 18 digs deeper, exploring the differences between the WS and NWS markets in single female, couples and Shared Care sales. The percentage of NWS insureds who are female (49.9 percent) spotlights our statistical distribution difficulties this year. Insurers that reallocated sales from 2022 to 2021 probably moved a high percentage of males from total sales. As the worksite number of males was not adjusted, our method subtracted an unadjusted (high) number of WS males from an adjusted (low) number of total males, producing a misleading high number of NWS males, which explains our low 49.9 percent for females.

Chart18-2023-Of-Worksite-LTCI

Our WS data had more single buyers, but a lower percentage of single buyers were female.

Slightly more than half the couples in the WS market insured both partners; slightly fewer than half of the couples in the NWS market did so.

Shared Care is less often offered in a WS program.

Our limited data with regard to relatives who buy shows that two spouses are insured for every three employees. That’s a high percentage reflective of executive carve-out data. Only about one percent of purchasers are relatives other than the employees and employees’ spouses.

Type of Home Care Coverage
Table 19 summarizes sales by type of home care coverage. Historically, the WS market sold few policies with a home care maximum equal to the facility maximum. However, with increasing emphasis on home care and simplicity, that difference faded.

Chart19-2023-Of-Worksite-LTCI

Table 19 also shows that monthly determination dominates both markets.

Because some insurers build these features into products automatically, we are able to include data from an insurer which did not provide sales distributions.

Many WS products embed a “partial cash alternative” feature (which allow claimants, in lieu of any other benefit that month, to use approximately 1/3 of their benefit for whatever purpose they wish, with the balance extending the benefit period) or a small informal care benefit.

Other Features
Table 20 shows that almost all Return of Premium (ROP) features were embedded (automatically included) and phased out before death would be likely. ROP with expiring death benefits may provide an inexpensive way to encourage more young people to buy LTCI but does not address the buyer’s concern (what if I keep paying all my life, then die without qualifying for benefits?).

Table 21 shows lower Joint Waiver of Premium and Survivorship sales to couples in the WS market than in the NWS market, mostly due to differences in distribution by carrier. Some products automatically provide Joint Waiver of Premium if a couple buys identical coverage or if a couple buys Shared Care. Employers sometimes are disinclined to add an optional couples’ feature because they are already contributing more money to cover a married employee plus that employee’s spouse than the cost for a single employee the same age.

Chart20-21-2023-Of-Worksite-LTCI

CLOSING
We thank insurance company staff for submitting the data and responding to questions promptly. We also thank Sophia Fosdick and Quentin Clemens of Milliman for managing the data expertly.

We reviewed data for reasonableness. Nonetheless, we cannot assure that all data is accurate.
If you have suggestions for improving this survey, please contact one of the authors.

References

  1. Washington State Employment Security Department, https://media.esd.wa.gov/esdwa/Default/ESDWAGOV/Fact-Sheets/2023-wa-cares-overview-230113.pdf
  2. https://www.governor.ny.gov/news/governor-hochul-signs-executive-order-create-new-yorks-first-ever-master-plan-aging.
  3. https://www.statista.com/statistics/241488/population-of-the-us-by-sex-and-age/.
  4. Bureau of Labor Statistics, https://www.bls.gov/cps/cpsaat11.htm.

2022 Analysis Of Worksite LTCI

The 2022 Milliman Long Term Care Insurance Survey, published in the July issue of Broker World magazine, was the 24th consecutive annual review of long-term care insurance (LTCI) published by Broker World magazine. It analyzed product sales, reported sales distributions, and detailed insurer and product characteristics.

From 2006-2009, Broker World magazine published separate group LTCI surveys, but discontinued those surveys when the availability of group LTCI policies shrank. In 2011, Broker World magazine began this August annual analysis of worksite (“WS”) sales to complement the July overall market analysis.

The WS market consists of individual policies and group certificates (“policies” comprises both henceforth) sold with employer support, such as permitting on-site solicitation and/or payroll deduction. If a business owner buys a policy for herself and pays for it through her business, participants likely would not report her policy as a WS policy because it was not part of a WS group. If an employer sponsors general LTC/LTCI educational meetings, with employees pursuing any interest in LTCI off-site, sales would not be reported as WS sales.

We limit our analysis to US sales and exclude “combination” products, except where specifically indicated. (Combination products pay meaningful life insurance, annuity, or disability income benefits in addition to LTCI.)

About the Survey
Our survey includes WS sales and statistical distributions from National Guardian Life, New York Life, and Northwestern, and WS sales data from LifeSecure. We estimated sales from four other stand-alone LTCI insurers and compare WS sales to individual LTCI policies that are not WS policies (NWS) and to total sales (Total).

Highlights from This Year’s Survey

  • As we reported in our July 2022 article, results are heavily influenced by the state of Washington’s “Washington Cares Fund” (WCF, see the “Market Perspective” section for more info). To study the impact of the WCF, we surveyed combination product life insurers in addition to our typical survey of stand-alone LTCI companies. Approximately 60 percent of sales in each line occurred in Washington (“WA”). The industry sold more than 90 times as many stand-alone LTCI policies sales in WA in 2021 than in 2020 and, based on a significant sampling of combination (life and LTCI) policies, that product line also experienced in WA more than 90 times as many sales in 2021 than in 2020.
  • Driven by WCF’s exemption for private LTCI coverage, we estimate about 9.3 times as many stand-alone WS sales in 2021 (approximately 90,000 in 2021) compared to 2020, while NWS sales increased 47 percent. However, we estimate that new annualized premium grew at a slower pace compared to policy counts—WS premium tripled in 2021 (approximately $60 million in 2021), while NWS premium increased by six percent. The smaller growth in premium arises because the 2021 sales had a higher mix of younger age individuals and a higher mix of less-expensive policies, which was driven by WA sales where individuals sought lower cost policies that would earn exemption from WCF. Our data does not allow us to estimate how much stand-alone LTCI WS sales increased in WA.
  • Our WS stand-alone statistical distributions can vary significantly from year-to-year because insurers focusing on particular WS markets may be over- or under-represented. We estimate that our statistical distributions reflect only about five percent of WS policies. The carriers providing 2021 statistical data had an average WS annual premium of $2,077 (less than half as much as last year, due to WA sales), whereas the others had an estimated average WS premium of $600, which indicates that our statistical analysis continues to be overly weighted toward executive carve-out programs.
  • Ten insurers contributed combination sales data: AFLAC, John Hancock, Mass Mutual, New York Life, Nationwide, Northwestern Mutual, OneAmerica, PacLife, Securian, and Trustmark. 64.9 percent of their national combined 300,000 sales and 13.4 percent of their national $1.1 billion of new annualized premium were WS sales. Of national WS combined Life/LTCI sales, 73 percent of both the new policies and new premium were in WA. Within WA, 79 percent of new policies and 50 percent of new premium came from WS sales.
  • Although we have a significant sample, full industry life/LTCI combination sales may differ significantly if our data is over-weighted (or under-weighted) toward WS business, as the WS market grew in WA much more than the NWS market did.

MARKET PERSPECTIVE
The three segments of the WS market (which may apply to different employee classes in a single case):

  • In “core” (also known as “core/buy-up”) programs, employers pay for a small amount of coverage for generally a large number of employees. Employees can buy more coverage. “Core” programs generally have low average ages, short benefit periods, low daily maximum benefits and a small percentage of spouses insured.
  • In “carve-out” programs, employers pay for robust coverage for key executives and usually their spouses. Generally, executives can buy more coverage for themselves or spouses. Compared to “core” programs, a higher percentage of insureds are married, more spouses buy coverage, the age distribution is older and average premium is higher.
  • In “voluntary” programs, employers pay none of the cost. The typical coverage is more robust than “core” programs, but less robust than “carve-out” programs. Voluntary programs tend to be most weighted toward female purchasers.

National Guardian, New York Life, and Northwestern write mostly executive carve-out programs and are the only insurers that contributed to our statistical distributions; therefore, our data is heavily-weighted to the executive carve-out market.

Because of tax savings, small executive carve-out issue dates are weighted toward the end of the year. On the other hand, large voluntary cases are traditionally weighted toward fall enrollments with January 1 effective dates. Large voluntary cases are probably more evenly distributed through the year than in the past, but differences remain.

Carrier and product shift: The future of the non-executive carve-out LTCI market is unpredictable with Transamerica’s departure. Even if LifeSecure, Mutual of Omaha, and National Guardian pick up market share, WS stand-alone LTCI sales might drop, at least temporarily because it takes time for competitors to fill in after an insurer drops out.

Particularly for young and less-affluent groups, voluntary programs may gravitate toward products that include life insurance, which is viewed as a more immediate potential need by young employees with families. The possibility of guaranteed issue also draws employee benefit advisors and employers to such products. Such products can allow 100 to 300 percent of the death benefit to be used for LTC, at a typical rate of four percent of the death benefit per month. Unfortunately, combination WS products’ LTCI benefits can lose substantial purchasing power by retirement years because the benefit typically does not increase.

WCF: WA state’s “Washington Cares Fund” imposes a 0.58 percent employee-paid payroll tax to fund a $36,500 lifetime pool (intended to inflate according to the WA consumer price index) for care received in WA as defined in the Revised Code of WA 50B.04. However, people who purchased qualifying private stand-alone or combination LTCI by November 1, 2021 could file to be exempt from the tax. (Note: WCF had received 478,173 applications for exemption as of June 13, 2022.1)

Other jurisdictions may create state-run LTCI programs, but they may not create a window for people to become exempt by buying insurance after the law has passed.

COVID: COVID-19 (COVID) continues to impact the employee benefit market in many ways. As LTCI is generally not perceived to be an urgently-needed benefit, LTCI may be more impacted than some other benefits. Employers potentially have various existential issues that may take precedence over offering LTCI. Staff turn-over is generally higher and more positions are vacant. Shifting of the workforce to remote can be harder to enroll, all else equal.

Nonetheless, COVID did not appear to deter the WA WS sales and, as a result of COVID, there is increased awareness of the LTC risk and of personal exposure and increased interest in staying out of nursing homes. More workers may have elders living in their homes and, if they are remote workers, the needs of those elders are more likely to interfere with their productivity.

Pricing and Underwriting Considerations: Most people interpret Title VII of the 1964 Civil Rights Act to require that employer-involved LTCI programs use unisex pricing if the employer has had at least 15 employees for at least 20 weeks either in the current or previous year. Some states apply similar laws to employers with fewer employees. Thus, for WS sales, insurers must create a separate unisex-priced product. The expense of separate pricing, marketing and administration discourages insurers from serving both the WS and NWS markets.

Moreover, insurers fear anti-selection. Because women have higher expected future claims, unisex pricing saves women money compared to gender-distinct NWS pricing, whereas men pay much more for WS than for NWS policies. The higher the percentage of female buyers in the WS, the more unisex pricing is likely to approach gender-distinct female pricing levels.

Insurers also fear health anti-selection (less-healthy people buying, while healthier people do not buy). Insurers are more vulnerable to health- or gender-anti-selection if the group has a large portion of young or less affluent employees as this group is generally less likely to buy LTCI.

Furthermore, because WS programs rarely offer “preferred health” discounts, healthy couples may pay more for WS coverage than for corresponding NWS coverage. Although there are few health concessions in the stand-alone WS market at this time, some combination products offer guaranteed issue if participation requirements are satisfied.

To control risk, most insurers will not accept a voluntary WS program if there are fewer than 100 employees. However, one insurer (which offers no health concessions) will accept voluntary LTCI programs with as few as 2 to 5 (varies by jurisdiction) employees buying.

In the carve-out market, a more expensive WS product can still produce after-tax savings compared to a cheaper NWS policy, because of tax advantages when an employer pays the premium. The specter of future tax increases enhances the attractiveness of employer-paid premium.

Availability of coverage: Some insurers have raised their minimum issue age to avoid anti-selection (few people buy below age 40) and to reduce exposure to extremely long claims. Such age restrictions can discourage employers from introducing a program, especially a carve-out program if they have executives or spouses under age 40.

With increased remote work, more employers have employees stretched across multiple jurisdictions and eligible non-household relatives might live anywhere. But insurers are less likely than in the past to offer LTCI in jurisdictions with difficult laws, regulations or practices. So, it can be difficult to find an insurer which can cover everyone unless LTCI is sold on a group policy form and the employer does not have individuals in extra-territorial states.

One insurer no longer offers WS LTCI to non-household relatives. Reduced availability for such relatives does not have much impact on sales, because only about one percent of WS sales are to non-household relatives. However, it undermines the suggestion that WS LTCI programs might reduce the negative impact of employees being caregivers.

Prior to gender-distinct pricing, an executive carve-out for two partners of a company with more than 15 employees could have been serviced by any LTCI company, but now it is hard to find a carrier that offers unisex pricing under such circumstances. Such executives may buy policies with gender-distinct pricing either because they are unaware of the requirement under Title VII of 1964 Civil Rights Act; they may disagree with the interpretation that such policies should have unisex pricing to avoid the risk of a civil rights complaint, etc.

Some employee benefit brokers are reluctant to embrace LTCI because of declinations, the effort of enrollment, certification requirements, their personal lack of expertise, etc. WS sales gain from LTCI specialists forming relationships with employee benefit brokers.

Support for Employees who are Caregivers: Various programs offer LTC-related services to employees and their families. Regardless of whether the employee is insured or the relative is insurable, they may be able to access information, advice, services, and products that make caregiving more efficient, more effective, safer, and less expensive. Enabling employees and their families to have better LTC experiences and to use more (not necessarily 100 percent) commercial care should boost productivity at work. Some of these programs are packaged with WS LTCI.

STATISTICAL ANALYSIS
As mentioned earlier, insurers’ sales distributions can vary greatly based on the submarket they serve (for example, in the WS market: core, voluntary, or carve-out). Therefore, in addition to fundamental changes in the industry, distributions may vary significantly from year to year due to a change in participating insurers, distribution within an insurer, and market share among insurers. Policies in the carve-out market are designed similarly to those in the NWS market. Our sales distributions reflect only stand-alone LTCI and only about five percent of stand-alone WS policies issued in 2021, unless otherwise noted. The distributions mostly represent the executive carve-out market, as these insurers averaged 10.6 issues per case.

Sales and Market Share
Table 1 shows historical WS sales, including some estimates. It shows overall average WS premium for all carriers which reported sales compared to the average WS premium for the participants who contributed statistical data beyond sales. As shown in the table, until 2017, our WS statistics likely represented the broad WS market reasonably. Average premiums plummeted this year because of the WA sales.

Table 2 shows WS sales as a percentage of total LTCI sales, both including estimates. WA sales caused WS sales to be larger percentage of the total compared to past survey data.

Table 3 and the following tables do not include estimates. Thus, Transamerica, which was the #1 insurer in 2020 and 2021, is not included. LifeSecure leapfrogged to the top.

Average Premium Per Buyer
Table 4 shows that, in 2021, the average premium per insured in the WS market dropped twice as much from 2020 levels than did the average premium in the NWS market.

As always, the average premium per buying unit (a couple comprise a single buying unit) is higher because there are fewer buying units than insureds. Normally, the increase in average premium per buying unit compared to per insured is significantly lower for WS sales, because more WS buyers are single and because spouses are less likely to buy in the WS. Those factors are muted materially because our data is weighted toward the carveout market. In 2021, the reported differences are small, perhaps influenced by the WA sales.

The average premium per new insured (NB Insured) reflects all participants, but the average premium per buying unit is determined solely by the participants who report sales based on marital status. The WS ratio is probably overstated because participants who reported premium by marital status for the WS are not characteristic of the entire market.

Issue Age
In reviewing the balance of the statistical presentations, we urge you to be selective in how you use the data because it is not representative of the entire WS market as explained above.

Table 5 shows that WA sales dropped the average age in the NWS market by 7 years, but only by 3 years in the WS market. If our data included more of the WS market, our WS average age might have dipped more.

Table 7 displays the relative age distribution of workers ages 16+ vs. the age distribution of purchasers in the WS market. It also shows the age distribution of adults 20-79 compared to the age distribution of purchasers in the NWS market. If the percentage of sales in a particular age group is higher than the percentage of population in that age group, the LTCI industry penetrates that age group well. As was the case last year, when we instituted this table, the industry is particularly effective with ages 30-49 in the WS market. In the NWS market, the industry was particularly effective for ages 50-69 last year, but this year broadened the effective range down to 30 because of WA sales.

Rating Classification
Most WS sales are in the “best” underwriting class (see Table 8) because there generally is only one underwriting class. Insurers often do not get enough information in WS to determine whether a “preferred health” discount could be granted and use the additional revenue (from not having a “preferred health” discount) to fund extra cost resulting from gender or health anti-selection. Carve-out programs are more likely to offer a “preferred” discount, which means a higher percentage of carve-out policies are issued in the second-best underwriting class. The percentage of policies issued in the best underwriting class soared in the NWS market in 2021 because younger and healthier buyers were drawn to LTCI in WA. The impact on the WS market was smaller, because so few people did not qualify in the best category in 2020. In each market, about 35 percent of buyers who did not qualify for the best price in 2020 shifted into the best category in 2022.

Benefit Period
The WS average benefit period is low for core/buy-up programs and somewhat low for voluntary programs. Executive carve-out programs sometimes have longer benefit periods than the NWS market. In 2021, the average benefit period in each market dropped by about a half-year due to WA sales.

The difference in benefit periods between the markets is actually larger than these statistics indicate, because these statistics ignore Shared Care (and the WS market issues much less Shared Care).

Table 10 shows corresponding data back to 2014. As noted elsewhere, this data can jump around based on which insurers provide such detail and whether large core/buy-up cases are written in a particular year.

Maximum Monthly Benefit
In 2020, the average initial monthly maximum was about nine percent lower in the WS market than in the NWS market. In 2021, the difference tripled to 27 percent lower in the WS market. To calculate the average initial monthly maximum, we presume an average size in each size range. The $2,100/month we assume for the smallest size range seems to overstate dramatically in 2021 as many people opted for the minimum $1,500/month.

Table 12 shows that the WS initial monthly maximum has varied more over time than the whole market, because of participant changes and how many core/buy-up plans were sold in a particular year.

Benefit Increase Features
As shown in Table 13, 95.5 percent of 2021 WS sales had no benefit increase feature or a future purchase option (FPO), hence no first-year premium for benefit increases. The corresponding NWS percentage was 64.1 percent. The corresponding 2020 sales percentages were 86.4 percent and 47.5 percent.

Future Protection
Based on a $27/hour cost for non-professional personal care at home ($27 is the median cost according to Genworth’s 2021 Cost of Care Survey), the average WS initial maximum daily benefit of $100 would cover 3.7 hours of such care per day at issue, whereas the typical NWS initial daily maximum of $137 would cover 5.1 hours of such care per day, as shown in Table 14. This year’s higher cost (the hourly cost was $24 in 2020) and lower initial monthly maximums contributed to the 40 percent decrease in WS hours (from 6.2 WS hours) and 25 percent decrease in NWS hours (from 6.8 NWS hours) from last year.

The number of future home care hours that could be covered depends upon when care is needed (we have assumed age 80), the home care cost inflation rate between now (age 39 for WS and 51 for NWS) and age 80 (we have calculated with two, three, four, five and six percent inflation), and the benefit increases provided by the LTCI coverage between now and age 80.

Table 14 shows calculations for three different assumptions relative to benefit increase features:

  • The first line presumes that no benefit increases occur (either sold without any benefit increase feature or no FPOs were exercised).
  • The second line reflects the average benefit increase design using the methodology reported in the July article, except it assumes that 40 percent of FPOs are elected (intended to be indicative of “positive” election FPOs, in which the increase occurs only if the client elects it) and provide five percent compounding.
  • The third line is like the second line except it assumes 90 percent of FPOs are elected (intended to be indicative of “negative” election FPOs, in which the increase occurs unless the client rejects it). It also assumes the FPOs reflect five percent compounding.

Table 14 indicates that:

  1. Without benefit increases, purchasing power deteriorates significantly, particularly for the WS purchaser as younger buyers have more years of future inflation prior to claim onset. With four percent inflation and no benefit increases, the number of covered hours of home care at age 80 dropped from 1.8 for the average 2019 WS buyer to 1.4 for the average 2020 WS buyer, then to 0.7 (only 42 minutes) for the average 2021 WS buyer. For the average NWS buyer, the corresponding hours of home care at age 80 were 3.0 in 2019, 2.9 in 2020, and 1.6 in 2021.
  2. The “composite” (average) benefit increase design assuming that 40 percent of FPO offers are exercised preserves purchasing power better than when no increases are assumed, but still generally leads to significant loss of purchasing power. The average 2021 WS buyer would have 2.1 hours of covered home care at age 80 rather than the 0.7 hours in #1. The average 2021 NWS buyer would have 3.4 hours of covered home care at age 80 rather than the 1.6 hours in #1.
  3. With 90 percent FPO election rates, the average WS and NWS buyers would experience increased purchasing power over time with 3 percent or less inflation but would lose purchasing power with four percent or more inflation.

Table 14 underscores the importance of considering future purchasing power when buying LTCI. Please note:

a) The average 2021 WS buyer was 12 years younger at issue than the average 2021 NWS buyer, hence has 12 more years of inflation and benefit increases in the above table. The actual inflation rate to age 80 is not likely to be the same for today’s 39-year-olds as for today’s 51-year-olds.

b) WS sales have more FPOs, so WS results are more sensitive to FPO election rates.

c) Individual results vary significantly based on issue age, initial maximum monthly benefit, and benefit increase feature, as well as the inflation rate and the age at which the need for care occurs.

d) By the median age of starting to need care (about age 83) and the median age of needing care (about age 85), more purchasing power could be gained or lost.

e) Table 14 does not reflect coverage for professional home care or facility care. According to the aforementioned 2021 Genworth study, the average nursing home private room cost is $297/day, which is currently comparable to 11 hours of non-professional home care. However, the inflation rate for facility costs is likely to differ from the inflation rate for home care. From 2004-2021, Genworth’s studies showed the following compound growth rates: private room in a nursing home (3.0 percent), assisted living facility (3.8 percent), home health aide (2.2 percent), and home care homemaker (2.6 percent).

f) Table 14 could be distorted by simplifications in our calculations. For example, we assumed that the FPO election rate does not vary by age, size of policy or market and that everyone buys a home care benefit equal to the average facility benefit.

g) FPO election rates might be different for policies purchased in 2021. How likely is it that 2021’s WA buyers will exercise FPOs?

Partnership Program Background
When someone applies to Medicaid for long-term care services, most states with Partnership programs disregard assets up to the amount of benefits received from a Partnership-qualified policy (some IN and NY policies disregard all assets). Partnership programs exist in 44 jurisdictions (all but AK, DC, HI, MA, MS, UT, and VT), but MA has a similar program (MassHealth). The first four states to develop Partnerships (CA, CT, IN and NY) have different rules, some of which have become a hindrance to sales. We are not aware of a Partnership-qualified WS LTCI product in those four states, which is unfortunate because the WS market serves many people who could benefit from Partnership.

To qualify for a state Partnership program, a policy must have a sufficiently robust benefit increase feature. Many jurisdictions have lowered the minimum Partnership-eligible compounding benefit inflation rate to one percent. To facilitate Partnership sales in such jurisdictions, an insurer could lower its minimum size by 1/3 (e.g., from $1,500 to $1,000) if one percent compounding is included in a core program. The revenue from the core program would typically increase. The premium would be more level by issue age, shifting risk to the younger ages which can be preferable for the insurer in a core program.

Jurisdictional Distribution
Click here for a chart of the market share of each US jurisdiction relative to the total, WS and NWS markets, and the Partnership percentage by state. This chart indicates where relative opportunity may exist to grow LTCI sales.

Elimination Period
Approximately 90 percent of the NWS market buys 90-day elimination periods (EPs). For that reason, many WS programs offer only a 90-day EP.

Table 15 shows distribution by EP and how many policies had a 0-day home care feature and a longer facility EP and how many policies had a calendar-day EP (as opposed to a service-day EP). We have reflected that all LifeSecure policies are 90-day EP with a calendar-day definition. Policies which have 0-day home care EP and define their EP as a service-day EP operate almost identically to a calendar-day EP, because people in facilities get daily care.

The large drop in WS 0-day home care EP reflects that Transamerica was in our data last year, but not this year.

Gender Distribution and Sales to Couples and Relatives
Insurers began gender-distinct LTCI pricing in 2013, but as explained above, unisex pricing continues in the WS market.

In the NWS market, the 2013-2015 percentages of females were high as insurers that still offered unisex pricing attracted single females. The next 5 years, the percentage of female buyers in the NWS was stable, fluctuating from 54.3 to 54.9 percent. In 2020, women constituted 50.8 percent of the US age 20-79 population2, but in 2021 the percentage of females in the NWS market dipped below 50 percent (49 percent) because of the higher number of males purchasing coverage in WA.

In the WS market, the high percentage of female WS buyers from 2015-2018 suggests that women were particularly attracted to WS LTCI (presumably because of unisex pricing). To the degree that our more recent WS data is over-weighted to executive carve-out programs, it reflects less of the gender anti-selection that likely still exists. Although most executives are male, executive ranks are becoming more gender-balanced and many executive carve-out programs cover spouses. Women make up 47 percent of workers3 but accounted for a bit less (46 percent) of our reported 2021 WS sales. For the third straight year, our data (overly weighted toward executive carveout) has indicated negative gender anti-selection in the WS market, as the 2021 shift to males was stronger in our WS data than in our NWS data.

Table 17 digs deeper, exploring the differences between the WS and NWS markets in single female, couples and Shared Care sales.

Our WS data had fewer single buyers. Despite having more married buyers, there were fewer one-of-a-couple sales and “both buy” couples increased from 45.6 percent of sales to 52.6 percent.

In contrast, the percentage of single people and one-of-a-couple both increased in the NWS market.

Shared Care sales dropped but are likely to rebound in 2021.

Our limited data with regard to relatives who buy shows that two spouses are insured for every three employees. That’s a high percentage reflective of executive carve-out data. Only about one percent of purchasers are relatives other than the employees and employees’ spouses.

Type of Home Care Coverage
Table 18 summarizes sales by type of home care coverage. Historically, the WS market sold few policies with a home care maximum equal to the facility maximum. However, with increasing emphasis on home care and simplicity, that difference faded.

Table 18 also shows that monthly determination dominates both markets. The low 2020 monthly determination percentage in the WS was caused primarily by a change in distribution of WS sales among participants.

Many WS products embed a “partial cash alternative” feature (which allow claimants, in lieu of any other benefit that month, to use approximately 1/3 of their benefit for whatever purpose they wish, with the balance extending the benefit period) or a small informal care benefit.

Other Features
Table 19 shows that almost all Return of Premium (ROP) features were embedded (automatically included) and phased out before death would be likely. ROP with expiring death benefits may provide an inexpensive way to encourage more young people to buy LTCI but does not address the buyer’s concern (what if I keep paying all my life, then die without qualifying for benefits?).

Table 20 shows lower Joint Waiver of Premium and Survivorship sales to couples in the WS market than in the NWS market, mostly due to differences in distribution by carrier. Some products automatically provide Joint Waiver of Premium if a couple buys identical coverage or if a couple buys Shared Care. Employers sometimes are disinclined to add an optional couples’ feature because they are already contributing more money to cover a married employee plus that employee’s spouse than the cost for a single employee the same age.

CLOSING
We thank insurance company staff for submitting the data and responding to questions promptly. We also thank Sophia Fosdick, Rachelle Jacobs, and Zane Truesdell of Milliman for managing the data expertly.

We reviewed data for reasonableness. Nonetheless, we cannot assure that all data is accurate.
If you have suggestions for improving this survey, please contact one of the authors.

References

  1. Elizabeth Hovde, “Update on number of people opting out of state’s long-term-care program”, June 15, 2022, http://www.washingtonpolicy.org/publications/detail/update-on-number-of-people-opting-out-of-states-long-term-care-program#:~:text=People%20who%20have%20private%20long,apply%20for%20exemption%20until%20December.
  2. https://www.statista.com/statistics/241488/population-of-the-us-by-sex-and-age/.
  3. Bureau of Labor Statistics, https://www.bls.gov/cps/cpsaat11.htm.

2021 Analysis Of Worksite LTCI

The 2021 Milliman Long Term Care Insurance Survey, published in the July issue of Broker World magazine, was the 23rd consecutive annual review of long-term care insurance (LTCI) published by Broker World magazine. It analyzed product sales, reporting sales distributions and detailed insurer and product characteristics.

From 2006-2009, Broker World published separate group LTCI surveys, but discontinued those surveys when the availability of group LTCI policies shrank. In 2011, Broker World began this August annual analysis of worksite (“WS”) sales to complement the July overall market analysis.

The WS market consists of individual policies and group certificates (“policies” henceforth) sold with employer support, such as permitting on-site solicitation and/or paying or collecting premiums. If a business owner buys a policy for herself and pays for it through her business, participants likely would not report her policy as a WS policy because it was not part of a WS group. If a business sponsors general LTC/LTCI educational meetings, with employees pursuing any interest in LTCI off-site, sales would not be reported as WS sales.

We limit our analysis to US sales and exclude “combination” products, except where specifically indicated. (Combination products pay meaningful life insurance, annuity, or disability income benefits in addition to LTCI.)

About the Survey
Our survey includes WS sales and statistical distributions from National Guardian Life, New York Life, and Northwestern and WS sales data from LifeSecure and Transamerica. We estimated sales from some other insurers and compare WS sales to individual LTCI policies that are not WS policies (NWS) and to total sales (Total).

The July issue included data for the California Public Employees Retirement System (CalPERS) program. CalPERS eligibility is based on California public employment, but the program operates more like an affinity group than a WS group, so it was counted as affinity sales in July and is in the NWS data, not the WS data, in this article.
Ten percent of single premiums are included as annualized premiums.

Highlights from This Year’s Survey

  • We estimate 2020 WS sales of 9,700 policies (approximately 20 percent of total sales) for $19.75 million (nearly 15 percent of total new annualized premium) which is a about a 15 percent decrease in both premium and number of sales from 2019. The premium includes 2020 future purchase options exercised on policies issued in the past.
  • In 2019, WS sales had rebounded from low 2018 sales. 2020 appeared likely to be another good year until the pandemic struck, hampering sales activities from April through year-end. As different WS markets have different seasonal sales patterns, the pandemic can impact statistical characteristics as well as sales.
  • We estimate that our WS sales total includes more than 95 percent of the stand-alone WS LTCI market, but our statistical distributions reflect only about 15 percent of WS policies. Our WS statistical distributions can vary significantly from year-to-year because insurers focusing on particular WS markets may be over- or under-represented. The carriers that provided 2020 statistical data had an average WS annual premium of $4,218 whereas the ones that provided only total sales had an average WS premium of $1,665, which indicates that our statistical analysis, like last year, is overly weighted toward executive carve-out programs. While these averages are quite close to the previous year’s numbers ($4,568 and $1,627), they can vary greatly year over year. The corresponding 2018 averages were $2,015 and $1,561. In 2017, the difference was in the other direction ($1,015 vs. $1,441).

MARKET PERSPECTIVE
The three segments of the WS market (which may apply to different employee classes in a single case):

  • In “core” (also known as “core/buy-up”) programs, employers pay for a small amount of coverage for generally a large number of employees. Employees can buy more coverage. “Core” programs generally have low average ages, short benefit periods, low daily maximum benefits and a small percentage of spouses insured.
  • In “carve-out” programs, employers pay for robust coverage for key executives and usually their spouses. Generally, executives can buy more coverage for themselves or spouses. Compared to “core” programs, a higher percentage of insureds are married, more spouses buy coverage, the age distribution is older and the average premium is higher.
  • In “voluntary” programs, employers pay nothing toward the cost of coverage. The typical coverage is more robust than “core” programs, but less robust than “carve-out” programs. Voluntary programs tend to be most weighted toward female purchasers.

National Guardian, New York Life, and Northwestern write mostly executive carve-out programs, whereas Genworth, LifeSecure, Mutual of Omaha, and Transamerica have significant voluntary and core buy-up business. Because we received statistical distributions from the former but not the latter, our 2020 and 2019 statistical distributions are more representative of the executive carve-out subset of the market.

Because of tax savings, small executive carve-out plans are weighted toward the end of the year. On the other hand, large voluntary cases were traditionally weighted toward fall enrollments with January 1 effective dates. Large voluntary cases are probably more evenly distributed through the year than in the past, but differences remain.

Carrier Changes: MassMutual ceased sales, hence will have, at most, negligible WS sales in 2021. Transamerica ceased accepting new cases at the end of March 2021 and ceased accepting new apps on June 30. However, Transamerica’s sales might be strong in 2021 because some employers sought WS programs in advance of the November 1 deadline in order for employees to qualify to opt out of the Washington Cares Fund tax, as explained below. In 2020, Genworth temporarily ceased sales, but has since resumed. These developments will impact total industry WS sales and change insurers’ market shares as well as the statistical characteristics of WS sales.

The WCF: The State of Washington created the Washington Cares Fund (WCF) through passage of the LTSS Trust Act. In January 2022, the state will begin collecting 0.58 percent payroll tax on wages to fund a $36,500 lifetime pool of money starting in 2025. The pool of money is intended to inflate thereafter according to the WA consumer price index. Coverage applies for vested individuals receiving care in WA and is not portable out-of-state.

The law allows people to opt out of the program and not pay the tax if they purchase LTCI by 11/1/2021. Therefore, 2021 private LTCI sales could be impacted if some people choose to opt out for reasons such as: Intend to retire outside of Washington; believe they will not obtain enough vesting credits; have high wages; want more robust coverage; want to cover unemployed spouses; or want to benefit from the state Partnership program. We understand some employers either instituted WS programs or educated their employees so they could seek individual coverage if appropriate. Even employers outside WA were stimulated to act if they had WA-based employees.

COVID-19: In 2020, most scheduled enrollments were canceled or delayed, and it was obviously not a good time for employers to consider implementing a new WS program.

Enrollments of newly-eligible employees continued in 2020 for existing programs, being performed in web meetings.

Early 2021 was also not a good time for enrollments, due to COVID-19, focus on “re-opening”, continued high unemployment and volatility in the work force.

Pricing Considerations: Most people interpret Title VII of the 1964 Civil Rights Act to require that employer-involved LTCI programs use unisex pricing if the employer has had at least 15 employees for at least 20 weeks either in the current or previous year. Some states apply similar laws to employers with fewer employees. Thus, for WS sales, insurers must create a separate unisex-priced product. The expense of separate pricing, marketing and administration discourages insurers from serving both the WS and NWS markets.

Moreover, insurers fear anti-selection. Because women have higher expected future claims, unisex pricing saves women money compared to gender-distinct NWS pricing, whereas men pay much more for WS than for NWS policies. The higher the percentage of female buyers in the WS, the more unisex pricing is likely to approach sex-distinct female pricing levels.

The recent evolution of couples’ discounts (discussed in our July article) might impact WS programs directly or indirectly.

Because healthy, young, and less affluent people are less likely to buy LTCI, insurers also fear health anti-selection (less-healthy people buying, while healthier people do not buy). Furthermore, because WS programs rarely offer “preferred health” discounts, healthy heterosexual couples may pay more for WS coverage than for corresponding NWS coverage. Therefore, there are few health concessions in the stand-alone WS market at this time. However, some combination products offer guaranteed issue if participation requirements are satisfied.

In the carve-out market, a more expensive WS product can still produce after-tax savings compared to a cheaper NWS policy, because of tax advantages when employers pay the premium.

In addition to health and gender distribution, insurers are also careful about age and income distributions of WS cases they accept. Insurers are more vulnerable to health- or gender-anti-selection if the group has a lot of young or less affluent employees.

Some insurers have raised their minimum issue age to avoid anti-selection (few people buy below age 40) and to reduce exposure to extremely long claims. Such age restrictions can discourage employers from introducing a program, especially a carve-out program if they have executives or spouses under age 40.

To control risk, most insurers will not accept a voluntary WS program if there are fewer than 100 employees. However, one insurer (which offers no health concessions) will accept voluntary LTCI programs with as few as two to five employees buying (minimum varies by jurisdiction).

Availability of coverage: With increased remote work, more employers have employees stretched across multiple jurisdictions and eligible non-household relatives might live anywhere. But insurers are less likely than in the past to offer LTCI in jurisdictions with difficult laws, regulations or practices. So, it can be difficult to find an insurer which can cover everyone unless LTCI is sold on a group chassis and the employer does not have individuals in extra-territorial states.

One insurer no longer offers WS LTCI to non-household relatives. Reduced availability for such relatives does not have much impact on sales, because only about one percent of WS sales are to non-household relatives. However, it undermines the suggestion that WS LTCI programs might reduce the negative impact of employees being caregivers.

Prior to sex-distinct pricing, an executive carve-out for two partners of a company with more than 15 employees could have been serviced by any LTCI company, but now it is hard to find a carrier that offers unisex pricing under such circumstances. Such executives may buy policies with sex-distinct pricing either because they are unaware of the requirement under Title VII of 1964 Civil Rights Act, they are confident that no female will file a civil rights complaint, or they disagree with the interpretation that such policies should have unisex pricing to avoid the risk of a civil rights complaint, etc.

Some employee benefit brokers are reluctant to embrace LTCI because of declinations, the effort of enrollment, certification requirements, their personal lack of expertise, etc. WS sales gain from LTCI specialists forming relationships with employee benefit brokers.

Positive Factors: Despite the above problems, there are positives for the WS market.

As a result of COVID-19, there is increased awareness of the LTC risk and of personal exposure. In addition, there is increased interest in staying out of nursing homes. More workers may have elders living in their homes and, if they are remote workers, the needs of those elders are more likely to interfere with their productivity.

Potential future tax increases would increase the tax advantages of employer-paid premium.

Voluntary WS LTCI sales lack the tax advantages of employer-paid coverage. Therefore, voluntary programs for young and less-affluent groups may gravitate toward products that include life insurance, which is viewed as a more immediate potential need by young employees with families.

As most jurisdictions now permit policies with one percent compounding to qualify as Partnership policies, the WS should be a great venue to serve people who can benefit from state Partnership programs. Two insurers in the WS market currently offer one percent compounding. As explained in the Partnership section, sales of Partnership policies could likely be increased if more insurers offered one percent compounding and if they lowered the minimum monthly maximum for core/buy-up programs with one percent compounding.

Another potentially positive factor is the increased availability of combination products in the WS market. From the perspective of insurers and advisors selling stand-alone LTCI in this market, competition from combination products might be a negative. Furthermore, such combination products may produce relatively little purchasing power during retirement years because the monthly LTCI benefit is constrained to a portion (typically four percent) of the death benefit and because the benefit does not compound. However, combination products should expand the WS market.

Yet another positive are programs which offer free LTC-related services to employees and their families. Regardless of whether the employee is insured or the relative is insurable, they can access information, advice, services and products that make caregiving more efficient, more effective, safer and less expensive. Enabling employees and their families to have better LTC experiences and to use more (not necessarily 100 percent) commercial care should boost productivity at work.

With all of the above changes, it will be particularly interesting to see how 2021 sales develop.

STATISTICAL ANALYSIS
As mentioned earlier, insurers’ sales distributions can vary greatly based on the submarket they serve (for example, in the WS market: core, voluntary or carve-out). Therefore, distributions may vary significantly from year to year due to a change in participating insurers, in distribution within an insurer or in market share among insurers. Policies in the carve-out market are designed similarly to those in the NWS (non-worksite) market. Our sales distributions reflect only about 15 percent of WS policies and certificates issued in 2020 and are mostly representative of the executive carve-out market. For example, one insurer’s average WS case consisted of 5 policies being issued and another averaged 7 policies. One of the 3 insurers sold 61 more policies than it did in 2019, whereas the other two insurers sold about 35 percent fewer policies, which resulted in one insurer comprising 76 percent of the WS sales on which our distributions are based.

Sales and Market Share
Table 1 shows historical WS sales for all insurers reporting sales, including some estimates in 2020. As there are several WS markets and some have long lead times, there may be a lag before competitors can fill in after an insurer drops out.

Table 1 also shows the overall average WS premium compared to the average WS premium for the participants who contributed statistical data beyond sales. As shown in the table, until 2017, our WS statistics likely represented the broad WS market well.

Table 2 shows WS sales as a percentage of total LTCI sales. For the most part, this percentage has stayed relatively level in the past five years and much higher than prior to 2016.

As shown in Table 3, two insurers wrote 60 percent or more of their 2020 new premium in the WS, while the other insurers wrote 15 percent or less of their business in that market. The percentage of each insurer’s new premium that comes from WS sales did not change dramatically from 2019 to 2020.

Average Premium Per Buyer
Table 4 shows that, in 2020, the NWS average premium per buying unit (a couple comprise a single buying unit) was 42.8 percent higher than the average premium per insured. This dropped to 29.9 percent for WS sales, because more WS buyers are single and because spouses are less likely to buy in the WS. The average premium per new insured (NB Insured) reflects all participants, but the average premium per buying unit is determined solely by the participants who report sales based on marital status. The WS ratio is probably overstated because participants who reported premium by marital status for the WS are not characteristic of the entire market.

Issue Age
The balance of the statistical presentations are not representative of the entire WS market as explained above. We report the results we have available, though we urge you to be selective in how you use the data.

Not surprisingly, Table 5 shows the WS market is much more weighted to the younger ages, even with data that is disproportionately weighted to executive carve-out programs. The total industry average age and the NWS average age both rounded to the exact same age as in 2019. The WS average fell a bit.

Table 7 displays the relative age distribution of the workers ages 18+ to purchasers in the WS market and all adults 18-79 to purchasers in the NWS markets. In the WS market, the LTCI industry is particularly successful selling to ages 30-59; ages 40-49 represent 38.4 percent of sales but only 21.2 percent of employees. In the NWS market, the industry is particularly successful with 50-70 year-olds.

Rating Classification
Most WS sales are in the “best” underwriting class (see Table 8) because there generally is only one underwriting class. Insurers often do not get enough information in WS to determine whether a “preferred health” discount could be granted and use the additional revenue (from not having a “preferred health” discount) to fund extra cost resulting from gender or health anti-selection. Carve-out programs are more likely to offer a “preferred” discount, which means a higher percentage of carve-out policies are issued in the second-best underwriting class. The percentage of policies issued in the best underwriting class dropped in the NWS market in 2020 from 44.9 to 43.6 percent. However, it was higher than in either 2018 (43.1 percent) or 2017 (40.5 percent). Meanwhile the percentage in the WS market increased from 81.7 to 89.4 percent, partly due to a change in market share among insurers. The 2020 WS was lower than in either 2018 (93.9 percent) or 2017 (91.9 percent), but in 2017-18, our data included more large group business with significant health concessions.

Benefit Period
The WS average benefit period is low for core/buy-up programs and somewhat low for voluntary programs. Executive carve-out programs sometimes have longer benefit periods than the NWS market. Our 2020 WS and NWS average benefit periods are similar, with WS having significantly more two-year benefit periods this year. Last year, the average benefit period was the same in the WS and NWS markets.

Table 10 shows corresponding data back to 2013. As noted elsewhere, this data can jump around based on which insurers provide such detail and whether large core/buy-up cases are written in a particular year.

As discussed later, the WS market issues much less Shared Care.

Maximum Monthly Benefit
Even with a lot of executive carve-out business, Table 11 shows that the WS market has many core programs sold with a $50/day or $1500/month initial maximum benefit. In 2020, both the WS and NWS markets had more business concentrated between $3,000 and $5,999 initial monthly maximums.

Table 12 shows that the WS initial monthly maximum has varied more over time than the whole market, because of participant changes and how many core/buy-up plans were sold in a particular year.

Benefit Increase Features
As shown in Table 13, the WS market has more future purchase options (FPO), because of its core programs. The high indexed FPO WS percentage is caused by a change in carrier market share based on policy count.

Both the NWS market (15.9 to 14.5 percent) and the WS market (20.8 to 16.5 percent) saw decreases in the percentage of policies sold with no benefit increase feature.

Future Protection
Based on a $24/hour cost for non-professional personal care at home ($24 is the median cost according to Genworth’s 2020 Cost of Care Survey), the average WS initial maximum daily benefit of $148.90 would cover 6.2 hours of such care per day at issue, whereas the typical NWS initial daily maximum of $163.60 would cover 6.8 hours of such care per day, as shown in Table 14. This year’s higher cost (the hourly cost was $23 in 2019) contributed to the decrease in the number of initial covered hours from 6.8 (WS) and 7.1 (NWS) last year.

The number of future home care hours that could be covered depends upon when care is needed (we have assumed age 80), the home care cost inflation rate between now (age 42 for WS and 58 for NWS) and age 80 (we have calculated with two, three, four, five and six percent inflation), and the benefit increases provided by the LTCI coverage between now and age 80.

Table 14 shows calculations for 3 different assumptions relative to benefit increase features:

  • The first line presumes that no benefit increases occur (either sold without any benefit increase feature or no FPOs were exercised).
  • The second line reflects the average benefit increase design using the methodology reported in the July article, except it assumes that 40 percent of FPOs are elected (intended to be indicative of “positive” election FPOs, in which the increase occurs only if the client elects it) and provide five percent compounding.
  • The third line is like the second line except it assumes 90 percent of FPOs are elected (intended to be indicative of “negative” election FPOs, in which the increase occurs unless the client rejects it). It also assumes the FPOs reflect five percent compounding.

Table 14 indicates that:

  1. Without benefit increases, purchasing power deteriorates significantly, particularly for the WS purchaser because there are more years of future inflation for a younger buyer. With four percent inflation and no benefit increases, the number of covered hours of home care at age 80 dropped from 1.8 in 2019 to 1.4 in 2020 for the WS market and from 3.0 in 2019 to 2.9 in 2020 for the NWS market.
  2. The “composite” (average) benefit increase design assuming that 40 percent of FPO offers are exercised preserves purchasing power better than when no increases are assumed, but still generally leads to significant loss of purchasing power. The exceptions: both WS and NWS purchasers gain a bit of purchasing power if the inflation rate is only two percent (with a 40 percent FPO election rate, the composite is greater than two percent compounding). With three percent inflation, the NWS clients gain purchasing power but the WS clients lose a slight bit of purchasing power.
  3. With 90 percent FPO election rates, the average WS buyer would experience increased purchasing power with four percent or less inflation but would lose purchasing power with five percent or more inflation. The average NWS buyer gains purchasing power with three percent or less inflation but loses purchasing power with four percent or more inflation.

Table 14 also underscores the importance of considering future purchasing power when buying LTCI. Please note:

a) The average WS buyer was 16 years younger at issue, hence has 16 more years of inflation and benefit increases in the above table. The effective inflation rate to age 80 is not likely to be the same for 42-year-olds versus 58-year-olds purchasing today.

b) WS sales have more FPOs, so WS results are more sensitive to FPO election rates.

c) Results vary significantly based on an insured’s issue age, initial maximum daily benefit, and benefit increase feature, as well as the inflation rate and the age at which the need for care occurs.

d) By the median age of starting to need care (about age 83) and the median age of needing care (about age 85), more purchasing power could be gained or lost.

e) Table 14 does not reflect the cost of professional home care or a facility. According to the aforementioned 2020 Genworth study, the average nursing home private room cost is $290/day, which is currently comparable to 12.1 hours of non-professional home care. However, the inflation rate for facility costs is likely to differ from the inflation rate for home care. From 2004-2020, Genworth’s studies showed the following compound growth rates: private room in a nursing home (3.1 percent), assisted living facility (3.7 percent), home health aide (1.6 percent), and home care homemaker (2.2 percent).

f) Table 14 could be distorted by simplifications in our calculations. For example, we assumed that the FPO election rate does not vary by age, size of policy or market and that everyone buys a home care benefit equal to the average facility benefit.

Partnership Program Background
When someone applies to Medicaid for long-term care services, most states with Partnership programs disregard assets up to the amount of benefits received from a Partnership-qualified policy (some IN and NY policies disregard all assets). Partnership programs exist in 44 jurisdictions (all but AK, DC, HI, MA, MS, UT, and VT), but MA has a somewhat similar program (MassHealth). The first four states to develop Partnerships (CA, CT, IN and NY) have different rules, some of which have become a hindrance to sales. We are not aware of a Partnership-qualified WS LTCI product in those states, which is unfortunate because the WS market serves many people who could benefit from Partnership.

To qualify for a state Partnership program, a policy must have a sufficiently robust benefit increase feature. Many jurisdictions have lowered the minimum Partnership-eligible compounding benefit inflation rate to one percent. To facilitate Partnership sales in such jurisdictions, an insurer could lower its minimum size by 1/3 (e.g., from $1500 to $1000) if one percent compounding is included in a core program. The revenue from the core program would typically increase. The premium would be more level by issue age, shifting risk to the younger ages which is preferable for the insurer in a core program.

Jurisdictional Distribution
Broker World’s website (Click here) has a chart of the market share of each US jurisdiction relative to the total, WS and NWS markets, and the Partnership percentage by state. This chart indicates where relative opportunity may exist to grow LTCI sales.

Elimination Period
More than 90 percent of the NWS market buys 90-day elimination periods (EPs). For that reason, many WS programs offer only a 90-day EP. Yet, probably because we lack data for some insurers which sell almost entirely 90-day WS EP, our WS data shows many more WS policies with 180-day or longer EPs (7.8 percent) than in the NWS market (5.0 percent).

Table 15 also shows how many policies had a 0-day home care feature and a longer facility EP and how many policies had a calendar-day EP (as opposed to a service-day EP). We have reflected that all LifeSecure policies are 90-day EP with a calendar-day definition and all Transamerica sales have 0-day home care EP. Policies which have 0-day home care EP, but define their EP as a service-day EP operate almost identically to a calendar-day EP.

The significant differences in 0-day home care EP and in calendar-day EP by market reflect specific insurers’ design preferences; they do not appear to be driven by the market.

Gender Distribution and Sales to Couples and Relatives
Insurers began sex-distinct LTCI pricing in 2013, but, as explained above, unisex pricing continues in the WS market. The 2013-2015 percentages of females in the NWS market were high as insurers which still offered unisex pricing attracted single females.

In the past five years, the percentage of female buyers in the NWS has been stable, fluctuating from 54.3 to 54.9 percent.

From 2015-2018, the high percentage of WS buyers who are female suggested that women were particularly attracted to voluntary WS LTCI (presumably because of unisex pricing). Our WS results are heavily distributed to executive carve-out programs, and many executive carve-out programs cover spouses.

The low 2019 percentage of female sales in the WS was mostly attributable to a drop in female sales for a major insurer. That insurer’s percentage of female sales bounced partly back in 2020.

In 2020, women constituted 50.5 percent of the USA age 20-79 population1, but a slightly higher 54.3 percent of total LTCI purchases. Women were only 46.8 percent of workers2 but accounted for 53.9 percent of WS sales.

Table 17 digs deeper, exploring the differences between the WS and NWS markets in single female, couples and Shared Care sales.

It shows that the bounce-back in female sales at the WS was primarily among single people. Insuring one spouse became more common in the WS market, but when both spouses were insured, Shared Care became more common. Shared Care is less common in the WS market because it often is not offered and because spouses often don’t buy. Also, executive carve-out programs may feel that insuring spouses favors married personnel and that adding Shared Care does so to an undesirable degree.

The NWS market saw a shift to more couples-both-buying sales, but among sales to single people, the percentage of females increased.

Our limited data with regard to relatives who buy shows that two spouses are insured for every three employees. That’s a high percentage reflective of executive carve-out data. Only about one percent of purchasers are relatives other than the employee and employees’ spouses.

Type of Home Care Coverage
Table 18 summarizes sales by type of home care coverage. Historically, the WS market sold few policies with a home care maximum equal to the facility maximum. But with increasing emphasis on home care and simplicity, that difference faded. Yet, in 2020, there was a small drop in WS sales with a 100 percent home care benefit.

Table 18 also shows that monthly determination dominates the NWS market, but daily determination still dominates the WS market. The particularly low 2020 monthly determination percentage in the WS was caused primarily by a change in distribution of WS sales among participants.

Many WS products embed a “partial cash alternative” feature (which allow claimants, in lieu of any other benefit that month, to use approximately 1/3 of their benefit for whatever purpose they wish, with the balance extending the benefit period) or a small informal care benefit.

Other Features
Table 19 suggests that Return of Premium (ROP) became more common in the WS market in 2020 but a bit less common in the NWS market. In each market, the percentage of ROP features actively chosen by purchasers increased. The percentage of ROP riders that expire increased even though embedded ROP almost always expires. ROP with expiring death benefits can provide an inexpensive way to encourage more young people to buy LTCI but may not provide a meaningful benefit.

Table 20 shows significant drops in WS sales of Joint Waiver of Premium and Survivorship to couples, but and a significant increase in Restoration of Benefits (ROB). These changes are significantly related to changes in market share by insurer. All WS sales are tax-qualified. Our 2019 percentages are corrected in Table 20.

CLOSING
We thank insurance company staff for submitting the data and responding to questions promptly. We also thank Sophie Fosdick, Margaret Liang, Nicole Gaspar, and Alex Geanous of Milliman for managing the data expertly.

We reviewed data for reasonableness. Nonetheless, we cannot assure that all data is accurate.

If you have suggestions for improving this survey, please contact one of the authors.

References

  1. https://statisticstimes.com/demographics/country/us-sex-ratio.php#:~:text=Gender%20Ratio%20in%20the%20United%20States%20in%202020%20is%2097.948,to%2049.48%20percent%20male%20population.
  2. Bureau of Labor Statistics, https://www.bls.gov/cps/cpsaat11.htm.

2020 Analysis Of Worksite LTCI

The 2020 Milliman Long Term Care Insurance Survey, published in the July issue, was the 22nd consecutive annual review of long term care insurance (LTCI) published by Broker World magazine. It analyzed individual product sales and Genworth group sales, reporting sales distributions and detailed insurer and product characteristics.

From 2006-2009, Broker World published separate group LTCI surveys, but discontinued those surveys when the availability of group LTCI policies shrank. In 2011, Broker World began annual analysis of worksite sales of individual products in August to complement the July overall market analysis.

The worksite market consists of individual policies and group certificates (“policies” henceforth) sold with employer support, such as permitting on-site solicitation and/or paying or collecting premiums. If a business owner buys an individual policy and pays for it through her/his business, some participants may report such policies as “worksite” policies while others might not if it was not processed as a worksite group. If a business sponsors general LTC/LTCI educational meetings, with employees pursuing any interest in LTCI off-site, such sales are not counted here as WS sales.

We limit our analysis to U.S. sales and exclude “combination” products except where specifically indicated. (Combination products pay meaningful life insurance, annuity, or disability income benefits in addition to LTCI.)

About the Survey
Our survey includes worksite (WS) sales and statistical distributions from MassMutual, National Guardian Life, New York Life, and Northwestern, and worksite sales data from Genworth, LifeSecure and Transamerica. We compare WS sales to individual LTCI policies that are not worksite policies (NWS) and to total sales (Total).

The July issue also included sales of the California Public Employees Retirement System (CalPERS) program. CalPERS eligibility is based California public employment, but the program operates more like an affinity group than a worksite group, so it was counted as affinity sales in July and is not included as a worksite product in this article.

Ten percent of single premiums are included as annualized premiums.

Highlights from This Year’s Survey

  • Participants reported 2019 WS sales of 11,483 policies (21.0 percent of total sales) for $22.85 million (13.4 percent of new annualized premium). The premium includes 2019 future purchase options exercised on policies issued in the past.
  • In 2019, WS sales rebounded from the 2018 results we reported last year. The three insurers which are most focused on voluntary worksite LTCI programs all had sales increases of between 62 and 76 percent in 2019, despite increased competition from a new entrant and from life insurance LTCI linked-benefit programs.
  • Our worksite sales total includes nearly 100 percent of the stand-alone WS LTCI market, but our statistical distributions reflect only about 12 percent of worksite policies sold (28 percent of premium). Our worksite statistical distributions can vary significantly from year-to-year because insurers focusing on particular worksite markets may be over- or under-represented. Last year, we commented that the worksite business in our statistical analysis was overly weighted toward executive carve-out programs. This year that imbalance has increased. The carriers that provided 2019 statistical data had an average worksite annual premium of $4,568 whereas the ones that provided only total sales had an average worksite premium of $1,627. The corresponding 2018 averages were $2,015 and $1,561. In 2017, the difference was in the other direction ($1,015 vs. $1,441).

MARKET PERSPECTIVE
The three segments of the worksite market (which may apply to different employee classes in a single case):

  • In “core” (also known as “core/buy-up”) programs, employers pay for a small amount of coverage for generally a large number of employees; the employees can buy more coverage. “Core” programs generally have lower average ages, short benefit periods, low daily maximum benefits and a small percentage of spouses insured.
  • In “carve-out” programs, employers pay for robust coverage for generally a small number of executives and usually their spouses. Generally, employees can buy more coverage for themselves or spouses. Compared to “core” programs, a higher percentage of insureds are married, more spouses buy coverage and the age distribution is older.
  • In “voluntary” programs, employers pay nothing toward the cost of coverage. Coverage is more robust than “core” programs, but less robust than “carve-out” programs. Voluntary programs tend to be most weighted toward female purchasers.

MassMutual, National Guardian, New York Life and Northwestern write mostly executive carve-out programs, whereas Genworth, Transamerica and LifeSecure business includes significant voluntary and core buy-up business as well. Because the insurers that write mostly executive carve-out business provided statistical data this year and the other insurers provided only total sales, our statistical distributions are more representative of the executive carve-out subset of the market than all types of worksite sales.

Insurer Challenges in the Worksite Market
COVID-19: In 2020, worksite insurers, like most businesses, experienced challenges due to the COVID-19 pandemic. Most scheduled enrollments were canceled or delayed. Enrollments of newly-eligible employees continued, being done in web meetings. As a result, we expect 2020 worksite (and individual) LTCI sales to be lower than 2019.

We suspect 2021 will remain suppressed because a lot of new 2021 sales would typically be enrolled in the 4th quarter of 2020. Even if the worksite LTCI market were to bounce back quickly, we anticipate that a lot of 2021 activity would produce 2022 sales. Moreover, potential unemployment and reduced profitability (due to reduced sales and increased expenses) may blunt enthusiasm for new employee benefit programs. Employers may focus instead on protecting employees and clients from communicable diseases by testing and providing protective equipment to employees and clients. More comments about the impact of COVID-19 on the LTCI market were published on the Broker World Magazine website as part of our July analysis.

Pricing considerations: Most people interpret Title VII of the 1964 Civil Rights Act to require that employer-involved LTCI programs use unisex pricing if the employer has had at least 15 employees for at least 20 weeks either in the current or previous year. Thus, to sell at the WS, insurers must create a separate unisex-priced product. The expense of separate pricing, marketing and administration discourages insurers from serving both the WS and NWS markets.

Because healthy, young, and less affluent people are less likely to buy, insurers and enrollers fear health anti-selection (less-healthy people buying, while healthier people do not buy). Health concessions can exacerbate this risk, hence are less common and generous than in the past. There is no “guaranteed issue” stand-alone LTCI coverage; however, some combination products offer some guaranteed issue with adequate WS participation.

WS programs rarely offer “preferred health” discounts; insurers may not get enough health information to grant such a discount. Thus, heterosexual couples might pay more for a WS policy than a corresponding NWS policy, if the male spouse is older or buys more coverage and/or one or both spouses would qualify for a “preferred health” discount in the NWS market. In the carve-out market, a costlier LTCI product can still produce savings on an after-tax basis, because of the tax advantages when employers pay the premium.

Females get a good deal in a WS program compared to NWS pricing, but males pay more in the WS. Insurers fear that most worksite buyers might be female, hurting WS profitability. To the degree that sales skew to females, unisex pricing must approach sex-distinct female pricing (because females have higher expected future claims).

In addition to health and gender distribution, insurers are also careful about age and income distributions of WS cases they accept. Younger and less affluent people are less likely to buy LTCI, so insurers are more vulnerable to health- or gender-anti-selection if the group has a lot of young or less affluent employees.

Some insurers have raised their minimum issue age to avoid anti-selection (few people buy below age 40) and to reduce exposure to extremely long claims. Such age restrictions can discourage employers from introducing a program, especially a carve-out program if they have executives or spouses under age 40.

To control risk, most insurers will not accept a voluntary WS program if there are fewer than 100 employees. However, one insurer (which offers no health concessions) will accept voluntary LTCI programs with as few as two to five employees buying (minimum varies by jurisdiction).

Availability of coverage: With increased remote work, more employers have employees stretched across multiple jurisdictions and eligible non-household relatives might live anywhere. But insurers are less likely than in the past to offer LTCI in jurisdictions with difficult laws, regulations or practices. So, it can be difficult to find an insurer which can cover everyone unless LTCI is sold on a group chassis and the employer does not have individuals in extra-territorial states.

One WS insurer no longer offers WS LTCI to non-household relatives. Reduced availability for such relatives does not have much impact on sales, because few non-household relatives buy WS LTCI. However, it undermines the suggestion that WS LTCI programs might reduce the negative impact of employees being caregivers.

Prior to sex-distinct pricing, an executive carve-out for two partners of a company with more than 15 employees could have been serviced by any LTCI company, but now it is hard to find a carrier that will offer unisex pricing under such circumstances. Such executives may buy policies with sex-distinct pricing either because they are unaware of the requirement under Title VII of 1964 Civil Rights Act, they are confident that no female will file a civil rights complaint, or they disagree with the interpretation that such policies should have unisex pricing to avoid the risk of a civil rights complaint.

Some employee benefit brokers are reluctant to embrace LTCI because of declinations, the enrollment effort, certification requirements, their personal lack of expertise, etc. Increased WS sales are likely to depend upon LTCI specialists forming relationships with employee benefit brokers.

The Tax Cuts and Jobs Act of 2017 reduced the tax savings for C-Corporations buying LTCI for their employees and employees’ life partners. Pass-through entities may be the more attractive market now. Although the eligible premium is capped in a pass-through entity, a much higher marginal tax rate might apply than for a C-Corporation.

Voluntary worksite LTCI sales lack the tax advantages of employer-paid coverage. Therefore, voluntary programs for young and less-affluent groups may gravitate toward combo products as they include life insurance that is viewed as a more immediate potential need by young employees with families.

The worksite is a great venue to serve people who can benefit from the state Partnership programs (described in the Partnership section). In 2019, 30.5 percent of WS qualified for Partnership programs compared to only 10.3 percent in 2018. However, the increase is at least partly because executive carve-out sales dominate our statistical distributions. As executives are less likely to benefit from Partnership programs the increase may not be meaningful. Core/buy-up programs rarely include compounded benefits and employees often are not willing to pay for the compounding necessary to qualify for the Partnership program.

Regulators have “stepped up,” as 26 jurisdictions now accept policies issued at any age to qualify as Partnership policies even if maximum benefits compound by only one percent. The inclusion of one percent compounding at all ages can make core and voluntary WS programs more attractive. There is a potential market opportunity for an insurer willing to allow a lower minimum monthly maximum for core/buy-up programs with one percent compounding. Four other states permit one percent but only for ages 61+.

The worksite market should be poised for growth given the acceptance of one percent compounding benefits, Partnership qualification, attractive tax breaks, challenged government budgets, advantages over life/LTCI linked benefits (that lack Partnership and tax advantages), and a growing need for LTC insurance coverage. However, employers perceive that offering LTCI to their employees has little value for the employer. By the time the employee or spouse needs LTC, the employee will likely have terminated employment. Employee benefit brokers can help employers more effectively by expanding existing services that reduce the likelihood that employees’ elders will need LTC, which may make LTC more effective, more efficient, safer and less expensive. Enabling employees and their families to have better LTC experiences and to use more (not necessarily 100 percent) commercial care should boost productivity at work.

STATISTICAL ANALYSIS
As mentioned earlier, insurers’ sales distributions can vary greatly based on the submarket they serve (for example, in the WS market: core, voluntary or carve-out). Therefore, distributions may vary significantly from year to year due to a change in participating insurers, in distribution within an insurer or in market share among insurers. Our sales distributions reflect only about 12 percent of worksite policies and certificates issued in 2019 and are mostly representative of the executive carve-out market. For example, two insurers provided data regarding the number of worksite cases they opened up. Their combined average size was only three policies per worksite. Policies in the carve-out market are designed similarly to those in the NWS (non-worksite) market.

Sales and Market Share
Table 1 shows historical WS sales for all insurers reporting sales. The WS market increased in 2019 relative to 2018 but did not reach the level of sales experienced in 2016-2017. As noted earlier, the three carriers specializing in voluntary sales all had increases between 62-76 percent in 2019.

Lower sales in 2018 appears to be mostly attributable to a significant player temporarily leaving the market that year. Its competitors did not seem to get additional 2018 sales in that carrier’s absence, but their sales grew significantly in 2019. As voluntary worksite cases have a meaningful gestation period and are often enrolled late in the year with effective dates early in the next year, there may be a lag before competitors can fill in after an insurer drops out.

Table 1 also shows the overall average worksite premium compared to the average worksite premium for the participants who contributed statistical data beyond sales. As shown in the table, worksite statistics likely represented the broad worksite market well through 2016. However, beginning in 2017, our worksite distributions reflected sales that were not representative of the whole worksite market.

Table 2 shows the above WS sales as a percentage of total LTCI sales. For the most part, this percentage has stayed relatively level in the past four years and much higher than prior to 2016.

As shown in Table 3, three insurers wrote 60 percent or more of their 2019 new premium in the worksite, while the other insurers wrote ten percent or less of their business in that market. The percentage of each insurer’s new premium that comes from WS sales did not change dramatically from 2018 to 2019.

Average Premium Per Buyer
Table 4 shows that, in 2019, the NWS average premium per buying unit (a couple comprise a single buying unit) was 41.1 percent higher than the average premium per insured. This dropped to 31.5 percent in the worksite, because more buyers in the worksite are single and because spouses are less likely to buy in the worksite. These numbers reflect all participants, but the ratio of buying unit to insured unit is determined solely by the participants who are able to report sales based on marital status. The worksite ratio is probably somewhat overstated because the participants who reported premium by marital status for the worksite were not characteristic of the entire market.

Issue Age
The balance of the statistical presentations is non-representative of the entire worksite market. We report the results we have available, though we urge you to be selective in how you use the data. Not surprising, Table 5 shows the WS market is much more weighted to the younger ages, even with data that is disproportionately weighted to executive carve-out programs. However that data bias seems to have reduced the difference between average age inside and outside the WS market.

Table 7 displays the relative age distribution of the population compared to purchasers in the NWS and WS markets.

Rating Classification
Most WS sales are in the “best” underwriting class (see Table 8) because there generally is only one underwriting class. Insurers often do not get enough information in WS to determine whether a “preferred health” discount could be granted and use the additional revenue (from not having a “preferred health” discount) to fund extra cost resulting from health concessions. Carve-out programs are more likely to offer a “preferred” discount, which means a higher percentage of carve-out policies are issued in the second-best underwriting class.

Benefit Period
Originally, the WS average benefit period was lower than the individual market average benefit period. The relative benefit periods have come closer together over time because the average benefit period in the NWS market has dropped. The executive carve-out portion of the WS market seems to have dropped to a lesser degree. This year, many short benefit period WS sales are not reflected, resulting in the WS average benefit period being essentially identical to the NWS market. Table 10 shows similar results in the 2013-2016 era. As noted elsewhere, this data can jump around based on which insurers provide such detail and also based upon whether some large core/buy-up cases are written in a particular year.

As discussed later, the WS market issues much less Shared Care, so the NWS market is still generally buying longer coverage.

Maximum Monthly Benefit
Even with a lot of executive carve-out business, Table 11 shows that the WS market has significantly more coverages that are less than $100/day (and also less than $3000/month). Many core programs are sold with a $50/day or $1500/month initial maximum benefit.
Table 12 shows that the WS initial monthly maximum has varied more over time than the whole market, because of participant changes and how many core/buy-up plans were sold in a particular year.

Benefit Increase Features
As shown in Table 13, the WS market has more future purchase options (FPO), because of its core programs.

Future Protection
Based on a $23/hour cost for non-professional personal care at home ($23 is the median cost according to Genworth’s 2019 study), the average WS initial maximum daily benefit of $156.47 would cover 6.8 hours of care per day at issue, whereas the typical NWS initial daily maximum of $162.94 would cover 7.1 hours of care per day, as shown in Table 14.

The number of future home care hours that could be covered depends upon when care is needed (we have assumed age 80), the home care cost inflation rate between now (age 45 for WS and 58 for NWS) and age 80 (we have calculated with two, three, four, five and six percent inflation), and the benefit increases provided by the LTCI coverage between now and age 80.

Table 14 shows calculations for 3 different assumptions relative to benefit increase features:

  • The first line presumes that no benefit increases occur (either sold without any benefit increase feature or no FPOs were exercised).
  • The second line reflects the average benefit increase design using the methodology reported in the July article, except it assumes that 40 percent of FPOs are elected (intended to be indicative of “positive” election FPOs, in which the increase occurs only if the client elects it) and provide five percent compounding.
  • The third line is like the second line except it assumes 90 percent of FPOs are elected (intended to be indicative of “negative” election FPOs, in which the increase occurs unless the client rejects it).

Table 14 indicates that:

  1. Without benefit increases, purchasing power deteriorates significantly, particularly for the worksite purchaser because there are more years of future inflation for a younger buyer.
  2. The “composite” (average) benefit increase design assuming that 40 percent of FPO offers are exercised preserves purchasing power better than when no increase are assumed, but still generally leads to significant loss of purchasing power. The exceptions: both WS and NWS clients gain a bit of purchasing power if the inflation rate is only two percent (the composite with a 40 percent FPO election rate is equivalent to a bit more than two percent compounding). With three percent inflation, the loss in purchasing power is a bit less than ten percent.
  3. With 90 percent FPO election rates, insured people retain more purchasing power compared to no increases or 40 percent election rates. The average WS buyer would experience increased purchasing power if inflation averages less than 3.9 percent, but would lose purchasing power if inflation exceeds 3.9 percent. The average NWS buyer would experience increased purchasing power if inflation average less than 3.25 percent but would lose purchasing power if inflation exceeds 3.25 percent.

Table 14 underscores the importance of considering future purchasing power when buying LTCI. Please note:

a) The average WS buyer was 13 years younger, hence has 16 more years of inflation and benefit increases in the table. The effective inflation rate to age 80 is not likely to be the same for 45-year-olds versus 58-year-olds purchasing today.

b) WS sales have less automatic compounding and more FPOs, so WS results are more sensitive to FPO election rates.

c) Results vary significantly based on an insured’s issue age, initial maximum daily benefit, and benefit increase feature, as well as the inflation rate and the age at which the need for care occurs.

d) By the median age of starting to need care (about age 83) and the median age of needing care (about age 85), more purchasing power would be lost.

e) Table 14 does not reflect the cost of professional home care or a facility. According to the aforementioned 2019 Genworth study, the average nursing home private room cost is $280/day, which is currently comparable to 12.2 hours of non-professional home care. However, the inflation rate for facility costs is likely to differ from the inflation rate for home care. From 2004-2019, Genworth’s studies showed the following compound growth rates: Private room in a nursing home (3.1 percent), an ALF (3.6 percent), home health aide (1.7 percent), and home care homemaker (2.1 percent).

f) Table 14 could be distorted by simplifications in our calculations. For example, we assumed that the FPO election rate does not vary by age, size of policy or market and that everyone buys a home care benefit equal to the average facility benefit.

Partnership Program Background
When someone applies to Medicaid for long term care services, most states with Partnership programs disregard assets up to the amount of benefits received from a Partnership-qualified policy (some Indiana and New York policies disregard all assets). Partnership sales were reported in 43 jurisdictions in 2019, all but California (no participants offer California Partnership policies) and Alaska, District of Columbia, Hawaii, Massachusetts, Mississippi, Utah, and Vermont, where Partnership programs do not exist. Massachusetts has a somewhat similar program (MassHealth).

To qualify for a state Partnership program, a policy must have a sufficiently robust benefit increase feature, the requirement varying by issue age and jurisdiction. Historically, a level premium with permanent annual three percent or higher compound increases or an otherwise similar consumer price index (CPI) increase was required for ages 60 or less. For ages 61 to 75, five percent simple increases also qualified, and for ages 76 or older, policies qualified without regard to the benefit increase feature. As noted, many states now confer Partnership status with compounding as low as one percent. Two insurers offer one percent compounding in worksite products.

The WS venue provides an efficient opportunity to serve less-affluent employees and relatives who would most benefit from Partnership qualification. However, only 30.5 percent of WS sales in 2019 qualified for Partnership programs and most of those policies were probably executive carve-out programs. If additional states permit one percent compounding and if insurers design products to offer one percent compounding, the percentage of Partnership policies sold in the WS market is likely to grow.

Jurisdictional Distribution
On the Broker World website, you can find a chart of the market share of each US jurisdiction relative to the total, WS and NWS markets, split by Partnership combined with non-Partnership policies and separately solely Partnership policies. This chart indicates where relative opportunity may exist to grow LTCI sales.

Elimination Period
About 90 percent of the NWS market buys 90-day elimination periods (EPs). For that reason, most WS programs offer only a 90-day EP. The WS 90-day EP percentage of 89.7 percent shown below is understated because we lacked data for some participants which are almost entirely 90-day EP.

Table 15 also shows how many policies had a 0-day home care feature and a longer facility EP and how many policies had a calendar-day EP (as opposed to a service-day EP). We have reflected that all LifeSecure policies are 90-day EP with a calendar-day definition and that all Transamerica sales have zero-day home care EP. Policies which have zero-day home care EP, but define their EP as a service-day EP operate almost identically to a calendar-day EP.
The significant differences in zero-day home care EP and in calendar-day EP by market are reflective of specific insurers’ design preference; they do not appear to be driven by the market.

Gender Distribution and Sales to Couples and Relatives
In 2013, insurers started to use sex-distinct pricing, but, as explained, that change has not extended to the worksite market.

The 2012 NWS percentage of female sales in Table 16 reflects a relatively high percentage of female sales in 2012 due to recognition that sex-distinct pricing would occur in 2013. The 2013-2015 percentages of females in the NWS market remained high as insurers which still offered unisex pricing attracted single females.

In the past four years, the percentage of female buyers in the NWS has been stable, fluctuating from 54.3 to 54.9 percent.

Until 2019, the percentage of WS buyers who are female had increased since insurers started using sex-distinct pricing in the NWS market. Perhaps the biggest reason is that women are more interested in LTCI, perhaps especially so in the worksite market because of the WS unisex pricing. Furthermore, the percentage of workers who are female was probably increasing as was the percentage of females among executives (hence included in executive carve-out programs). We noted last year that women constituted 51.2 percent of the U.S.A age 20-79 population in 2018,* but only 46.8 percent of the workers,* which underscores the significance of a higher female percentage of sales in the worksite.

In 2019, the percentage of female sales in the worksite dropped to 51.7 percent from 57.7 percent in 2018. Of this 6.0 percent arithmetic drop, only 0.6 percent was attributable to different insurers providing data in 2019 compared to 2018. The bulk of the difference is attributable to a drop in female sales for a major insurer. *Bureau of Labor Statistics, https://www.bls.gov/cps/demographics.htm

Table 17 digs deeper, exploring the differences between the WS and NWS markets in single female, couples and Shared Care sales. It shows that the decrease in female sales at the worksite was primarily among single people.

Couples who both buy are less likely to purchase Shared Care in the WS market than in the NWS market, because Shared Care is less commonly offered in the WS market and because executive carve-out programs often do not include Shared Care. The bottom row of Table 17 adjusts for insurers not offering Shared Care in the WS market, but does not adjust for advisors and employers choosing not to offer it or not to pay for it. (Married executives generally benefit more from executive carve-out LTCI programs than do single executives, because the employer typically pays for the spouse. Employers may shy away from paying for Shared Care because it would favor married executives even more.)

Type of Home Care Coverage
Table 18 summarizes sales by type of home care coverage. Historically, the WS market sold few policies with a home care maximum equal to the facility maximum. But with increasing emphasis on home care and simplicity, that difference faded. The increase in the percentage of WS policies with a maximum home care benefit equal to the nursing home maximum (81.7 percent in 2018 vs. 93.9 percent in 2019) is attributable to a change in participants. Table 18 also shows that monthly determination dominates the NWS market, but daily determination still dominates the WS market, albeit less so in the executive carve-out market.

Many worksite products embed a “partial cash alternative” feature (which allow claimants, in lieu of any other benefit that month, to use approximately one-third of their benefit for whatever purpose they wish, with the balance extending the benefit period) or a small informal care benefit.

Other Features
Table 19 suggests that Return of Premium (ROP) became more common in the WS market and that a lot more of the WS ROP coverages were permanent; however, if the data is limited to participants that provided data each year, the frequency of ROP would have been unchanged and the percentage that were permanent would have actually decreased. ROP was less common in the NWS market in 2019 than in 2018. ROP with expiring death benefits can provide an inexpensive way to encourage more young people to buy LTCI but may not provide a meaningful benefit.

Table 20 shows little change in the sales of Joint Waiver of Premium and Survivorship to couples, but that Restoration of Benefits (ROB) appears to have been sold more often in the WS in 2019. The increase in WS ROB sales is more than explained by a change in participants. All WS sales are tax-qualified.

CLOSING
We thank insurance company staff for submitting the data and responding to questions promptly. We also thank Nicole Gaspar, Alex Geanous and Anders Hendrickson of Milliman for managing the data expertly.

We reviewed data for reasonableness. Nonetheless, we cannot assure that all data is accurate.

If you have suggestions for improving this survey, please contact one of the authors.

Climbing Mount Long Term Care

During this period of prolonged sheltering in place, I’ve been spending more time than I would care to admit looking at various social media postings. Recently I took an online assessment that was designed to tell me about my style of working: I thrive when I’m challenged; I am a diligent planner; I enjoy being part of a team; and I’m goal oriented. Because I’m athletic and love being outdoors, I started searching for sports that shared some of these same characteristics. Not surprisingly, mountain climbing came up over and over again. “Googling” mountain climbing, I came across the following statement: For most climbers, the pleasures of mountaineering lie not only in the “conquest” of a peak but also in the physical and spiritual satisfactions brought about through intense personal effort, ever-increasing proficiency, and contact with natural grandeur. Sounds fantastic! I’m all in! Except there’s only one problem. I don’t like heights. Nevertheless, my reading about mountain climbing gave me an entirely new appreciation for the sport and in what might be considered a strange parallel, how similar mountain climbing is to long term care planning.

When you ask most people about mountain climbing and the preparation that’s needed, they will think about the training and equipment that’s needed to climb the mountain and reach its peak. Ropes, crampons, harnesses, helmets, shoes, carabiners, and packs are just a few of the specialized pieces of equipment needed. You will also need a map and maybe a guide (probably not a Sherpa, but it sounds cool). You will need to factor in weather conditions, altitude, and other potential hazards. Depending on the climb, you will also need to be in decent physical shape. With all these tools in place, you can now climb the mountain. After great effort, you reach the apex, take a few moments to celebrate and recognize what you’ve accomplished, maybe catch your breath, and then…you have to get down. As the saying goes, “What goes up, must come down.”

Mountain climbing isn’t just about going up. It’s about going up, reaching the top, and then safely getting back down where you can once again celebrate and appreciate the complete and total journey. On the way down, you need stamina, endurance, and the same focus you used to get to the top. You need to avoid exhaustion, falling, losing your way, or getting distracted. The same can be said for preparing for retirement.

Like mountain climbing, retirement preparation is a complete journey. Too often we are focused on the uphill climb or the accumulation phase. In the initial stage of preparation, we begin saving. Just like the tools used by a mountain climber, we use asset accumulation vehicles such as 401ks, IRAs, annuities, and mutual funds. Like a map or guide, we work with investment strategies and professionals. We also factor in potential hazards, including changes in the market, interest rates and risk tolerances. If all goes as planned, we reach the peak of our financial goal and wave the flag of retirement. Once that’s done, we need to get back down the other side of the mountain safely. In our retirement years, that’s called distribution. Yep, it’s time to use what we’ve accumulated, or a portion of those assets, to live out our retirement—hopefully on our terms.

One of the factors that can impact retirement, or the downhill descent, is an extended health event or long term care. In fact, for those over the age of 65, there’s an almost 70 percent chance that they will experience an extended period of long term care. While myriad options are available today, asset-based long term care (LTC) is dramatically outpacing all other solutions.

The concept behind asset-based LTC is to reposition or leverage an existing asset that is no longer serving its original purpose and to fund whole life insurance or annuity contracts to provide clients with options on how to fund their LTC protection, often with tax advantages. As an example, an “old” life insurance policy that has built up cash value could be repositioned to provide coverage for a qualifying LTC care event, as well as provide a death benefit if care isn’t needed. Additionally, by adding a return of premium option, the policyholder can always have access to their funds. This can create a LTC protection that is accessible, flexible, and dependable. It also eliminates the concern and question of, “What if I never need LTC?” In other words, what we saved during our accumulation phase can now be repositioned for greater leverage in our distribution phase. The tools we used to get up the mountain can now be used in a different and more efficient way to protect us as we climb down the mountain.
In addition to accessibility, flexibility, and dependability, LTC care plans should also, and perhaps most importantly, provide certainty. When it comes time to file a claim, you want to know with certainty that the plan in place will cover the entire LTC event. While many producers design an LTC plan that covers the “average length of stay,” that addresses only the average care need and excludes the possibility of a lifelong diagnosis like Alzheimer’s or Parkinson’s. Lifetime protection is one of the only ways to ensure that every client has exactly the amount of protection that they need, whether it’s for two months, two years, 20 years or longer.

One thing is for sure, without proper planning and without some type of protection, many individuals will pay for care out of their pocket. In mountain climbing, you would never plan to get to the top without equally planning how you will get down the other side. Similarly, you should plan how the assets you’ve accumulated could be impacted during distribution by an LTC care event. By reallocating a small amount of funds today, pennies can protect assets from a future LTC event. With a plan that offers lifetime coverage, you can also create certainty.
Whether you are climbing a mountain or preparing for a potential LTC event, we would all agree that certainty of a safe trip down the mountain in retirement is well worth the planning.
All factors should be weighed before replacing an existing life insurance or annuity.

The Fixed Annuity Market, Analyzed

It is hard to believe how very dramatically things have changed in our world in just a short three months. At this time in February I was doing a keynote for a group of insurance company executives who focus their sales primarily on annuity products. We had some good food, did some networking, and exchanged collective angst about the challenges of marketing “attractive” annuities. It was a mostly uneventful trip until the last day, when businesses began closing and flights began cancelling because of something called Novel Coronavirus, or COVID-19.

That was my last memory of things being “normal.”
Since that day I haven’t been able to color my hair, I am in desperate need of a pedicure, and my latest tattoo remains incomplete. I am unnaturally excited to have exchanges with the people in the drive-thru at my bank and I am suddenly quick to volunteer to run and get a loaf of bread (At last! A chance to escape!). This is definitely one for the history books.

But COVID-19 has affected the insurance business in a way that will go down in history as well. Insurance companies are suspending products, reducing rates, and de-risking their attractive product features. Premium bonuses have plummeted, rider payouts have dropped, and some have even reduced commissions. This virus has forced insurance companies to conduct business virtually, offering their salespeople the opportunity to meet with clients via computer or tablet. Applications are being submitted electronically, which is something insurance companies have talked about doing for two decades. I read recently that this virtual way of conducting business results in salespeople meeting with 30 percent more prospects daily, so it isn’t all bad.

Regulation
On the regulatory front, the biggest news may be “Best Interest Regulation.” While the Department of Labor’s attempt at a fiduciary rule was thwarted, the Securities and Exchange Commission plans to roll-out “Reg BI” in June. For those salespeople saying, “It doesn’t concern me, as I’m not securities licensed,” individual states such as Massachusetts, Nevada, and New York have all issued their own best interest regs. My home state, Iowa, just became the most recent state to adopt the most recent iteration of the National Association of Insurance Commissioners’ Suitability in Annuity Transactions model regulation, which is built upon a best interest framework. In short, it’s coming.

In other regulatory news, many are cheering the passing of the SECURE Act. This legislation gives annuities within 401(k)s a green light by easing the fiduciary burdens associated with choosing plan providers selecting an annuity provider. (Note there were many groans too, as SECURE also marks the end to stretching an IRA over one’s life expectancy for most.) Those excited for the impending boon to annuity sales should temper their bliss; there is a ton of administration that insurance companies need to establish before this law will translate to a marked increase in annuity sales. Compounding the matter is the fact that insurers need to find a way to get in front of plan sponsors. Yet something everyone in the annuity business can appreciate is that this legislation has resulted in a slew of positive press for annuities.

And to close-out regulatory matters, indexed annuity product manufacturers are still hanging in the air, waiting to hear if they will be able to illustrate indexes that are less than ten years old. More on that later, as we discuss “hybrid indices.” However, note that this does not affect products, just the illustrations of select indices.

Product Development
Product development has been negatively impacted by COVID-19 in an inconceivable manner. When the market crashed, it had a chilling effect on fixed money instruments. Interest rates on “safe money” were already challenging, but today national averages are stunning:

  • Banks
    • Savings accounts: 0.10 percent.
    • Checking accounts: 0.08 percent.
    • Certificates of Deposit (CDs): 1.40 percent.
  • US Treasury
    • Series EE Bonds: 0.10 percent.
    • Series I Bonds: 0.20 percent with an inflation component of 1.01 percent (semiannually).
  • Insurance Companies
    • Fixed annuities: 1.77 percent.
    • Indexed annuities’ annual point-to-point caps: 3.37 percent.

Historically, we have witnessed how low interest rates negatively impact fixed annuity sales. This typically results in positive impact on sales of variable annuities. Yet, market volatility has conversely led to increased fixed annuity sales. This is why most variable annuity (VA) companies have both a VA offering and a fixed; this allows the assets to switch from one side of the house to the other during shifting market conditions.

That said, many insurance companies have developed indexed annuities over the past 25 years because, what happens when there are low interest rates market volatility? Rather than those assets shifting from one side of the house to the other, they fly out the door to companies with an indexed annuity offering.

Of interest is how we have seen a direct inverse relationship between how low CD rates are and how high indexed annuity sales are. Likewise, when market volatility is generally high, it results in a corresponding positive effect on indexed annuity sales. So, ultimately, all indicators suggest that indexed annuities will benefit from the current market environment.

To fully appreciate the challenges associated with pricing fixed annuities today, there are a few basic premises of pricing that you must understand. First, when it comes to annuity pricing, there are only 100 pennies in a dollar; it is all a matter of where you allocate your pennies. And there are three parties that must benefit from the annuity:

  1. The purchaser: Through a fair credited rate, or cap/participation rate/spread rate;
  2. The salesperson/distributor: Via a fair commission; and,
  3. The insurance company: Through their spread/profit.

I like to imagine a three-legged stool when it comes to this point. If a product has a relatively attractive commission, either the purchaser’s leg of the stool, or the insurance company’s leg of the stool must be shortened. Hot tip: The insurance company is always going to get their “pennies,” or the annuity won’t be available for sale.

When it comes to fixed annuities, it is helpful to understand another basic principle of annuity pricing. When a purchaser deposits $100,000 into a 10-year fixed annuity, the insurance company turns around and purchases 10-year bonds. Let’s assume the bonds are crediting the insurance company with 4.00 percent interest. The insurance company will credit less than this amount to the fixed annuity purchaser, and the difference is then used to pay expenses, distributor/agent commissions, and earn a profit/spread.

Given all of this, and to help put things into perspective, the 10-year treasury bond is not at 4.00 percent; it isn’t even at 1.00 percent. (Yahoo! Finance has some great historical graphs to show how this has plummeted). So, to say that insurance companies are trying to make lemonade out of lemons is a gross understatement.

To aid in your understanding of indexed annuity pricing, the basic principle of pricing fixed annuities, above, is slightly modified. Instead of placing 100 percent of the purchaser’s annuity payment into bonds, the insurance company only puts 97 percent of the amount into bonds. The remaining three percent is used to purchase options, which provide the indexed-linked interest. Here, I remind you that the 3.00 percent of the annuity purchaser’s premium is only able to purchase options that afford an average 3.37 percent annual point-to-point cap today. This leads me to our discussion of the biggest trend in the indexed annuity market.

Market Trends
We know that the excess interest credited to indexed annuities hinges on three things: The rates (caps/pars/spreads), the indexing method (annual point-to-point, monthly averaging, etc.), and the index. Let’s talk about that last item, specifically, as it has changed dramatically in the past eight years. When I started my market research firm 15 years ago, there were six indices upon which you could base indexed interest on these annuities: The DJIA, NASDAQ-100, Russell 2000, S&P 400, the S&P 500, and a now-defunct bond index.

Today, there are an astounding 116 different indices upon which to earn indexed interest on indexed annuities.

Enter the hybrid index. Hybrid indices are those that consist of one or more indices, and usually have a cash or bond component as well. Some hybrid indices are volatility controlled. Some are proprietary, so that they are marketed exclusively by a single company. Typically, the hybrid index is developed around the same date that the annuity is conceived (where, by contrast, the newest index prior to the emergence of these indices was more than 20 years old). These indices are almost universally controlled via a participation rate or spread, so as to give the ability to market that they offer “uncapped” potential to the annuity purchaser. They are usually illustrated favorably. Their “sexiness” is derived from the impression that they have an “unlimited potential for gains.”

By the way…not true.

Anyhow, why the boom in indices? In short, historically low rates. The indexed annuity product manufacturers seem to innovate best under pressure. Never underestimate how creative an insurance company can be until you put them in periods of pricing duress. The first time pricing indexed annuities became challenging, after their initial introduction, companies began using spreads instead of caps to limit indexed interest. The next period of unattractive rates gave birth to new crediting methods. So, instead of just offering point-to-point calculations, we began to see monthly and daily averaging methods. Now that financial institutions have embraced the products, “innovating” through indexing methods is no longer possible; these firms are strict on which indexing methods they allow. And so, new hybrid indices are how insurance companies are “innovating” to find a way to market something that would otherwise look relatively unpalatable.

And because everyone is focusing on the fantastic potential for gains, not many are talking about guaranteed income that cannot be outlived. Guaranteed Lifetime Withdrawal Benefit (GLWB) elections have fallen to an all-time low of 35.2 percent. Still, those companies telling the “income story” have started innovating in their own manner. Guaranteed roll ups have largely gone by the wayside, and have been replaced by GLWBs that use indexed gains for the Benefit Base value, offer stacking features, or boast “increasing income.” The Long Term Care (LTC)-kicker feature is still popular, offering purchasers twice the amount of income than typical if they qualify by needing assistance with two out of six Activities of Daily Living (ADLs).

The historical low rates have also resulted in restricted liquidity for all annuities. Gone are the days when 10 percent penalty-free withdrawals came standard! Most fixed and indexed annuities today offer five percent penalty-frees, and some even go so far as to offer seven percent (gasp!).

Sales
Coronavirus may be stinging us all, but it has had an interesting effect on sales. Specifically, indexed annuity sales are down 4.3 percent from last quarter and 7.4 percent from this time last year. Surprisingly, fixed annuity sales are up. One-year fixed rate annuity sales are up 0.5 percent over last quarter, but still down 27.1 percent from the same period a year prior. Similarly, multi-year guaranteed rate annuity sales are up 9.1 percent from last quarter, but down 32.5 percent from this time last year.

The good news in all of this is that sales will hit record levels once everything levels-out, the 10-year treasury rebounds, and everything returns to “normal.” Those familiar with annuities have a history of purchasing fixed products when they experience the losses of the market. And as people increasingly hear the word “annuity,” realizing that these products can address their top fear of running out of money in retirement, it sets the stage for a boon in your business. Until then, the annuity industry will do what it always does—adjust and keep providing the guaranteed lifetime income that Americans so desperately need.

Next Generation Leaders

Adapting To Change In Product, Service And Tech

Q.How have your initiatives as a next generation leader been of benefit to your producers? What challenges have you faced in implementing them?

Chad Milner
Our focus for the past 10 years has been to add value in ways that help cause the insurance transaction to happen. Several of those initiatives have been to strengthen our underwriting process, create a first-class lead generation process, and to constantly bring new sales ideas to our partner producers.

Challenges? It takes a lot of trial and error as well as increased capital to create a first-class lead gen process. There are many regulatory issues involved in marketing directly to clients—that has been challenging at times. Historically, The Milner Group has a great reputation for underwriting. We have simply added to our existing platform to increase our success with large case underwriting. As with a lot of older businesses that are “stuck in their ways,” there have definitely been some roadblocks and some turnover within our staff that has been hard to overcome. In some situations, we have had to replace certain staff members with new staff that is open to our new culture of growth.

A.C. Jetter
Technology, for both our staff and the producers we work with. We’ve implemented multiple technologies that allow our staff to quote, underwrite, or process business so coverage is in place as quickly and efficiently as possible. We also provide a wealth of tools for the producers we work with to be able to quote and submit business easily.

Cost is often a factor, but adoption and usage are consistently a challenge.

Q.How has your “fresh perspective” helped you forge new relationships with younger producers?

Chad Milner
Producers feel as though we are partnering with them, and both of us have skin in the game. By going a step further in generating leads for the final expense producer, as well as working closer with the clients of the traditional producer, these agents understand that we are truly listening to their needs in today’s marketplace.

A.C. Jetter
There are young producers??

Q.What does your agency do to help agents looking to retire? What have you done to ensure their clients are continuing to be served?

Chad Milner
This is a project that is still in process and has not been fully implemented. Our goal is to connect younger successful advisors with our retiring advisors. We do have the resources internally to help what we refer to as “orphan clients” and have done this for decades, but we are working on a more formal process as this topic is very relevant to our agency.

A.C. Jetter
We typically try to match up a retiring producer with another agent in their market and location. Art Jetter & Company works with a large number of agents and agencies in all 50 states, so we’re often able to put them in contact with a quality producer who will take good care of their clients.

Q.What in your agency is appreciated as still “Time Honored” and what has been embraced by agents as “New and Improved?”

Chad Milner
Our core values have not changed through the decades, and we believe these have kept us honest (and in business): Integrity, Accountability, Urgency, and Accessibility. While the industry’s practical needs may adjust, operating with integrity and showing our customer’s a sense of urgency will always be pertinent. We can offer new technologies, additional phone support, provide leads and sales tools, but if we don’t have a moral compass and aren’t tapped into to our customer base—it’s all for naught. Our producers indicate that while they do appreciate any new offerings we’ve put together (high end customer service support, drop ticket fulfillment, lead generation, etc.), they are willing to try it because of our reputation over the years. New ideas are built on the expertise we’ve maintained in the industry, and if it weren’t for the generations before us—we might not have the platform to try new concepts today.

A.C. Jetter
We’re still family owned and hold true to our values that were put in place more than 40 years ago. The producers and carriers we work with, as well as our staff, value our honesty, integrity, and knowledge.

We have always provided all lines of insurance and have specialists in each market.

This seems to be working well, as we’re having record growth in both revenue and staff, and just purchased a new building to double our size.

We’re always searching for new tools and technology to help the producers we work with be successful and provide the best service to their clients.

DI Forum—September 2019

A Panel Of DI Experts Looks At The Disability Income Market And What Can Be Done To Increase Agent Involvement In DI Protection Solutions

Q.What are your assessments of the individual, group, business, and excess disability markets today?

Cohen
There are very few companies that write disability income protection. And there are very few advisors who offer it.

So, if there are very few advisors who offer it and the product is needed by many people, it’s a great way to grow your book of business. Wouldn’t you agree?

The products in the individual market are so versatile. They cover so many different needs. And as I always say, “Need motivates action.” There are business disability products to fund a buy/sell agreement. There are disability products to fund business loans—if an individual is disabled and can’t pay a particular loan. There are key employee policies to help an individual cover the needs of the business when an employee is disabled.

And the limits of individual coverage that the individual companies are writing today are high. When I started in the business the amount of coverage I could offer a client was much more limited. The limits were low. The underwriting was very strict. And the products were not as creative as they are today. Yes, my assessment of the individual disability market today is that it is exciting.

Group disability coverage (also known as Group LTD) for many individuals is important. It’s great when a company can offer group coverage. Group LTD insurance is good for people who don’t have disability insurance. It’s better than nothing. It’s better to have something than to not have a policy.

But I want you to understand that group LTD coverage can be limited for individuals who are making a high income. We can run into something we call “reverse discrimination.” These higher income earners are discriminated against because a small portion of their income is covered with that group LTD policy.

Let’s take a typical group LTD policy…it insures a percentage of a person’s income, let’s say 60 percent, up to a limit of say $10,000 per month. Let’s take an individual making $300,000 a year. That person can have a particular problem. They earn $25,000 per month. But the individual is only getting $10,000 per month in benefits with their group LTD plan. With the group LTD plan alone, this person is insuring 40 percent of their income. Well, they need more coverage. So, let’s take an individual disability insurance policy and layer it on top of that group LTD coverage.

And let’s have that person self-pay their individual disability policy premiums so their benefits may be tax free. (Just a reminder, when the employer pays a group LTD policyholder’s premium, the benefits may be taxed.)

There are often other limitations with group LTD coverage. Many of the group LTD policies are only covering mental and nervous disorders for a limited amount of time. For example, some of the group LTD policies only cover mental and nervous disorders for two years unless you’re in a hospital.

Also, some group LTD plans may not cover bonuses and excess income an individual may receive. And the definitions of a “disability” in group LTD policies may not be as comprehensive as the definitions in individual policies. Also, many group LTD policies may not be portable if you leave your job.

Both group LTD products and individual disability insurance products are important in protecting income. When a client tells an advisor, “Oh I don’t need individual disability insurance, I have group LTD coverage,” remember that this is not necessarily an objection. If the client has group LTD coverage, this person likely understands the need. And that is often the perfect start to a conversation regarding the need for individual disability insurance as well!

Phillips
Without looking at any statistics from LIMRA, or other authority, and only from my little corner of the world, my view is that the group LTD market is recognized and stable. The individual, business and excess markets are not overly recognized and are underpenetrated.

Group LTD (and short term DI, STD) is a product that is widely sold in the group benefits realm. It’s an offering that many employers recognize as an offering to their employees to enhance their competitive stance via an overall benefit package (I’m not sure that many understand the underlying definitions very often however!). While many employees may not know exactly what it is, they know they have “DI at work.”

Other DI offerings seem ignored by consumers and employers. Sadly, we’ve run into many, many instances where company group reps themselves don’t know about, or don’t seem to care about, their own carrier’s non-group offerings. So much for a synergistic, strategic relationship with a company rep in this arena!

However, that lack of recognition begets tremendous opportunities for planners, advisors and agents to enhance their practices and prospect for new clients. The disability income market is staid, and historic…and yet still offers, effectively, a ground floor opportunity. Especially in the lesser penetrated industries and markets. Doctors, dentists, even attorneys, to a great extent recognize and embrace the consideration of income protection relatively speaking. Think of all the other industries out there!

Schmitz
Underpenetrated due to lack of communication, marketing, and incentive.

Petersen
The specialty and high-limit DI market is strong, but we have seen a relative plateau in IDI business and a greater focus of DI advisors on the burgeoning GSI sector of group DI, especially among physician groups and law firms. Employers get tired of wrestling with medical insurance and see disability plans as great group benefits.

The business disability markets continue to be strong as there is always a business deal taking place.

Bloch
The individual disability income marketplace remains on a steady path. There is a fantastic opportunity, however, for carriers to re-energize the marketplace with exciting and creative solutions. The challenge is to create a product and premium structure that the consumer will understand and want to purchase. The group LTD marketplace is becoming more of a commodity product with a “race to zero” mentality. There is limited interest in provision quality today perhaps due the medical care cost issue that has become so time consuming and expensive. The excess disability markets are exploding with new ideas, coverages, and new premium. Product creativity and underwriting enhancements have provided unique solutions for the business and high-income markets.

Q.What needs to change to get producers who shy away from selling DI to embrace these markets?

Cohen
I believe the saying, “Knowledge is power.” The problem that we have in the industry is that we are often dealing with advisors who haven’t specialized in disability income protection. They don’t know a lot about it, so therefore they shy away from it.

Most folks will shy away from something to sell if they don’t understand it. He or she doesn’t want to present it because they won’t be able to handle the questions the clients would ask.

Many advisors have worked very hard to earn their clients’ confidence. Often advisors don’t want to jeopardize that confidence by offering a product that the advisor knows nothing about.

So, my suggestion is that we have to educate the advisors. First of all they have to understand the need for disability income protection. It’s very simple. Many times advisors just want to insure the golden eggs. We have to insure the goose that lays those golden eggs.

The insured’s greatest asset, many times, is their ability to earn an income. If you take an individual who is 35 years old, who’s earning $100,000 per year through age 65, that future income is worth $3,000,000. That’s if he or she doesn’t have any raises, bonuses, or any additional compensation. So that could be their most valuable asset. All of the insured’s hopes and dreams are based on that asset—future income.

Why doesn’t an advisor talk about business overhead expense for a small business or a small professional person? The advisor may not even know it’s available. So, naturally, they’re not going to bring it up.

How about an individual who funds a buy/sell agreement for life insurance and their advisor never brings up the fact that there is a policy for disability that will help fund that buy/sell agreement if one of the owners has a serious disability and can’t work for a long period of time?

So, this is our job. Our job as a brokerage agency is to educate and to help the advisor. I hear many times an advisor say to me, “This client got a million dollars of life insurance, best class. But they’re putting a rider on my client’s disability policy that’s excluding coverage on his back. And my client says he’s only been going to the chiropractor for preventive adjustments.”

Well there are two points that need to be made regarding this scenario. First of all, with life insurance, a bad back isn’t generally going to affect an individual’s life expectancy. So, the client may get best class.

But a bad back could affect a client’s ability to work and earn an income. The result—the client could be given best class with his life insurance and a back rider on his disability policy.

The second point I’m going to make is going to delve more closely into the back rider itself. In our example the client said he had only been going to the chiropractor for preventive adjustments. Well, that may be the client’s perception. But with disability insurance underwriting, underwriters are almost always going to ask for an Attending Physician’s Statement (APS) regarding an applicant’s back treatment. And in this example, the APS said the client was receiving more than just preventative adjustments.

Here’s another example of a rider that can come up on an individual disability insurance policy. If an individual is going for counseling, or taking anxiety and/or depression medication, there’s a good chance that the individual will have a rider on their policy excluding mental and nervous disorders.

We have to get the advisor to understand the underwriting of disability insurance. It’s completely different many times than life insurance underwriting. We manage the advisor’s expectations, so they can manage their client’s expectations. We always do our best to prepare the advisor. It goes back to giving the advisor the knowledge he or she needs to feel confident providing their clients with disability income protection insurance.

Phillips
One stumbling block is the processing and underwriting of DI business. There’s nothing worse than preaching, prodding, pulling and cajoling a non-DI oriented planner for months and years on end about the power and the glory of income protection planning only to have them submit their first case and be slogged through the mud and dreck that is the processing and underwriting of DI business. Often it creates a one-and-done dynamic.

In this era of ubiquitous preventative medicine, often cumbersome underwriting isn’t something we experience for those who are unhealthy. Tests, procedures and exams are done that perhaps weren’t even here even just a few years ago. Those need to be reviewed and scrutinized by an underwriter, which can make for a lengthy process.

In addition to laborious underwriting itself, the application process has been primitive. Lengthy paper applications. Uncomfortable tax returns. Something that many planners have gotten “un-used” to in their primary practice’s focus.

The good news is that I think the carriers have recognized this—at least the processing aspect—and electronic applications, e-policy delivery, etc., have begun to work their way into the market. That evolution will not stop.

Likewise, seeing the ever-expanding offerings of “accelerated underwriting” on the life insurance side, it’s only a matter of time before such initiatives bleed over to the disability insurance market. I often say to my staff and our constituents, “We are at the beginning of the end of processing and underwriting as we’ve known it.”

Second, I think carriers and agencies like mine (BGAs, MGAs, whatever you want to call us) need to do a better job of spreading the word of this market and the opportunities herein. We need to bludgeon the market with the message.

I’m a humble member of the DI marketing group, The Plus Group, with some of the greatest DI minds and marketing minds in the nation. Each year we collectively rally around the concept of “DI Day,” usually in May to jive with Disability Income Awareness Month (DIAM). Tens of agencies around the country have meetings solely focusing on the abstract and the concrete aspects of income protection, bringing in motivational speakers, company reps, and even consumers who’ve experienced disability income up close and personal.

We’ve had tremendous success in not limiting our efforts to a day, but invoking a “DI Year” concept. Weekly something is sent, posted or otherwise on DI. It is an endlessly evolving educational process. Ours is the notion, “If we build it, they will—eventually—come,” so to speak.

I think with continued educational offerings from those who are in a position to do so, along with the continued technological enhancements to processing and underwriting, we are on the cusp of new players and producers embracing this important insurance. It should be the bulwark of every financial and insurance plan.

Schmitz
Underwriting. Although Guarantee Standard Issue (GSI) and Simplified Issue programs are helping, we could use a more automated process for gathering health information. (Where is that medical ID-card we heard about years ago?) In the meantime, we can make it easier by streamlining the process. With broker training we can get brokers to ask a few important questions:

  • When were you last hospitalized, and why?
  • What prescription drugs are you currently taking?
  • When did you last see a doctor, and why?
  • What does last year’s tax return or W2 show?

Producers who shy away from selling DI should not be able to call themselves financial advisors. If they do not want to sell DI, they should partner with a DI specialist.

Scalability. Easy and accessible e-applications, or outsourcing the application process, like we have done with DINGO.

Petersen
Greater education of the general public, but more important, greater education of life and health insurance agents. General agents and insurance carriers need to take a greater role and responsibility in educating insurance advisors about the importance of DI and how to better market their programs. This is not a new problem or issue. What many carriers and GAs consider education is frequently product education rather than sales education. Yes you need to know your products, but producers are missing many fundamentals of the sales process.

Bloch
Many producers shy away from discussing disability income because they lack the appropriate training and do not understand the risk or the process. Training is the key. I would recommend that the producer partner with a DI expert to gain disability expertise.

Q.What are some tips for agents to overcome objections to buying income replacement protection?

Cohen
When offering individual disability insurance to a client, there are four basic objections an agent may encounter. No need, no hurry, no confidence, and no money. The agent wants to eliminate objections before they become objections.

First you must uncover the need. How do you do that? You ask questions.

The advisor can ask the client, “How important is your earned income?” About nine out of ten times the client will agree that his or her most important asset is their ability to earn an income.

When the client understands and agrees that their ability to earn an income is their most valuable asset, then it becomes very easy. You must get your client to understand they need the policy even before you start your presentation.

To further point out the “need,” I have the client picture a bridge made up of all of his or her financial obligations—the mortgage or rent, car payments, car insurance, kid’s bills, utilities, health insurance, groceries, cell phone bills, etc. And then I ask them to picture the only thing holding up that bridge is their paycheck. I ask the client, “If the paycheck is gone, what particular problems will you have?”

I may also ask, “If you were out of work because of a sickness or accident for three or four years without a paycheck, without an income, without any earned income, would you have an income problem?” And naturally they will say yes. Then I feel I have overcome the no need objection. I won’t go forward with the presentation unless they understand they need the product.

The next objection is, no hurry. I want to eliminate that. But I know one thing. Need motivates action. If someone needs something, they’re going to act very quickly. Years ago, when I was in my early 20s, my friend asked me to stand up at his wedding. Naturally, I said yes. They said everybody was going to be wearing a tuxedo and that I had to go down and get measured for a tux.

Guess where I was within days? Need motivated action. I was in that tux shop getting fitted in that tuxedo.

If your television goes out and there’s an important ball game you want to watch, what happens? You’re getting that TV fixed or you may even buy a new one immediately. It’s amazing, when we need something, how fast we’re going to act.

Need always motivates action. You have to remember that. If the client knows they need to protect their income, they’re going to be in a hurry to get the policy. The no hurry objection won’t come up.

The third objection is, no confidence. I believe you really have to know your product and you have to be prepared. So, before you go out on that appointment, you’re going to go through that illustration. The illustration is going to help you understand the product.

And you’re not going to prepare by going through the illustration just once or twice. You’re going to know that illustration until you could just shut your eyes and see it. I study the illustration. I practice my presentation. I know where I’m going to go in the appointment. If you know and understand the illustration, you’re going to instill confidence in your client.

So, again, you have the need objection overcome, the client is going to act if they need it—which is going to destroy the no hurry objection, and If you know your material you’re not going to have any problem instilling confidence.

The last objection is, no money. It’s interesting. When someone needs something they’re always going to find the money to purchase it. The no money objection will generally come up toward the end of the presentation.

Imagine, you’ve already gone over all the benefits in your presentation with your client, reading right from the illustration. At this point you will summarize the benefits again very quickly, and say to the individual, “If we were to deduct x amount of dollars from your checking account every month for all of these benefits, would that create a financial problem?”

Now you know what the individual is going to say—either yes or no. If they say no, you’ve overcome the objection and then you proceed to fill out the application. If they say yes, my response has always been, “I don’t want you to buy this policy.” I don’t argue with people. I don’t say, “Buy this…sacrifice to buy the policy.”

The client is going to tell me if they can afford the policy. And if premium is an issue, I say, “I didn’t come here to create a financial problem, I came here to solve one. So, if you leave here very uncomfortable, I haven’t really done a good job. So here’s what I want you to do. I want you to think about this. Let’s presume we started off with half the monthly benefit. So, we would be deducting x amount of dollars, which is approximately half the premium for half of the benefits. Would that work for you?” If money is still an objection, reach out to the client next year.

I believe you overcome objections before you get objections. And that’s the way I’ve been handling them. I don’t get a lot of objections when I present a policy.

Phillips
As best as I can tell, there are three major objections to income replacement coverage and they’ve been there forever. I won’t get disabled. I have it at work. I can’t afford it.

I won’t get disabled. Well, let’s hope the client doesn’t. But according to the Council on Disability Awareness website (bookmark that page people!), a 20 year old has a One in four chance of a disability before they retire. Now maybe it’s not a career ending disability, but even a disability of a few months can blow out savings and impact a lifestyle. Are chances better or worse of your house burning down? Anecdotally, there’s never been a house fire in my neighborhood, but I’ve got two neighbors on my block alone who’ve been out of work for months now, one involved in a serious auto accident, the other ravaged by cancer.

I have it at work. Great!! Now what is it? How much? What does it cover? Sadly, if you pose that question to most clients they won’t know and the conscientious planner should ask for the client’s benefit booklet to make sure they aren’t short—and many higher income earners are. Most often group LTD benefits are taxable upon receipt and have a monthly maximum. Even a robust plan might leave a mid- to high-level earner with a small percentage of normal take-home pay if they get disabled. Tough to maintain a high income lifestyle when disabled as it is, let alone with a small percentage of pre-disability income.

We’ve also worked with a number of advisors whose clients have described, “I have it at work,” only to have reviewed their coverages and find out their work plan is a short-term disability plan. One that’s built for coverage of just a few months.

I can’t afford it. Many times the client can afford proper coverage, they just don’t want to afford it. This is where a holistic planner has a tremendous advantage, most often knowing the incomes and assets of the client inherently. And, even if one isn’t, some probing questions can give general insight into how much the burden of the DI premium will really be.

It’s important to point out, too, what it really protects. I think subliminally we send the wrong message as an industry to proposed insureds. A 40-year-old client sees a $3,000 premium, let’s say, and $5,000 monthly benefit. Well, to pay $3,000 to get $5,000 doesn’t sound like that great of a deal! But if we help that client understand that it’s $3,000 per year for $60,000 per year of DI benefits with a potential in this case for well over $1.5 million of total payout in a worst case scenario aspect (early disability)—that might carry more of an impact.

All that said, all the gurus, commentators and articles I’ve read say that the upward percentage of gross income a client will pay for a disability income policy is two percent. When running into a situation where an optimum DI plan exceeds that two percent number, consider tailor-making a plan that hovers around that mark. Longer elimination period. Shorter benefit period. Sacrificing policy riders. All can be effective ways to assure the client some protection. In the income replacement market, something truly is better than nothing and a plan that’s inforce at any level can soften the damage to a client’s lifestyle because of an extended sickness or accident.

Schmitz
Ask questions. What is your backup plan for partially surviving an accident or illness that would’ve killed you 20 years ago, but with modern medical technology, you can now survive with a disability? Listen. Most people that do not have DI were never asked.

Petersen
Disability insurance is the most important financial safeguard an income earner can possess. If you were to become disabled and lose your income, how would you pay bills, kids’ school tuition, all other insurance premiums, mortgage, car loans, groceries, etc.? Even medical bills can be paid, provided there is a source of cash flow! Medical insurance does nothing for your living expenses.

Bloch
At our last three DI Days, speakers have discussed their disability claims experience. All have been different and range from a serious car accident, Achilles tendon rupture and subsequent infections, to a physician with shoulder issues. The discussions are far reaching and include financial, family, personal and other considerations. Our producers hear first-hand experience to better understand the personal and business struggles when a disability moment strikes. This experience also allows them to be more comfortable talking about income protection coverage and the importance of a monthly check to replace lost income. By discussing these claims stories with potential prospects, they can overcome many objections. Not all claims experiences were handled positively by some carriers. As a result, we created a Claims Concierge Service to help our policyholders with the claims process.

Q.Many agents deal with high net worth individuals—what advice can you offer to increase sales in the individual and high-income markets?

Phillips
High net worth clients can be dicey to deal with from an income planning standpoint. Fundamentally, we can provide jumbo DI benefits via specialty markets. No issues or problems there.

However, high net worth clients might end up “outrunning the coverage of disability income protection” due to the nature of their business. Disability income insurance is built to “protect your paycheck” to coin the old DIAM slogan. Many high net worth individuals derive a high percentage of their income in passive income vehicles—rents, dividends, etc. Those passive vehicles will continue to generate income regardless of the clients’ health and involvement. Too high of a percentage of such income will lead to insurability issues.

One could argue that a critical illness policy could be offered to such individuals to address certain morbidity exposures. Disability income’s cousin, critical illness, offers a lump sum payout due to diagnosis of many dread diseases, heart attack, stroke, etc. It doesn’t have an earned/passive income criteria to get underwritten.

Schmitz
High earners are the market in CA. Focus on business owners and those who earn over $80,000. In CA, SDI pays up to $5,425 per month. It can be difficult to motivate lower earners when they have this government benefit. Fortunately, there are plenty of high earners out there. When they are married and have children they are the most motivated to protect their earned income, which provides for their family and maintains their lifestyle.

Petersen
Stress that those with higher incomes have more to lose and covering 40 or 50 or 60 percent of their income is not going to provide enough capital to cover the usual expenses of their affluent lifestyles. Those with higher incomes are not sufficiently covered by one, or even sometimes two, layers of DI. High-limit, excess DI is critical for high-net-worth clientele. The purpose of insurance is to keep what you have, not try and liquidate assets to pay for living expenses following a disability.

Bloch
The high-income market is the perfect market to discuss cash flow and tax liabilities. Many group LTD plans do not cover total income either because the stated monthly maximum is low or the plan covers salary only. To add insult to injury, many plans are employer paid and hence any benefits received are taxable. In the situation of high-income individuals, we provide a Group LTD Insurance Benefit and Tax Analysis identifying the net monthly income loss as well as benefit, tax, and health care premium solutions.

Q.What tips can you offer to ease entry into the business DI market?

Cohen
Tip #1: You should know the business products that are available. Companies have designed many different products for business owners. Below are short highlights of some of the business products out there.

Business Overhead Expense (BOE): You may be working with a business owner who has seven or eight employees and the owner is the main thrust of the business. Without him or her, the business isn’t going to function. In this case, you’d talk about a business overhead expense policy.

An overhead expense insurance policy helps insure the business owner’s business expenses if a disability prevents them from working. It can keep the business afloat. And the list of expenses that are covered is quite extensive.

Disability Buy/Sell (also known as Disability Buy-Out Insurance): You may have sold an owner a life insurance policy to fund their buy/sell agreement. Well, you want to ask them, “How are you going to fund your buy/sell agreement for a disability?” Because disability buy-out insurance helps provide funds needed to purchase a totally disabled business owner’s interest. So, you’re using the insurance company —rather than you acting as the insurance company. That product is extremely important. Why don’t more business owners have it? Simple. Because they just don’t know about it. And why don’t they know about it? Because many advisors aren’t bringing it up.

Key Employee Replacement: There may be a situation where you go into an owner’s business and you uncover that there is a key employee. This key employee could even be the owner if he or she doesn’t own more than 50 percent of the business. (There are additional criteria that defines a key employee that you will need to know as well.)

The purpose of a Key Person Replacement insurance policy is to help protect the business from the total disability of an employee who is extremely important to its success. This coverage helps minimize the disruption to a business if it loses a key person. Benefits are paid to the business and can be used as needed to help with new hiring costs, staffing needs and replacing revenue.

Business Loan Protection: When talking to a business owner, he or she may say, “I have a loan. We purchased more equipment.” Or perhaps the owner reveals they’ve purchased another business. Your response is, “How do you fund that loan if you’re disabled? Because I have a product that will help you pay that loan, per underwriting guidelines.”

Tip #2: It’s important to work with an agency like ours that trains, teaches, and helps you get familiar with the products.

Tip #3: So, how do you bring up business disability products to a business owner? You ask questions. Asking questions uncovers the need.

You can ask a small business owner to tell you the longest vacation they’ve ever taken. They may say two or three weeks. Ask them why they don’t take longer. They’ll tell you. They can’t be gone longer. They have to watch their business. They have to make sure everything is done properly.

Tip #4: Where do you get the names? Where do you get the business people? You get clients through referrals. One business owner can refer you to another business owner. Also, look at your book of business. You know who is a business owner.

Cold calling works. A lot of people aren’t calling business owners about disability income protection. You can buy a list of business owners and call them on the phone. Google the business beforehand to get an idea of how many employees the company has. You may have to make several calls before you get one appointment.

Tip #5: What are the types of businesses to seek out when calling about business disability insurance? These business products are needed by all kinds of different small businesses—law firms, medical practices, architectural firms, accounting firms, engineering firms, small manufacturing companies. We have products for the blue-collar business market and white-collar businesses.

Tip #6: So, what do you say to the business owner? Whether you’re talking to a longtime client or to a business owner on a cold call, you say you’d like to make an appointment to go over disability income protection with them.

During the cold call you tell the business owner that you work in the business market with business owners and you work in the area of disability income protection. You let them know that you have a policy that will provide them with an income if they can’t work due to accident or illness.

Business owners have to protect their investment in that business. If that business goes under, employees can get another job. The owner? Well, he or she has a lot more to lose.

Most owners aren’t working 40 hours per week. It’s more like 60 hours per week. Plus, they never take long periods of time off. Without disability income protection, even a short time away from work due to a disability could be devastating to the life of a business.

So, a business owner’s need for disability income protection is great. Business disability protection is going to protect their standard of living. It’s going to protect their investment.

Tip #7: Remember, the owner may have a group LTD policy for his employees. You want to investigate that group LTD policy because that policy may only cover a small portion of the business owner’s income. So, naturally, we’d have to put another policy on top the group LTD policy to protect the owner.

Phillips
The obvious easy strategy is to bring up the concept to any business owners or group benefit relationships one might have. Have group LTD on an account? Look to see where the max benefits of the group LTD plan leave higher income earners short.

If an advisor works in planning for those who own their own business, simply ask if they have benefits at the workplace.

In addition, one of the adages I adhere to is, “You are what you market yourself as.” So a tip to get into the business market is to market yourself as someone who works in the Business DI Market! This might involve networking with benefits agencies, articles in local publications and websites, or even speaking to business organizations or professional insurance and financial planning associations. If you are seen in your market as an authority—if you bring up the concept to those in your sphere of influence, eventually you will be sought out as someone who can implement a strategy for a sound business DI plan (or even personal DI plan).

Schmitz
If you are already a financial, insurance, or benefits advisor, it is imperative to inform your clients about the existence of products that can help them manage the risk to their portfolios which may include business assets. Contact a DI BGA or DI specialist and have them provide you with training on business products. Start with Business Overhead Expense (BOE) to keep the business running, Disability Buy/Sell to buy out your disabled business partner, Loan Indemnification to pay the bank, and Key Person to pay the business when it loses a key person due to a disability.

Petersen
Use IDI sales as door openers. Once you have earned the trust of your personal DI clients, those that own businesses will hopefully be more open to seeing the importance of also protecting their businesses with buy/sell, key person, BOE and loan indemnification insurance. You have successfully protected their families, now ask them for the chance to equally protect their businesses.

Bloch
Many producers are looking for more daytime activity and the business marketplace is the perfect place to start. The DI marketplace needs more producers to discuss disability insurance and cash flow with business owners. The easy way to gain entry is with guarantee issue coverage. This can be through the implementation of a group LTD plan, which only requires two or more employees. In addition, there are specially designed guarantee issue products to supercharge group LTD plans. Business Overhead Expense coverage is also a very easy topic to discuss as well. From this starting point, it will be a normal progression to implement high quality individual protection.

2019 Analysis Of Worksite LTCI

The 2019 Milliman Long Term Care Insurance Survey, published in the July issue of Broker World magazine, was the 21st consecutive annual review of long term care insurance (LTCI) published by Broker World magazine. It analyzed individual product sales and Genworth group sales, reporting sales distributions and detailed insurer and product characteristics.

From 2006-2009, Broker World magazine published separate group LTCI surveys, but discontinued those surveys when the availability of group LTCI policies shrank. In 2011, Broker World magazine began annual analysis of worksite sales of individual products in August to complement the July overall market analysis.

The worksite market consists of individual policies and group certificates (“policies” henceforth) sold with discounts and/or underwriting concessions to groups of people based on common employment.

About the Survey
Our survey includes worksite (WS) sales and statistical distributions from Genworth group, MassMutual, New York Life, and Northwestern and worksite sales data from LifeSecure and Transamerica. We compare WS sales to individual LTCI policies that are not worksite policies (NWS) and to total sales (Total).

The July issue also included the California Public Employees Retirement System (CalPERS) program. CalPERS eligibility is based California public employment, but the program operates more like an affinity group than a worksite group, so it was counted as affinity sales in July and is not included as a worksite product in this article.

We limit our analysis to U.S. sales and exclude “combo” products, except where specifically indicated. (Also called “linked” benefits, combo products pay meaningful life insurance, annuity, or disability income benefits in addition to LTCI.)

If a business owner buys an individual policy and pays for it through her/his business, some participants may report such policies as “worksite” policies while others might not, if it was not processed as a worksite group.

If a business sponsors general long term care/LTCI educational meetings, with employees pursuing any interest in LTCI off-site, such sales are not treated as WS sales.

Highlights from This Year’s Survey

  • Participants reported 2018 WS sales of 8,436 policies (15.0 percent of total sales) for $15.64 million (9.1 percent of new annualized premium). The premium includes 2018 future purchase options exercised on policies issued in the past.
  • In 2018, the WS policies sold decreased by 41 percent and new annualized WS premium decreased 33 percent, compared to 2017 results, a much steeper drop than the whole stand-alone LTCI industry.
  • Our worksite sales are representative of nearly 100 percent of the stand-alone WS LTCI market, but our statistical distributions reflect about 65 percent of worksite sales.

MARKET PERSPECTIVE
The worksite market consists of three types of programs (which may apply to different employee classes in a single case):

  • In “core” (also known as “core/buy-up”) programs, employers pay for a small amount of coverage for generally a large number of employees; the employees can buy more coverage. “Core” programs generally have lower average ages, short benefit periods, low daily maximum benefits and few spouses insured.
  • In “carve-out” programs, employers pay for robust coverage for generally a small number of executives and usually their spouses. Generally employees can buy more coverage for themselves or spouses. Carve-out programs cover more married people and spouses and have higher age distributions than “core” programs.
  • In “voluntary” programs, employers pay nothing toward the cost of coverage. Coverage is more robust than “core” programs, but less robust than carve-out programs. Voluntary programs tend to be most weighted toward female purchasers.

MassMutual, New York Life and Northwestern write mostly executive carve-out programs, whereas Genworth, Transamerica and LifeSecure business includes a lot of voluntary and core buy-up business as well.

Prior to gender-distinct NWS pricing, many insurers simply offered a five or 10 percent worksite discount for a product that was already designed, state-approved and had illustration, sales material and administrative support.

Most people interpret Title VII of the 1964 Civil Rights Act to require that employer-involved LTCI sales use unisex pricing if the employer has had at least 15 employees for at least 20 weeks either in the current (or previous) year. Thus, to sell at the WS, insurers must create a separate unisex-priced product.

The added expense of separate pricing and administration for WS sales discourages insurers from serving both the WS and NWS markets. With the decrease in LTCI sales this century, insurers may be less confident that the effort of creating a WS program would be rewarded.

Because healthy, young, and less affluent people are less likely to buy, insurers and enrollers fear anti-selection (less-healthy people buying, while healthier people do not buy). Most WS programs offer health concessions which can exacerbate this risk.

Females get a good deal in a WS program compared to NWS pricing, but males pay more in the WS. Insurers fear that most worksite buyers might be female, hurting WS profitability. The Statistical section provides significant data in this regard. To the degree that sales skew to females, unisex pricing must approach gender-distinct female pricing (since females have higher expected future claims).

WS programs rarely offer “preferred health” discounts; insurers generally don’t get enough health information to grant such a discount. Thus, heterogeneous couples might pay more for a WS policy than a corresponding NWS policy, if the male spouse is older or buys more coverage and/or one or both spouses would qualify for a “preferred health” discount in the NWS market. In the carve-out market, a costlier LTCI product can still produce savings on an after-tax basis.

To control risk, most insurers will not accept a voluntary WS program if there are fewer than 100 employees. There is no “guaranteed issue” stand-alone LTCI coverage; however, some combo products offer some guaranteed issue with adequate WS participation. Insurers are also more careful about gender, age and income distributions of WS cases they accept. However, one insurer (which offers no health concessions) will, in half of US jurisdictions, accept voluntary LTCI programs with as few as twoemployees buying (the other jurisdictions require that three to five employees buy).

Some insurers have raised their minimum issue age to avoid anti-selection (few people buy below age 40) and reduce exposure to extremely long claims. Such age restrictions can discourage employers from introducing a program, especially a carve-out program if they have executives or spouses under age 40.

With increased remote work, more employers have employees stretched across multiple jurisdictions and eligible non-household relatives might live anywhere. But insurers are less likely than in the past to offer LTCI in jurisdictions with difficult laws, regulations or practices. So, it can be difficult to find an insurer which can cover everyone unless LTCI is sold on a group chassis and the employer does not have individuals in extra-territorial states.

One WS insurer no longer offers WS LTCI to non-household relatives. Reduced availability for such relatives does not have much impact on sales, because few non-household relatives buy WS LTCI. However, it undermines the suggestion that WS LTCI programs might reduce the negative impact of employees being caregivers.

In the past, an executive carve-out for two partners of a company with more than 15 employees could have been serviced by any LTCI company, but now it is hard to find a carrier that will offer unisex pricing under such circumstances. Thus, it is harder for some executives to benefit from the tax advantages of employer-paid coverage.

Some employee benefit brokers are reluctant to embrace LTCI because of declinations, the need to educate employees, certification requirements, their personal lack of expertise, etc. Increased WS sales are likely to depend upon LTCI specialists forming relationships with employee benefit brokers.

The Tax Cuts and Jobs Act of 2017 reduced the tax savings for C-Corporations buying LTCI for their employees and employees’ life partners. Pass-through entities may be the more attractive market now. Although the eligible premium is capped in a pass-through entity, a much higher marginal tax rate might apply.

Voluntary worksite LTCI sales, which lack the tax advantages of employer-paid coverage, may, like the NWS market, gravitate toward combo products, which have the added advantage of providing valuable life insurance that is viewed as a more immediate potential need by young employees with families.

The worksite is a great venue to serve people who can benefit substantially from LTCI and the state Partnership programs (described in the Partnership section below). Unfortunately, only 10.3 percent of 2018 WS sales qualified for Partnership programs.

Regulators have “stepped up,” as more than 20 jurisdictions now accept policies in their state Partnership programs even if maximum benefits compound by only one percent. By offering one percent compounding option, insurers can make core and voluntary WS programs more attractive.

Increased ong term care exposure coupled with attractive tax breaks for employer-paid coverage and Partnership and combo opportunities in the core and voluntary market may generate significant WS LTCI growth.

However, either consciously or subconsciously, employers understand that offering LTCI to their employees has little value for the employer. By the time the employee or spouse needs long term care, the employee will likely have terminated employment. The industry can help employers much more effectively by providing services which can reduce the likelihood of employees’ elders needing long term care and can make long term care more effective, more efficient and less expensive for employee caregivers.

STATISTICAL ANALYSIS
In reviewing the following data, remember that insurers’ sales distributions can vary greatly based on the submarket they serve (for example, in the WS market: Core, voluntary or carve-out). Therefore, distributions may vary significantly from year to year due to a change in participating insurers, in distribution within an insurer or in market share among insurers. Because our sales distributions reflect approximately 90 percent of NWS sales but only 65 percent of the worksite sales, the “total” distributions are skewed toward NWS characteristics.

Sales and Market Share
Table 1 shows historical WS sales and Table 2 shows WS sales as a percentage of total LTCI sales. The WS market dropped 41 percent in terms of number of new policies and 33 percent in new premium compared to 2016.

As shown in Table 3, most of the drop in sales resulted from an insurer which was #2 in the market in 2017 but was out of the market for most of 2018. Clearly, the other insurers did not gain market penetration as a result. The six top worksite carriers have been the same for several years and WS market share among carriers is distributed very differently from the NWS market. The percentage of each insurer’s new premium that comes from WS sales did not change dramatically from 2017 to 2018.

Average Premium Per Buyer
Table 4 shows the average premium per insured for new business (NB) in the WS market is about 50 percent as high as in the NWS market, because WS buyers are younger and purchase less robust coverage. While the NWS average premium per buying unit is 42 percent higher than the average premium per insured, the WS average premium per buying unit is only 29 percent higher because fewer spouses buy coverage in the WS.

Issue Age
Table 5 shows 2018 WS data is concentrated much more to ages 30-50 than in 2017. The reduced WS sales at ages 60+ led to a very low average WS issue age (42.2). Hence, the difference in average issue age between WS and NWS has increased from 5.3 years in 2016 to 15.4 years in 2018 (see Table 6).
Table 7 displays the relative age distribution of the population compared to purchasers in the NWS and WS markets.

Rating Classification
Most WS sales are in the “best” underwriting class (see Table 8) because there generally is only one underwriting class. Insurers often do not get enough information in WS to determine whether a “preferred health” discount could be granted and use the additional revenue (from not having a “preferred health” discount) to fund extra cost resulting from health concessions. Some carve-out programs may offer a “preferred” discount. A higher percentage of NWS cases were in the “best” class in 2018 because one insurer eliminated its preferred health discount (hence “standard” ratings were its “best”).

Benefit Period
Table 9 shows the combined WS percentage of three- and four-year benefit periods increased from 49.7 to 55.1 percent. Table 10 shows historical variation in the average WS benefit period. A large increase in two-year benefit period sales explains the lower WS average benefit period the past two years, probably caused by a difference in carriers reporting data. As discussed later, the WS market issues much less Shared Care, so the advantage of the NWS market in terms of benefit period is significantly greater than indicated in Table 9.

Maximum Monthly Benefit
Table 11 shows that the average initial monthly maximum benefit increased by $113 in 2018 in the WS market and by $50 in the NWS market. Table 12 shows how the WS initial monthly maximum has varied over time.

Benefit Increase Features
As shown in Table 13, the WS market has a lot more future purchase options (FPO; 72.1 percent vs 32.0 percent in the NWS market) because of its core programs. Correspondingly, only 13.4 percent of WS policies had automatic compound increases, compared with 49.3 percent of NWS policies.

Both markets showed an increase in indexed FPOs. In the WS market, this was caused by distribution shift among insurers. In the NWS market, it was caused by reclassifying an insurer’s sales; the insurer guarantees FPOs of indeterminate amount but bases its decision on interest rates.

Based on a $22/hour cost for non-professional personal care at home ($22 is the median cost according to Genworth’s 2018 study, the average WS initial maximum daily benefit of $137.60 would cover 6.3 hours of care per day at issue, whereas the typical NWS initial daily maximum of $161.21 would cover 7.3 hours of care per day, as shown in Table 14.

The number of future home care hours that could be covered depends upon when care is needed (we’ve assumed age 80), the home care cost inflation rate between now (age 42 for WS and 58 for NWS) and age 80 (we’ve calculated with two, three, four, five and six percent inflation), and the benefit increases provided by the LTCI coverage between now and age 80.

Table 14 shows calculations for 3 different assumptions relative to benefit increase features:

  • The first line presumes that no benefit increases occur (either sold without any benefit increase feature or no FPOs were exercised).
  • The second line reflects the average benefit increase design using the methodology reported in the July article, except that it assumes 25.8 percent elections of five percent compound FPOs, which we inferred in July is indicative of “positive” election FPOs (the increase occurs only if the client elects it).
  • The third line is like the second line except it assumes 90.0 percent FPO election, which we inferred in July is indicative of “negative” election FPOs (the increase occurs unless the client rejects it).

Table 14 indicates that:
1. Without benefit increases, purchasing power deteriorates significantly, particularly for the worksite purchaser because there are more years of future inflation for a younger buyer.
2. The “composite” (average) benefit increase design, assuming that 25.8 percent of FPO offers are exercised is much better, but still leads to significant loss of purchasing power. The exception: The WS client gains a bit of purchasing power if the inflation rate is only two percent (the composite with a 25.8 percent FPO election rate is equivalent to a bit more than two percent compounding).
3. With 90 percent FPO election rates, insured people will do much better retaining purchasing power. The average WS buyer would experience increased purchasing power if inflation averages less than four percent but would lose purchasing power if inflation exceeds four percent. The average NWS buyer would lose purchasing power even if inflation is only three percent.

Table 14 underscores the importance of considering future purchasing power when buying LTCI. Please note:
a) The average WS buyer was 16 years younger, hence has 16 more years of inflation and benefit increases in the above table. The effective inflation rate to age 80 is not likely to be the same for 42-year-olds versus 58-year-olds purchasing today.
b) WS sales have less automatic compounding and more FPOs, so WS results are more sensitive to FPO election rates.
c) Results vary significantly based on an insured’s issue age, initial maximum daily benefit, and benefit increase feature, as well as the inflation rate and the age at which the need for care occurs.
d) The median age of starting to need care is about age 83 and the median age of needing care is about age 85. By then, more purchasing power would be lost.
e) Table 14 does not reflect the cost of professional home care or a facility. According to the afore-mentioned 2018 Genworth study, the average nursing home private room cost is $275/day, which is currently comparable to 12.5 hours of non-professional home care. However, the inflation rate for facility costs is likely to differ from the inflation rate for home care.
f) Table 14 could be distorted by simplifications in our calculations. For example, we assumed that the FPO election rate does not vary by age, size of policy or market and that everyone buys a home care benefit equal to the average facility benefit.

Partnership Programs and Qualification Rates
When someone applies to Medicaid for long term care services, most states with Partnership programs disregard assets up to the amount of benefits received from a Partnership-qualified policy (some Indiana and New York policies disregard all assets). Partnership sales were reported in 44 jurisdictions in 2018, all but Alaska, District of Columbia, Hawaii, Massachusetts, Mississippi, Utah, and Vermont, where Partnership programs do not exist. Massachusetts has a somewhat similar program (MassHealth).
To qualify for a state Partnership program, a policy must have a sufficiently robust benefit increase feature, the requirement varying by issue age. Historically, a level premium with permanent annual three percent or higher compound increases or an otherwise similar consumer price index (CPI) increase was required for ages 60 or less. For ages 61 to 75, five percent simple increases also qualified, and for ages 76 or older, policies qualified without regard to the benefit increase feature. As noted above, many states now confer Partnership status with compounding as low as one percent. Three insurers offer one percent compounding. One of those insurers and three others offer two percent compounding.
The WS venue provides an efficient opportunity to serve less-affluent employees and relatives who would most benefit from Partnership qualification. Unfortunately, only 10.3 percent of WS sales in 2018 qualified for Partnership programs. Two insurers reported that 33 to 38 percent of their WS sales qualified, but the other two insurers reported that five to 6.5 percent qualified. Unfortunately, voluntary and core plans are less likely to qualify than carve-outs. As additional states permit one percent compounding and as insurers design products to offer one percent compounding, the percentage of Partnership policies sold in the WS market is likely to grow.

Jurisdictional Distribution
On the Broker World web-site (www.BrokerWorldMag.com), you can find a chart of the market share of each US jurisdiction relative to the total, WS and NWS markets, split by Partnership combined with non-Partnership policies and separately solely Partnership policies. This chart indicates where relative opportunity may exist to grow LTCI sales.

Elimination Period
Nearly 90 percent of the NWS market buys 90-day elimination periods (EPs). For that reason, most WS programs offer only a 90-day EP and 96 percent of 2018 WS sales had a 90-day EP, as shown in Table 15.

Table 15 also shows how many policies had a 0-day home care feature and a longer facility EP and how many policies had a calendar-day EP (as opposed to a service-day EP). We have reflected LifeSecure and Transamerica in the 0-day HC and calendar-day EP figures for both years. Policies which have 0-day EP, but define their EP as a service-day EP operate almost identically to a calendar-day EP.

Gender Distribution and Sales to Couples and Relatives
In 2018, women constituted 51.2 percent of the US age 20-79 population, but 54.8 percent of LTCI buyers in the NWS market. That’s not surprising; it has long been clear that women are more interested in LTCI. However, women constituted only 46.8 percent of the workers, but 57.7 percent of LTCI buyers in the worksite. This much larger discrepancy (10.9 vs. 3.6 percent in the NWS market) demonstrates that gender anti-selection occurs in the worksite. Table 16 shows that, in 2014 and prior years, more men purchased LTCI in the WS than women, because a significant part of the market was executive carve-out and more executives were male. But the LTCI industry adopted gender-distinct pricing in 2013 which spread through the industry the next few years. Since 2015, more women than men purchase WS LTCI. As noted earlier, carriers have taken a variety of steps to reduce such anti-selection or to reduce its impact. Considering that it is harder to find WS LTCI programs for employers with high percentages of females makes the statistics herein more striking. *Bureau of Labor Statistics, https://www.bls.gov/cps/demographics.htm

For insurers selling mostly executive carve-out programs, the percentage of females is lower than for insurers selling core and voluntary programs.

Table 17 digs deeper. In 2018, the difference in single females buying, between the WS and NWS markets, was the same as the difference for all females.

Not surprisingly, a higher percentage of the WS market consists of sales to single people and only one of a couple (core programs being one of the reasons). Over sixty percent (60.7 percent) of couples in the WS market insure only one person, which is particularly striking because the WS market should have fewer declines due to a younger age distribution, health concessions, and better health among working people than non-workers.

Shared Care is less common in the WS market because it is less commonly offered than in the NWS market.

As noted earlier, between 2006 and 2009, Broker World magazine published group LTCI surveys. At that time, parents and grandparents accounted for less than one percent (approximately 0.75 percent) of sales. This year, one insurer (one that focuses on the executive carve-out market) was able to share family sales data; 1.9 percent of its policies were issued on other relatives, which is a little broader net than parents and grandparents. Sixty-eight (68) spouses were written for every 100 employees, which seems to be characteristic of the executive carve-out market.

Type of Home Care Coverage
Table 18 summarizes sales by type of home care coverage. Historically, the WS market sold few policies with a home care maximum equal to the facility maximum. But with increasing emphasis on home care and simplicity, that difference faded. However, in 2018, one insurer sold 22 percent of its WS policies with a home care maximum equal to 75 percent of the facility maximum. Table 18 also shows that monthly determination dominates the NWS market, but daily determination still dominates the WS market.

Many worksite products embed a “partial cash alternative” feature (which allow claimants, in lieu of any other benefit that month, to use approximately one-third of their benefit for whatever purpose they wish, with the balance extending the benefit period) or a small informal care benefit.

Other Features
Return of Premium (ROP, see Table 19) dropped from 54.7 percent of WS policies in 2015 to 12.7 percent in 2018 (different participants). In the WS, 94.2 percent of the ROP benefits were embedded automatically versus 84.2 percent in the NWS market. In the WS market, 70.5 percent of the embedded ROP sales had death benefits that expire (such as expiring at age 67) or don’t reach 100 percent. ROP with expiring death benefits can provide an inexpensive way to encourage more young people to buy coverage, but may not provide a meaningful benefit.

Table 20 shows that Shared Care and Restoration of Benefits are less frequently sold in the WS market and that all WS sales are tax-qualified.

CLOSING
We thank insurance company staff for submitting the data and responding to questions promptly. We also thank Nicole Gaspar and Alex Geanous of Milliman for managing the data expertly.

We reviewed data for reasonableness. Nonetheless, we cannot assure that all data is accurate.

If you have suggestions for improving this survey, please contact one of the authors.