The 2020 Milliman Long Term Care Insurance Survey, published in the July issue, was the 22nd consecutive annual review of long term care insurance (LTCI) published by Broker World magazine. It analyzed individual product sales and Genworth group sales, reporting sales distributions and detailed insurer and product characteristics.
From 2006-2009, Broker World published separate group LTCI surveys, but discontinued those surveys when the availability of group LTCI policies shrank. In 2011, Broker World began annual analysis of worksite sales of individual products in August to complement the July overall market analysis.
The worksite market consists of individual policies and group certificates (“policies” henceforth) sold with employer support, such as permitting on-site solicitation and/or paying or collecting premiums. If a business owner buys an individual policy and pays for it through her/his business, some participants may report such policies as “worksite” policies while others might not if it was not processed as a worksite group. If a business sponsors general LTC/LTCI educational meetings, with employees pursuing any interest in LTCI off-site, such sales are not counted here as WS sales.
We limit our analysis to U.S. sales and exclude “combination” products except where specifically indicated. (Combination products pay meaningful life insurance, annuity, or disability income benefits in addition to LTCI.)
About the Survey
Our survey includes worksite (WS) sales and statistical distributions from MassMutual, National Guardian Life, New York Life, and Northwestern, and worksite sales data from Genworth, LifeSecure and Transamerica. We compare WS sales to individual LTCI policies that are not worksite policies (NWS) and to total sales (Total).
The July issue also included sales of the California Public Employees Retirement System (CalPERS) program. CalPERS eligibility is based California public employment, but the program operates more like an affinity group than a worksite group, so it was counted as affinity sales in July and is not included as a worksite product in this article.
Ten percent of single premiums are included as annualized premiums.
Highlights from This Year’s Survey
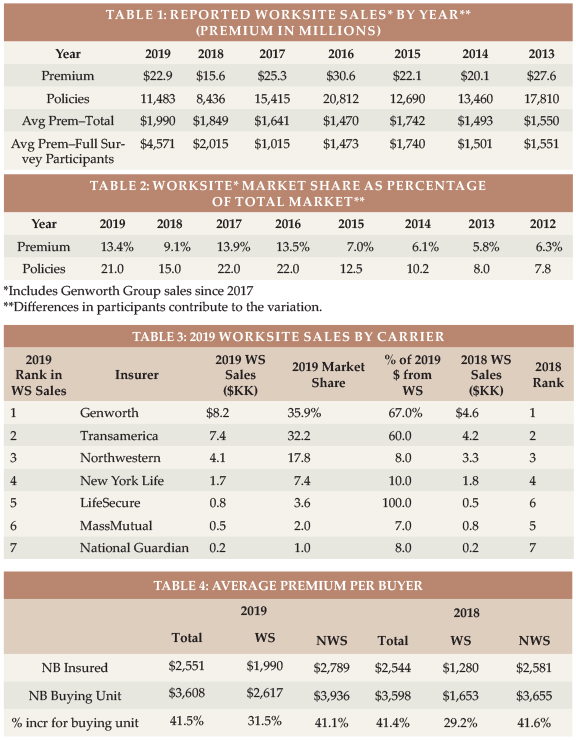
- Participants reported 2019 WS sales of 11,483 policies (21.0 percent of total sales) for $22.85 million (13.4 percent of new annualized premium). The premium includes 2019 future purchase options exercised on policies issued in the past.
- In 2019, WS sales rebounded from the 2018 results we reported last year. The three insurers which are most focused on voluntary worksite LTCI programs all had sales increases of between 62 and 76 percent in 2019, despite increased competition from a new entrant and from life insurance LTCI linked-benefit programs.
- Our worksite sales total includes nearly 100 percent of the stand-alone WS LTCI market, but our statistical distributions reflect only about 12 percent of worksite policies sold (28 percent of premium). Our worksite statistical distributions can vary significantly from year-to-year because insurers focusing on particular worksite markets may be over- or under-represented. Last year, we commented that the worksite business in our statistical analysis was overly weighted toward executive carve-out programs. This year that imbalance has increased. The carriers that provided 2019 statistical data had an average worksite annual premium of $4,568 whereas the ones that provided only total sales had an average worksite premium of $1,627. The corresponding 2018 averages were $2,015 and $1,561. In 2017, the difference was in the other direction ($1,015 vs. $1,441).
MARKET PERSPECTIVE
The three segments of the worksite market (which may apply to different employee classes in a single case):
- In “core” (also known as “core/buy-up”) programs, employers pay for a small amount of coverage for generally a large number of employees; the employees can buy more coverage. “Core” programs generally have lower average ages, short benefit periods, low daily maximum benefits and a small percentage of spouses insured.
- In “carve-out” programs, employers pay for robust coverage for generally a small number of executives and usually their spouses. Generally, employees can buy more coverage for themselves or spouses. Compared to “core” programs, a higher percentage of insureds are married, more spouses buy coverage and the age distribution is older.
- In “voluntary” programs, employers pay nothing toward the cost of coverage. Coverage is more robust than “core” programs, but less robust than “carve-out” programs. Voluntary programs tend to be most weighted toward female purchasers.
MassMutual, National Guardian, New York Life and Northwestern write mostly executive carve-out programs, whereas Genworth, Transamerica and LifeSecure business includes significant voluntary and core buy-up business as well. Because the insurers that write mostly executive carve-out business provided statistical data this year and the other insurers provided only total sales, our statistical distributions are more representative of the executive carve-out subset of the market than all types of worksite sales.
Insurer Challenges in the Worksite Market
COVID-19: In 2020, worksite insurers, like most businesses, experienced challenges due to the COVID-19 pandemic. Most scheduled enrollments were canceled or delayed. Enrollments of newly-eligible employees continued, being done in web meetings. As a result, we expect 2020 worksite (and individual) LTCI sales to be lower than 2019.
We suspect 2021 will remain suppressed because a lot of new 2021 sales would typically be enrolled in the 4th quarter of 2020. Even if the worksite LTCI market were to bounce back quickly, we anticipate that a lot of 2021 activity would produce 2022 sales. Moreover, potential unemployment and reduced profitability (due to reduced sales and increased expenses) may blunt enthusiasm for new employee benefit programs. Employers may focus instead on protecting employees and clients from communicable diseases by testing and providing protective equipment to employees and clients. More comments about the impact of COVID-19 on the LTCI market were published on the Broker World Magazine website as part of our July analysis.
Pricing considerations: Most people interpret Title VII of the 1964 Civil Rights Act to require that employer-involved LTCI programs use unisex pricing if the employer has had at least 15 employees for at least 20 weeks either in the current or previous year. Thus, to sell at the WS, insurers must create a separate unisex-priced product. The expense of separate pricing, marketing and administration discourages insurers from serving both the WS and NWS markets.
Because healthy, young, and less affluent people are less likely to buy, insurers and enrollers fear health anti-selection (less-healthy people buying, while healthier people do not buy). Health concessions can exacerbate this risk, hence are less common and generous than in the past. There is no “guaranteed issue” stand-alone LTCI coverage; however, some combination products offer some guaranteed issue with adequate WS participation.
WS programs rarely offer “preferred health” discounts; insurers may not get enough health information to grant such a discount. Thus, heterosexual couples might pay more for a WS policy than a corresponding NWS policy, if the male spouse is older or buys more coverage and/or one or both spouses would qualify for a “preferred health” discount in the NWS market. In the carve-out market, a costlier LTCI product can still produce savings on an after-tax basis, because of the tax advantages when employers pay the premium.
Females get a good deal in a WS program compared to NWS pricing, but males pay more in the WS. Insurers fear that most worksite buyers might be female, hurting WS profitability. To the degree that sales skew to females, unisex pricing must approach sex-distinct female pricing (because females have higher expected future claims).
In addition to health and gender distribution, insurers are also careful about age and income distributions of WS cases they accept. Younger and less affluent people are less likely to buy LTCI, so insurers are more vulnerable to health- or gender-anti-selection if the group has a lot of young or less affluent employees.
Some insurers have raised their minimum issue age to avoid anti-selection (few people buy below age 40) and to reduce exposure to extremely long claims. Such age restrictions can discourage employers from introducing a program, especially a carve-out program if they have executives or spouses under age 40.
To control risk, most insurers will not accept a voluntary WS program if there are fewer than 100 employees. However, one insurer (which offers no health concessions) will accept voluntary LTCI programs with as few as two to five employees buying (minimum varies by jurisdiction).
Availability of coverage: With increased remote work, more employers have employees stretched across multiple jurisdictions and eligible non-household relatives might live anywhere. But insurers are less likely than in the past to offer LTCI in jurisdictions with difficult laws, regulations or practices. So, it can be difficult to find an insurer which can cover everyone unless LTCI is sold on a group chassis and the employer does not have individuals in extra-territorial states.
One WS insurer no longer offers WS LTCI to non-household relatives. Reduced availability for such relatives does not have much impact on sales, because few non-household relatives buy WS LTCI. However, it undermines the suggestion that WS LTCI programs might reduce the negative impact of employees being caregivers.
Prior to sex-distinct pricing, an executive carve-out for two partners of a company with more than 15 employees could have been serviced by any LTCI company, but now it is hard to find a carrier that will offer unisex pricing under such circumstances. Such executives may buy policies with sex-distinct pricing either because they are unaware of the requirement under Title VII of 1964 Civil Rights Act, they are confident that no female will file a civil rights complaint, or they disagree with the interpretation that such policies should have unisex pricing to avoid the risk of a civil rights complaint.
Some employee benefit brokers are reluctant to embrace LTCI because of declinations, the enrollment effort, certification requirements, their personal lack of expertise, etc. Increased WS sales are likely to depend upon LTCI specialists forming relationships with employee benefit brokers.
The Tax Cuts and Jobs Act of 2017 reduced the tax savings for C-Corporations buying LTCI for their employees and employees’ life partners. Pass-through entities may be the more attractive market now. Although the eligible premium is capped in a pass-through entity, a much higher marginal tax rate might apply than for a C-Corporation.
Voluntary worksite LTCI sales lack the tax advantages of employer-paid coverage. Therefore, voluntary programs for young and less-affluent groups may gravitate toward combo products as they include life insurance that is viewed as a more immediate potential need by young employees with families.
The worksite is a great venue to serve people who can benefit from the state Partnership programs (described in the Partnership section). In 2019, 30.5 percent of WS qualified for Partnership programs compared to only 10.3 percent in 2018. However, the increase is at least partly because executive carve-out sales dominate our statistical distributions. As executives are less likely to benefit from Partnership programs the increase may not be meaningful. Core/buy-up programs rarely include compounded benefits and employees often are not willing to pay for the compounding necessary to qualify for the Partnership program.
Regulators have “stepped up,” as 26 jurisdictions now accept policies issued at any age to qualify as Partnership policies even if maximum benefits compound by only one percent. The inclusion of one percent compounding at all ages can make core and voluntary WS programs more attractive. There is a potential market opportunity for an insurer willing to allow a lower minimum monthly maximum for core/buy-up programs with one percent compounding. Four other states permit one percent but only for ages 61+.
The worksite market should be poised for growth given the acceptance of one percent compounding benefits, Partnership qualification, attractive tax breaks, challenged government budgets, advantages over life/LTCI linked benefits (that lack Partnership and tax advantages), and a growing need for LTC insurance coverage. However, employers perceive that offering LTCI to their employees has little value for the employer. By the time the employee or spouse needs LTC, the employee will likely have terminated employment. Employee benefit brokers can help employers more effectively by expanding existing services that reduce the likelihood that employees’ elders will need LTC, which may make LTC more effective, more efficient, safer and less expensive. Enabling employees and their families to have better LTC experiences and to use more (not necessarily 100 percent) commercial care should boost productivity at work.
STATISTICAL ANALYSIS
As mentioned earlier, insurers’ sales distributions can vary greatly based on the submarket they serve (for example, in the WS market: core, voluntary or carve-out). Therefore, distributions may vary significantly from year to year due to a change in participating insurers, in distribution within an insurer or in market share among insurers. Our sales distributions reflect only about 12 percent of worksite policies and certificates issued in 2019 and are mostly representative of the executive carve-out market. For example, two insurers provided data regarding the number of worksite cases they opened up. Their combined average size was only three policies per worksite. Policies in the carve-out market are designed similarly to those in the NWS (non-worksite) market.
Sales and Market Share
Table 1 shows historical WS sales for all insurers reporting sales. The WS market increased in 2019 relative to 2018 but did not reach the level of sales experienced in 2016-2017. As noted earlier, the three carriers specializing in voluntary sales all had increases between 62-76 percent in 2019.
Lower sales in 2018 appears to be mostly attributable to a significant player temporarily leaving the market that year. Its competitors did not seem to get additional 2018 sales in that carrier’s absence, but their sales grew significantly in 2019. As voluntary worksite cases have a meaningful gestation period and are often enrolled late in the year with effective dates early in the next year, there may be a lag before competitors can fill in after an insurer drops out.
Table 1 also shows the overall average worksite premium compared to the average worksite premium for the participants who contributed statistical data beyond sales. As shown in the table, worksite statistics likely represented the broad worksite market well through 2016. However, beginning in 2017, our worksite distributions reflected sales that were not representative of the whole worksite market.
Table 2 shows the above WS sales as a percentage of total LTCI sales. For the most part, this percentage has stayed relatively level in the past four years and much higher than prior to 2016.
As shown in Table 3, three insurers wrote 60 percent or more of their 2019 new premium in the worksite, while the other insurers wrote ten percent or less of their business in that market. The percentage of each insurer’s new premium that comes from WS sales did not change dramatically from 2018 to 2019.
Average Premium Per Buyer
Table 4 shows that, in 2019, the NWS average premium per buying unit (a couple comprise a single buying unit) was 41.1 percent higher than the average premium per insured. This dropped to 31.5 percent in the worksite, because more buyers in the worksite are single and because spouses are less likely to buy in the worksite. These numbers reflect all participants, but the ratio of buying unit to insured unit is determined solely by the participants who are able to report sales based on marital status. The worksite ratio is probably somewhat overstated because the participants who reported premium by marital status for the worksite were not characteristic of the entire market.
Issue Age
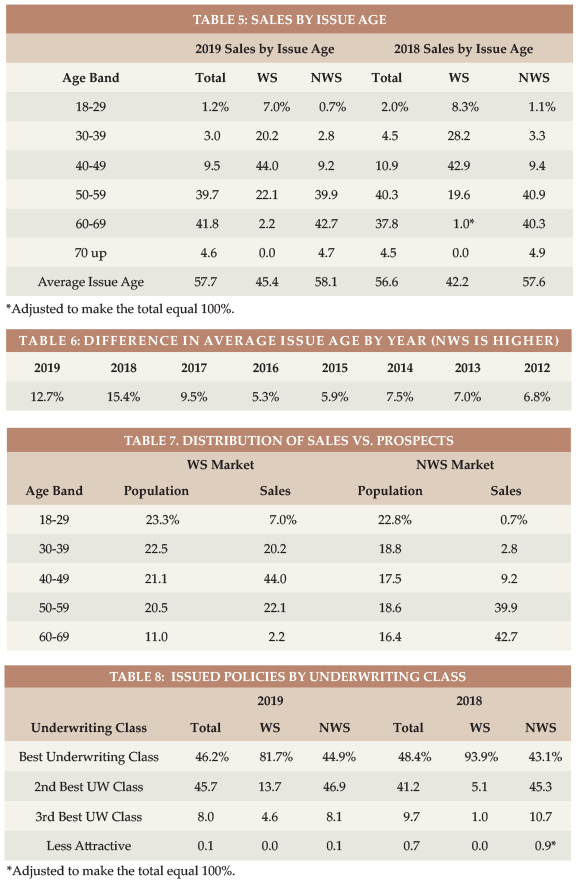
The balance of the statistical presentations is non-representative of the entire worksite market. We report the results we have available, though we urge you to be selective in how you use the data. Not surprising, Table 5 shows the WS market is much more weighted to the younger ages, even with data that is disproportionately weighted to executive carve-out programs. However that data bias seems to have reduced the difference between average age inside and outside the WS market.
Table 7 displays the relative age distribution of the population compared to purchasers in the NWS and WS markets.
Rating Classification
Most WS sales are in the “best” underwriting class (see Table 8) because there generally is only one underwriting class. Insurers often do not get enough information in WS to determine whether a “preferred health” discount could be granted and use the additional revenue (from not having a “preferred health” discount) to fund extra cost resulting from health concessions. Carve-out programs are more likely to offer a “preferred” discount, which means a higher percentage of carve-out policies are issued in the second-best underwriting class.
Benefit Period
Originally, the WS average benefit period was lower than the individual market average benefit period. The relative benefit periods have come closer together over time because the average benefit period in the NWS market has dropped. The executive carve-out portion of the WS market seems to have dropped to a lesser degree. This year, many short benefit period WS sales are not reflected, resulting in the WS average benefit period being essentially identical to the NWS market. Table 10 shows similar results in the 2013-2016 era. As noted elsewhere, this data can jump around based on which insurers provide such detail and also based upon whether some large core/buy-up cases are written in a particular year.
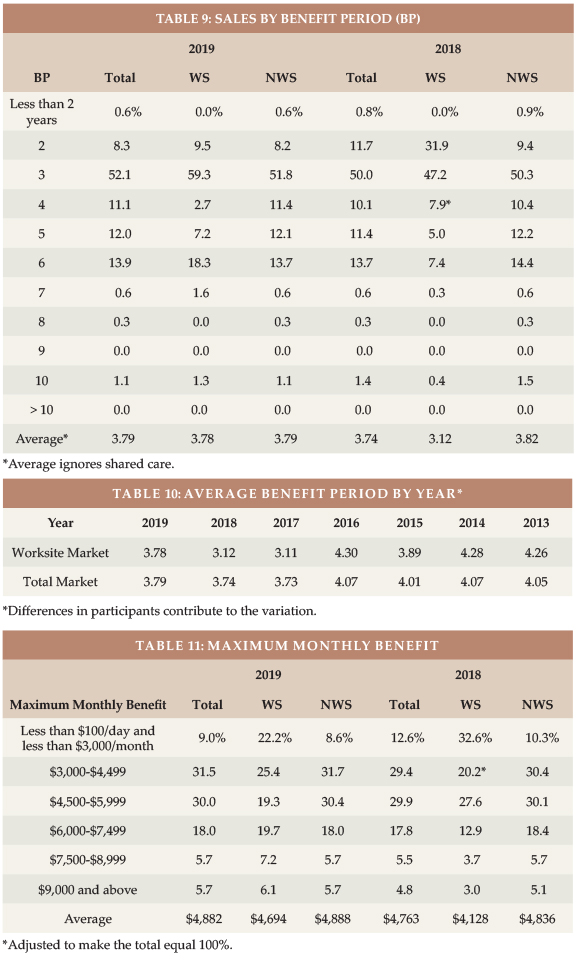
As discussed later, the WS market issues much less Shared Care, so the NWS market is still generally buying longer coverage.
Maximum Monthly Benefit
Even with a lot of executive carve-out business, Table 11 shows that the WS market has significantly more coverages that are less than $100/day (and also less than $3000/month). Many core programs are sold with a $50/day or $1500/month initial maximum benefit.
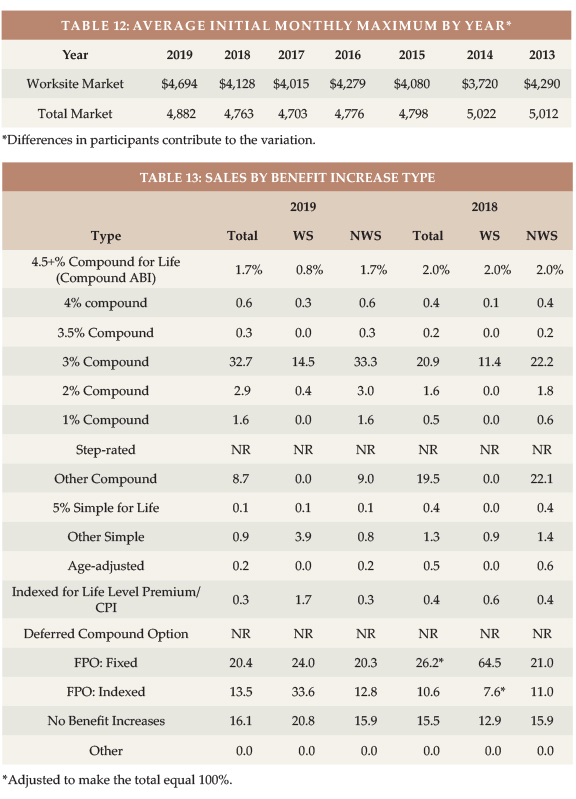
Table 12 shows that the WS initial monthly maximum has varied more over time than the whole market, because of participant changes and how many core/buy-up plans were sold in a particular year.
Benefit Increase Features
As shown in Table 13, the WS market has more future purchase options (FPO), because of its core programs.
Future Protection
Based on a $23/hour cost for non-professional personal care at home ($23 is the median cost according to Genworth’s 2019 study), the average WS initial maximum daily benefit of $156.47 would cover 6.8 hours of care per day at issue, whereas the typical NWS initial daily maximum of $162.94 would cover 7.1 hours of care per day, as shown in Table 14.
The number of future home care hours that could be covered depends upon when care is needed (we have assumed age 80), the home care cost inflation rate between now (age 45 for WS and 58 for NWS) and age 80 (we have calculated with two, three, four, five and six percent inflation), and the benefit increases provided by the LTCI coverage between now and age 80.
Table 14 shows calculations for 3 different assumptions relative to benefit increase features:
- The first line presumes that no benefit increases occur (either sold without any benefit increase feature or no FPOs were exercised).
- The second line reflects the average benefit increase design using the methodology reported in the July article, except it assumes that 40 percent of FPOs are elected (intended to be indicative of “positive” election FPOs, in which the increase occurs only if the client elects it) and provide five percent compounding.
- The third line is like the second line except it assumes 90 percent of FPOs are elected (intended to be indicative of “negative” election FPOs, in which the increase occurs unless the client rejects it).
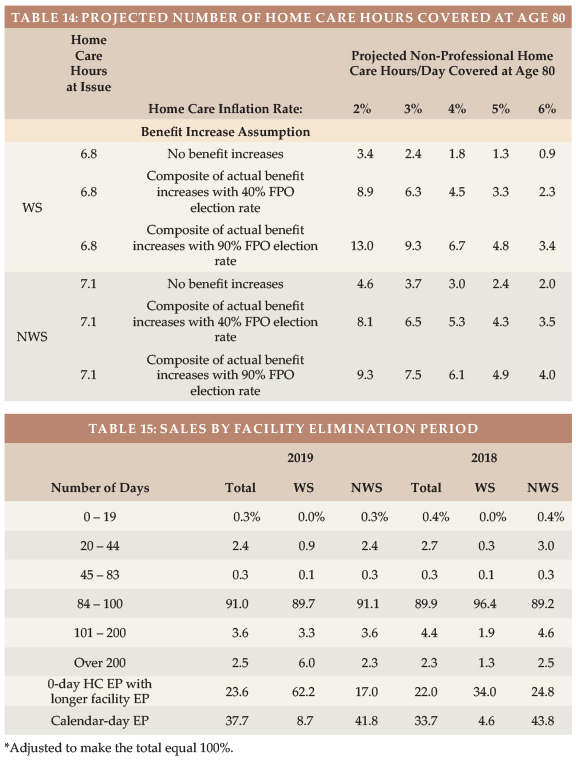
Table 14 indicates that:
- Without benefit increases, purchasing power deteriorates significantly, particularly for the worksite purchaser because there are more years of future inflation for a younger buyer.
- The “composite” (average) benefit increase design assuming that 40 percent of FPO offers are exercised preserves purchasing power better than when no increase are assumed, but still generally leads to significant loss of purchasing power. The exceptions: both WS and NWS clients gain a bit of purchasing power if the inflation rate is only two percent (the composite with a 40 percent FPO election rate is equivalent to a bit more than two percent compounding). With three percent inflation, the loss in purchasing power is a bit less than ten percent.
- With 90 percent FPO election rates, insured people retain more purchasing power compared to no increases or 40 percent election rates. The average WS buyer would experience increased purchasing power if inflation averages less than 3.9 percent, but would lose purchasing power if inflation exceeds 3.9 percent. The average NWS buyer would experience increased purchasing power if inflation average less than 3.25 percent but would lose purchasing power if inflation exceeds 3.25 percent.
Table 14 underscores the importance of considering future purchasing power when buying LTCI. Please note:
a) The average WS buyer was 13 years younger, hence has 16 more years of inflation and benefit increases in the table. The effective inflation rate to age 80 is not likely to be the same for 45-year-olds versus 58-year-olds purchasing today.
b) WS sales have less automatic compounding and more FPOs, so WS results are more sensitive to FPO election rates.
c) Results vary significantly based on an insured’s issue age, initial maximum daily benefit, and benefit increase feature, as well as the inflation rate and the age at which the need for care occurs.
d) By the median age of starting to need care (about age 83) and the median age of needing care (about age 85), more purchasing power would be lost.
e) Table 14 does not reflect the cost of professional home care or a facility. According to the aforementioned 2019 Genworth study, the average nursing home private room cost is $280/day, which is currently comparable to 12.2 hours of non-professional home care. However, the inflation rate for facility costs is likely to differ from the inflation rate for home care. From 2004-2019, Genworth’s studies showed the following compound growth rates: Private room in a nursing home (3.1 percent), an ALF (3.6 percent), home health aide (1.7 percent), and home care homemaker (2.1 percent).
f) Table 14 could be distorted by simplifications in our calculations. For example, we assumed that the FPO election rate does not vary by age, size of policy or market and that everyone buys a home care benefit equal to the average facility benefit.
Partnership Program Background
When someone applies to Medicaid for long term care services, most states with Partnership programs disregard assets up to the amount of benefits received from a Partnership-qualified policy (some Indiana and New York policies disregard all assets). Partnership sales were reported in 43 jurisdictions in 2019, all but California (no participants offer California Partnership policies) and Alaska, District of Columbia, Hawaii, Massachusetts, Mississippi, Utah, and Vermont, where Partnership programs do not exist. Massachusetts has a somewhat similar program (MassHealth).
To qualify for a state Partnership program, a policy must have a sufficiently robust benefit increase feature, the requirement varying by issue age and jurisdiction. Historically, a level premium with permanent annual three percent or higher compound increases or an otherwise similar consumer price index (CPI) increase was required for ages 60 or less. For ages 61 to 75, five percent simple increases also qualified, and for ages 76 or older, policies qualified without regard to the benefit increase feature. As noted, many states now confer Partnership status with compounding as low as one percent. Two insurers offer one percent compounding in worksite products.
The WS venue provides an efficient opportunity to serve less-affluent employees and relatives who would most benefit from Partnership qualification. However, only 30.5 percent of WS sales in 2019 qualified for Partnership programs and most of those policies were probably executive carve-out programs. If additional states permit one percent compounding and if insurers design products to offer one percent compounding, the percentage of Partnership policies sold in the WS market is likely to grow.
Jurisdictional Distribution
On the Broker World website, you can find a chart of the market share of each US jurisdiction relative to the total, WS and NWS markets, split by Partnership combined with non-Partnership policies and separately solely Partnership policies. This chart indicates where relative opportunity may exist to grow LTCI sales.
Elimination Period
About 90 percent of the NWS market buys 90-day elimination periods (EPs). For that reason, most WS programs offer only a 90-day EP. The WS 90-day EP percentage of 89.7 percent shown below is understated because we lacked data for some participants which are almost entirely 90-day EP.
Table 15 also shows how many policies had a 0-day home care feature and a longer facility EP and how many policies had a calendar-day EP (as opposed to a service-day EP). We have reflected that all LifeSecure policies are 90-day EP with a calendar-day definition and that all Transamerica sales have zero-day home care EP. Policies which have zero-day home care EP, but define their EP as a service-day EP operate almost identically to a calendar-day EP.
The significant differences in zero-day home care EP and in calendar-day EP by market are reflective of specific insurers’ design preference; they do not appear to be driven by the market.
Gender Distribution and Sales to Couples and Relatives
In 2013, insurers started to use sex-distinct pricing, but, as explained, that change has not extended to the worksite market.
The 2012 NWS percentage of female sales in Table 16 reflects a relatively high percentage of female sales in 2012 due to recognition that sex-distinct pricing would occur in 2013. The 2013-2015 percentages of females in the NWS market remained high as insurers which still offered unisex pricing attracted single females.
In the past four years, the percentage of female buyers in the NWS has been stable, fluctuating from 54.3 to 54.9 percent.
Until 2019, the percentage of WS buyers who are female had increased since insurers started using sex-distinct pricing in the NWS market. Perhaps the biggest reason is that women are more interested in LTCI, perhaps especially so in the worksite market because of the WS unisex pricing. Furthermore, the percentage of workers who are female was probably increasing as was the percentage of females among executives (hence included in executive carve-out programs). We noted last year that women constituted 51.2 percent of the U.S.A age 20-79 population in 2018,* but only 46.8 percent of the workers,* which underscores the significance of a higher female percentage of sales in the worksite.
In 2019, the percentage of female sales in the worksite dropped to 51.7 percent from 57.7 percent in 2018. Of this 6.0 percent arithmetic drop, only 0.6 percent was attributable to different insurers providing data in 2019 compared to 2018. The bulk of the difference is attributable to a drop in female sales for a major insurer. *Bureau of Labor Statistics, https://www.bls.gov/cps/demographics.htm
Table 17 digs deeper, exploring the differences between the WS and NWS markets in single female, couples and Shared Care sales. It shows that the decrease in female sales at the worksite was primarily among single people.
Couples who both buy are less likely to purchase Shared Care in the WS market than in the NWS market, because Shared Care is less commonly offered in the WS market and because executive carve-out programs often do not include Shared Care. The bottom row of Table 17 adjusts for insurers not offering Shared Care in the WS market, but does not adjust for advisors and employers choosing not to offer it or not to pay for it. (Married executives generally benefit more from executive carve-out LTCI programs than do single executives, because the employer typically pays for the spouse. Employers may shy away from paying for Shared Care because it would favor married executives even more.)
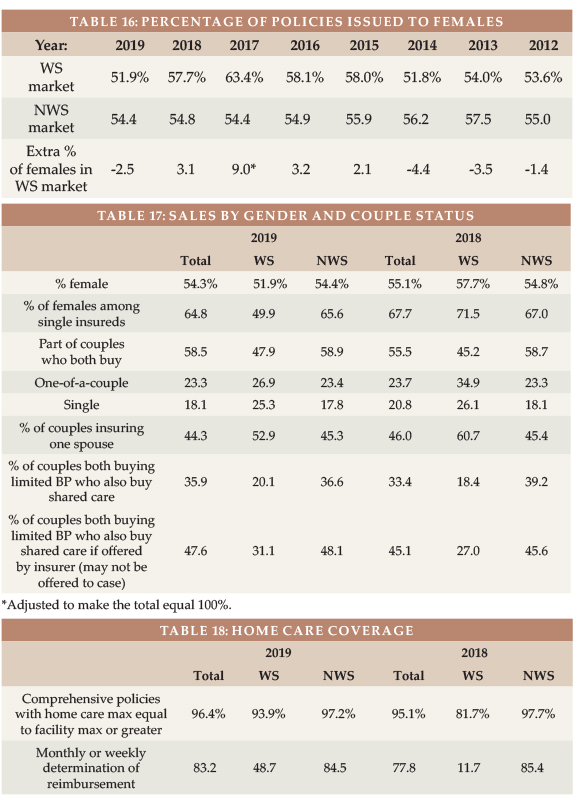
Type of Home Care Coverage
Table 18 summarizes sales by type of home care coverage. Historically, the WS market sold few policies with a home care maximum equal to the facility maximum. But with increasing emphasis on home care and simplicity, that difference faded. The increase in the percentage of WS policies with a maximum home care benefit equal to the nursing home maximum (81.7 percent in 2018 vs. 93.9 percent in 2019) is attributable to a change in participants. Table 18 also shows that monthly determination dominates the NWS market, but daily determination still dominates the WS market, albeit less so in the executive carve-out market.
Many worksite products embed a “partial cash alternative” feature (which allow claimants, in lieu of any other benefit that month, to use approximately one-third of their benefit for whatever purpose they wish, with the balance extending the benefit period) or a small informal care benefit.
Other Features
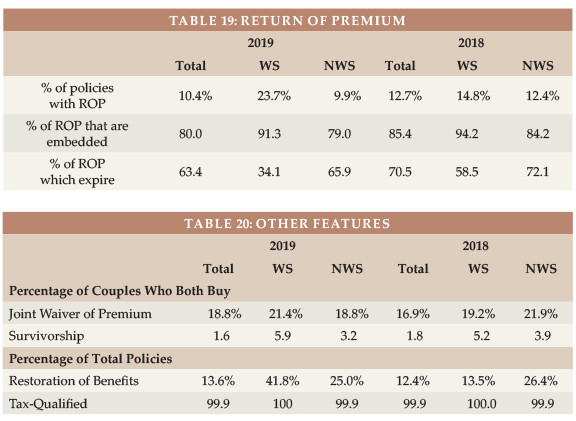
Table 19 suggests that Return of Premium (ROP) became more common in the WS market and that a lot more of the WS ROP coverages were permanent; however, if the data is limited to participants that provided data each year, the frequency of ROP would have been unchanged and the percentage that were permanent would have actually decreased. ROP was less common in the NWS market in 2019 than in 2018. ROP with expiring death benefits can provide an inexpensive way to encourage more young people to buy LTCI but may not provide a meaningful benefit.
Table 20 shows little change in the sales of Joint Waiver of Premium and Survivorship to couples, but that Restoration of Benefits (ROB) appears to have been sold more often in the WS in 2019. The increase in WS ROB sales is more than explained by a change in participants. All WS sales are tax-qualified.
CLOSING
We thank insurance company staff for submitting the data and responding to questions promptly. We also thank Nicole Gaspar, Alex Geanous and Anders Hendrickson of Milliman for managing the data expertly.
We reviewed data for reasonableness. Nonetheless, we cannot assure that all data is accurate.
If you have suggestions for improving this survey, please contact one of the authors.