The 2021 Milliman Long Term Care Insurance Survey, published in the July issue of Broker World magazine, was the 23rd consecutive annual review of long-term care insurance (LTCI) published by Broker World magazine. It analyzed product sales, reporting sales distributions and detailed insurer and product characteristics.
From 2006-2009, Broker World published separate group LTCI surveys, but discontinued those surveys when the availability of group LTCI policies shrank. In 2011, Broker World began this August annual analysis of worksite (“WS”) sales to complement the July overall market analysis.
The WS market consists of individual policies and group certificates (“policies” henceforth) sold with employer support, such as permitting on-site solicitation and/or paying or collecting premiums. If a business owner buys a policy for herself and pays for it through her business, participants likely would not report her policy as a WS policy because it was not part of a WS group. If a business sponsors general LTC/LTCI educational meetings, with employees pursuing any interest in LTCI off-site, sales would not be reported as WS sales.
We limit our analysis to US sales and exclude “combination” products, except where specifically indicated. (Combination products pay meaningful life insurance, annuity, or disability income benefits in addition to LTCI.)
About the Survey
Our survey includes WS sales and statistical distributions from National Guardian Life, New York Life, and Northwestern and WS sales data from LifeSecure and Transamerica. We estimated sales from some other insurers and compare WS sales to individual LTCI policies that are not WS policies (NWS) and to total sales (Total).
The July issue included data for the California Public Employees Retirement System (CalPERS) program. CalPERS eligibility is based on California public employment, but the program operates more like an affinity group than a WS group, so it was counted as affinity sales in July and is in the NWS data, not the WS data, in this article.
Ten percent of single premiums are included as annualized premiums.
Highlights from This Year’s Survey
- We estimate 2020 WS sales of 9,700 policies (approximately 20 percent of total sales) for $19.75 million (nearly 15 percent of total new annualized premium) which is a about a 15 percent decrease in both premium and number of sales from 2019. The premium includes 2020 future purchase options exercised on policies issued in the past.
- In 2019, WS sales had rebounded from low 2018 sales. 2020 appeared likely to be another good year until the pandemic struck, hampering sales activities from April through year-end. As different WS markets have different seasonal sales patterns, the pandemic can impact statistical characteristics as well as sales.
- We estimate that our WS sales total includes more than 95 percent of the stand-alone WS LTCI market, but our statistical distributions reflect only about 15 percent of WS policies. Our WS statistical distributions can vary significantly from year-to-year because insurers focusing on particular WS markets may be over- or under-represented. The carriers that provided 2020 statistical data had an average WS annual premium of $4,218 whereas the ones that provided only total sales had an average WS premium of $1,665, which indicates that our statistical analysis, like last year, is overly weighted toward executive carve-out programs. While these averages are quite close to the previous year’s numbers ($4,568 and $1,627), they can vary greatly year over year. The corresponding 2018 averages were $2,015 and $1,561. In 2017, the difference was in the other direction ($1,015 vs. $1,441).
MARKET PERSPECTIVE
The three segments of the WS market (which may apply to different employee classes in a single case):
- In “core” (also known as “core/buy-up”) programs, employers pay for a small amount of coverage for generally a large number of employees. Employees can buy more coverage. “Core” programs generally have low average ages, short benefit periods, low daily maximum benefits and a small percentage of spouses insured.
- In “carve-out” programs, employers pay for robust coverage for key executives and usually their spouses. Generally, executives can buy more coverage for themselves or spouses. Compared to “core” programs, a higher percentage of insureds are married, more spouses buy coverage, the age distribution is older and the average premium is higher.
- In “voluntary” programs, employers pay nothing toward the cost of coverage. The typical coverage is more robust than “core” programs, but less robust than “carve-out” programs. Voluntary programs tend to be most weighted toward female purchasers.
National Guardian, New York Life, and Northwestern write mostly executive carve-out programs, whereas Genworth, LifeSecure, Mutual of Omaha, and Transamerica have significant voluntary and core buy-up business. Because we received statistical distributions from the former but not the latter, our 2020 and 2019 statistical distributions are more representative of the executive carve-out subset of the market.
Because of tax savings, small executive carve-out plans are weighted toward the end of the year. On the other hand, large voluntary cases were traditionally weighted toward fall enrollments with January 1 effective dates. Large voluntary cases are probably more evenly distributed through the year than in the past, but differences remain.
Carrier Changes: MassMutual ceased sales, hence will have, at most, negligible WS sales in 2021. Transamerica ceased accepting new cases at the end of March 2021 and ceased accepting new apps on June 30. However, Transamerica’s sales might be strong in 2021 because some employers sought WS programs in advance of the November 1 deadline in order for employees to qualify to opt out of the Washington Cares Fund tax, as explained below. In 2020, Genworth temporarily ceased sales, but has since resumed. These developments will impact total industry WS sales and change insurers’ market shares as well as the statistical characteristics of WS sales.
The WCF: The State of Washington created the Washington Cares Fund (WCF) through passage of the LTSS Trust Act. In January 2022, the state will begin collecting 0.58 percent payroll tax on wages to fund a $36,500 lifetime pool of money starting in 2025. The pool of money is intended to inflate thereafter according to the WA consumer price index. Coverage applies for vested individuals receiving care in WA and is not portable out-of-state.
The law allows people to opt out of the program and not pay the tax if they purchase LTCI by 11/1/2021. Therefore, 2021 private LTCI sales could be impacted if some people choose to opt out for reasons such as: Intend to retire outside of Washington; believe they will not obtain enough vesting credits; have high wages; want more robust coverage; want to cover unemployed spouses; or want to benefit from the state Partnership program. We understand some employers either instituted WS programs or educated their employees so they could seek individual coverage if appropriate. Even employers outside WA were stimulated to act if they had WA-based employees.
COVID-19: In 2020, most scheduled enrollments were canceled or delayed, and it was obviously not a good time for employers to consider implementing a new WS program.
Enrollments of newly-eligible employees continued in 2020 for existing programs, being performed in web meetings.
Early 2021 was also not a good time for enrollments, due to COVID-19, focus on “re-opening”, continued high unemployment and volatility in the work force.
Pricing Considerations: Most people interpret Title VII of the 1964 Civil Rights Act to require that employer-involved LTCI programs use unisex pricing if the employer has had at least 15 employees for at least 20 weeks either in the current or previous year. Some states apply similar laws to employers with fewer employees. Thus, for WS sales, insurers must create a separate unisex-priced product. The expense of separate pricing, marketing and administration discourages insurers from serving both the WS and NWS markets.
Moreover, insurers fear anti-selection. Because women have higher expected future claims, unisex pricing saves women money compared to gender-distinct NWS pricing, whereas men pay much more for WS than for NWS policies. The higher the percentage of female buyers in the WS, the more unisex pricing is likely to approach sex-distinct female pricing levels.
The recent evolution of couples’ discounts (discussed in our July article) might impact WS programs directly or indirectly.
Because healthy, young, and less affluent people are less likely to buy LTCI, insurers also fear health anti-selection (less-healthy people buying, while healthier people do not buy). Furthermore, because WS programs rarely offer “preferred health” discounts, healthy heterosexual couples may pay more for WS coverage than for corresponding NWS coverage. Therefore, there are few health concessions in the stand-alone WS market at this time. However, some combination products offer guaranteed issue if participation requirements are satisfied.
In the carve-out market, a more expensive WS product can still produce after-tax savings compared to a cheaper NWS policy, because of tax advantages when employers pay the premium.
In addition to health and gender distribution, insurers are also careful about age and income distributions of WS cases they accept. Insurers are more vulnerable to health- or gender-anti-selection if the group has a lot of young or less affluent employees.
Some insurers have raised their minimum issue age to avoid anti-selection (few people buy below age 40) and to reduce exposure to extremely long claims. Such age restrictions can discourage employers from introducing a program, especially a carve-out program if they have executives or spouses under age 40.
To control risk, most insurers will not accept a voluntary WS program if there are fewer than 100 employees. However, one insurer (which offers no health concessions) will accept voluntary LTCI programs with as few as two to five employees buying (minimum varies by jurisdiction).
Availability of coverage: With increased remote work, more employers have employees stretched across multiple jurisdictions and eligible non-household relatives might live anywhere. But insurers are less likely than in the past to offer LTCI in jurisdictions with difficult laws, regulations or practices. So, it can be difficult to find an insurer which can cover everyone unless LTCI is sold on a group chassis and the employer does not have individuals in extra-territorial states.
One insurer no longer offers WS LTCI to non-household relatives. Reduced availability for such relatives does not have much impact on sales, because only about one percent of WS sales are to non-household relatives. However, it undermines the suggestion that WS LTCI programs might reduce the negative impact of employees being caregivers.
Prior to sex-distinct pricing, an executive carve-out for two partners of a company with more than 15 employees could have been serviced by any LTCI company, but now it is hard to find a carrier that offers unisex pricing under such circumstances. Such executives may buy policies with sex-distinct pricing either because they are unaware of the requirement under Title VII of 1964 Civil Rights Act, they are confident that no female will file a civil rights complaint, or they disagree with the interpretation that such policies should have unisex pricing to avoid the risk of a civil rights complaint, etc.
Some employee benefit brokers are reluctant to embrace LTCI because of declinations, the effort of enrollment, certification requirements, their personal lack of expertise, etc. WS sales gain from LTCI specialists forming relationships with employee benefit brokers.
Positive Factors: Despite the above problems, there are positives for the WS market.
As a result of COVID-19, there is increased awareness of the LTC risk and of personal exposure. In addition, there is increased interest in staying out of nursing homes. More workers may have elders living in their homes and, if they are remote workers, the needs of those elders are more likely to interfere with their productivity.
Potential future tax increases would increase the tax advantages of employer-paid premium.
Voluntary WS LTCI sales lack the tax advantages of employer-paid coverage. Therefore, voluntary programs for young and less-affluent groups may gravitate toward products that include life insurance, which is viewed as a more immediate potential need by young employees with families.
As most jurisdictions now permit policies with one percent compounding to qualify as Partnership policies, the WS should be a great venue to serve people who can benefit from state Partnership programs. Two insurers in the WS market currently offer one percent compounding. As explained in the Partnership section, sales of Partnership policies could likely be increased if more insurers offered one percent compounding and if they lowered the minimum monthly maximum for core/buy-up programs with one percent compounding.
Another potentially positive factor is the increased availability of combination products in the WS market. From the perspective of insurers and advisors selling stand-alone LTCI in this market, competition from combination products might be a negative. Furthermore, such combination products may produce relatively little purchasing power during retirement years because the monthly LTCI benefit is constrained to a portion (typically four percent) of the death benefit and because the benefit does not compound. However, combination products should expand the WS market.
Yet another positive are programs which offer free LTC-related services to employees and their families. Regardless of whether the employee is insured or the relative is insurable, they can access information, advice, services and products that make caregiving more efficient, more effective, safer and less expensive. Enabling employees and their families to have better LTC experiences and to use more (not necessarily 100 percent) commercial care should boost productivity at work.
With all of the above changes, it will be particularly interesting to see how 2021 sales develop.
STATISTICAL ANALYSIS
As mentioned earlier, insurers’ sales distributions can vary greatly based on the submarket they serve (for example, in the WS market: core, voluntary or carve-out). Therefore, distributions may vary significantly from year to year due to a change in participating insurers, in distribution within an insurer or in market share among insurers. Policies in the carve-out market are designed similarly to those in the NWS (non-worksite) market. Our sales distributions reflect only about 15 percent of WS policies and certificates issued in 2020 and are mostly representative of the executive carve-out market. For example, one insurer’s average WS case consisted of 5 policies being issued and another averaged 7 policies. One of the 3 insurers sold 61 more policies than it did in 2019, whereas the other two insurers sold about 35 percent fewer policies, which resulted in one insurer comprising 76 percent of the WS sales on which our distributions are based.
Sales and Market Share
Table 1 shows historical WS sales for all insurers reporting sales, including some estimates in 2020. As there are several WS markets and some have long lead times, there may be a lag before competitors can fill in after an insurer drops out.
Table 1 also shows the overall average WS premium compared to the average WS premium for the participants who contributed statistical data beyond sales. As shown in the table, until 2017, our WS statistics likely represented the broad WS market well.
Table 2 shows WS sales as a percentage of total LTCI sales. For the most part, this percentage has stayed relatively level in the past five years and much higher than prior to 2016.
As shown in Table 3, two insurers wrote 60 percent or more of their 2020 new premium in the WS, while the other insurers wrote 15 percent or less of their business in that market. The percentage of each insurer’s new premium that comes from WS sales did not change dramatically from 2019 to 2020.
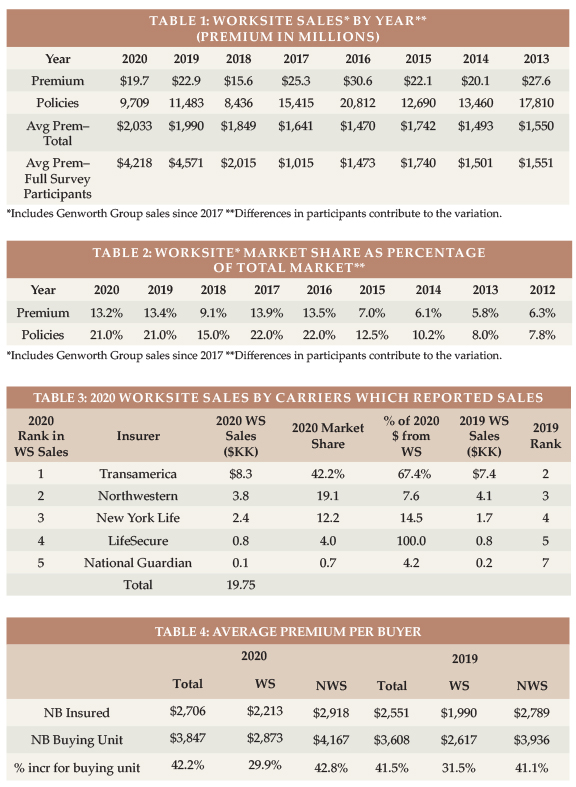
Average Premium Per Buyer
Table 4 shows that, in 2020, the NWS average premium per buying unit (a couple comprise a single buying unit) was 42.8 percent higher than the average premium per insured. This dropped to 29.9 percent for WS sales, because more WS buyers are single and because spouses are less likely to buy in the WS. The average premium per new insured (NB Insured) reflects all participants, but the average premium per buying unit is determined solely by the participants who report sales based on marital status. The WS ratio is probably overstated because participants who reported premium by marital status for the WS are not characteristic of the entire market.
Issue Age
The balance of the statistical presentations are not representative of the entire WS market as explained above. We report the results we have available, though we urge you to be selective in how you use the data.
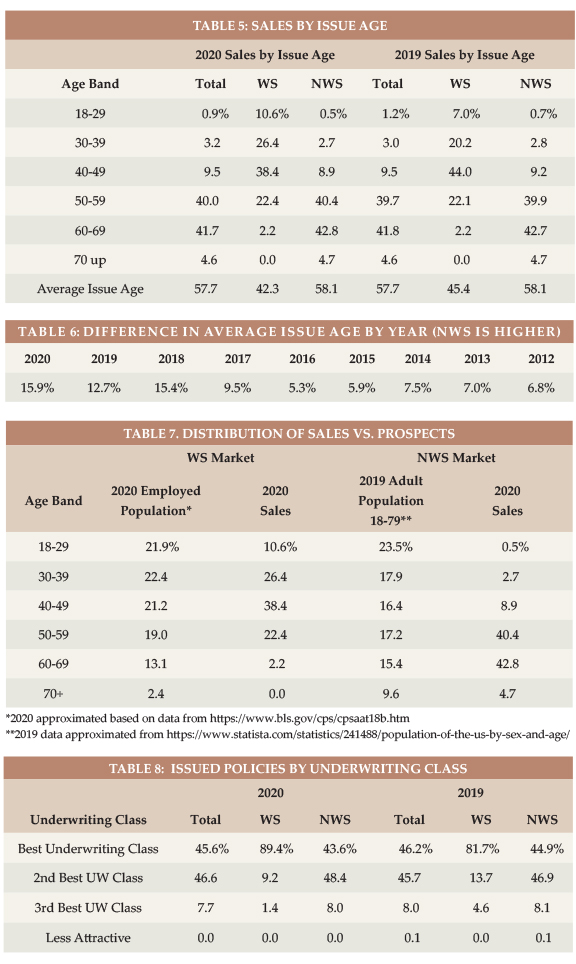
Not surprisingly, Table 5 shows the WS market is much more weighted to the younger ages, even with data that is disproportionately weighted to executive carve-out programs. The total industry average age and the NWS average age both rounded to the exact same age as in 2019. The WS average fell a bit.
Table 7 displays the relative age distribution of the workers ages 18+ to purchasers in the WS market and all adults 18-79 to purchasers in the NWS markets. In the WS market, the LTCI industry is particularly successful selling to ages 30-59; ages 40-49 represent 38.4 percent of sales but only 21.2 percent of employees. In the NWS market, the industry is particularly successful with 50-70 year-olds.
Rating Classification
Most WS sales are in the “best” underwriting class (see Table 8) because there generally is only one underwriting class. Insurers often do not get enough information in WS to determine whether a “preferred health” discount could be granted and use the additional revenue (from not having a “preferred health” discount) to fund extra cost resulting from gender or health anti-selection. Carve-out programs are more likely to offer a “preferred” discount, which means a higher percentage of carve-out policies are issued in the second-best underwriting class. The percentage of policies issued in the best underwriting class dropped in the NWS market in 2020 from 44.9 to 43.6 percent. However, it was higher than in either 2018 (43.1 percent) or 2017 (40.5 percent). Meanwhile the percentage in the WS market increased from 81.7 to 89.4 percent, partly due to a change in market share among insurers. The 2020 WS was lower than in either 2018 (93.9 percent) or 2017 (91.9 percent), but in 2017-18, our data included more large group business with significant health concessions.
Benefit Period
The WS average benefit period is low for core/buy-up programs and somewhat low for voluntary programs. Executive carve-out programs sometimes have longer benefit periods than the NWS market. Our 2020 WS and NWS average benefit periods are similar, with WS having significantly more two-year benefit periods this year. Last year, the average benefit period was the same in the WS and NWS markets.
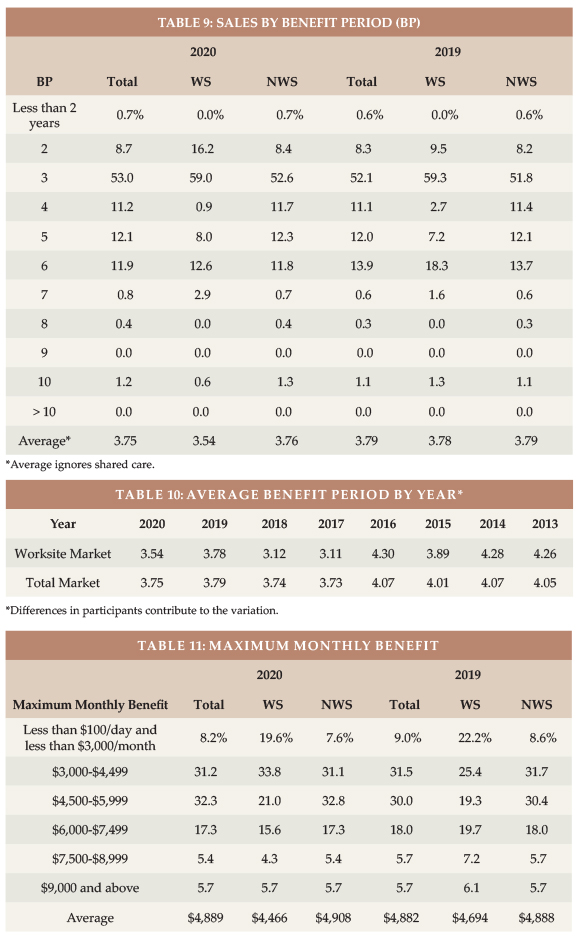
Table 10 shows corresponding data back to 2013. As noted elsewhere, this data can jump around based on which insurers provide such detail and whether large core/buy-up cases are written in a particular year.
As discussed later, the WS market issues much less Shared Care.
Maximum Monthly Benefit
Even with a lot of executive carve-out business, Table 11 shows that the WS market has many core programs sold with a $50/day or $1500/month initial maximum benefit. In 2020, both the WS and NWS markets had more business concentrated between $3,000 and $5,999 initial monthly maximums.
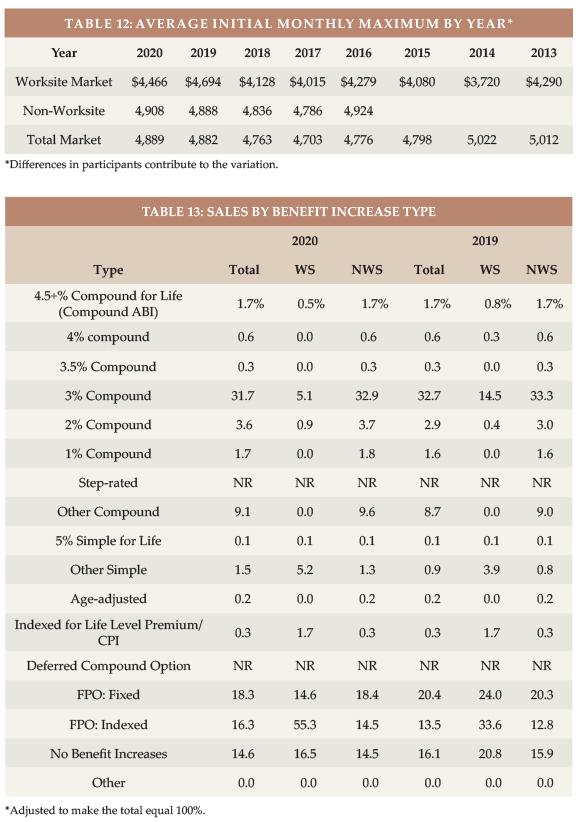
Table 12 shows that the WS initial monthly maximum has varied more over time than the whole market, because of participant changes and how many core/buy-up plans were sold in a particular year.
Benefit Increase Features
As shown in Table 13, the WS market has more future purchase options (FPO), because of its core programs. The high indexed FPO WS percentage is caused by a change in carrier market share based on policy count.
Both the NWS market (15.9 to 14.5 percent) and the WS market (20.8 to 16.5 percent) saw decreases in the percentage of policies sold with no benefit increase feature.
Future Protection
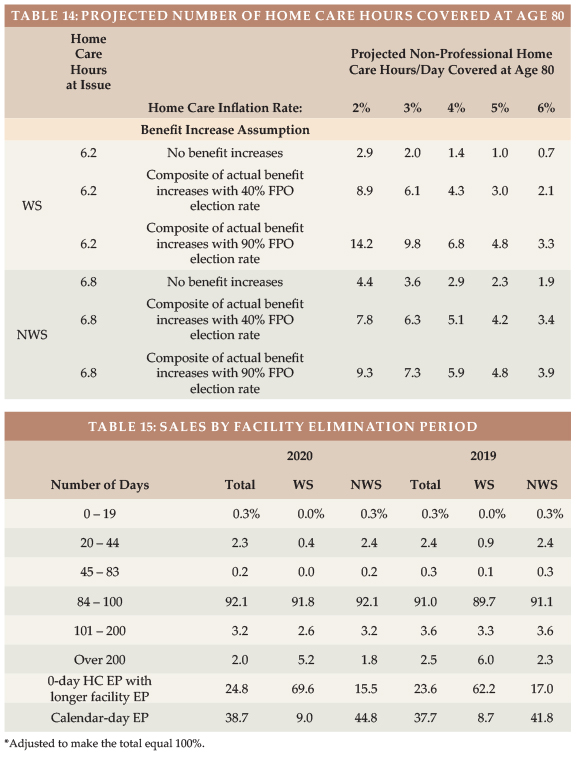
Based on a $24/hour cost for non-professional personal care at home ($24 is the median cost according to Genworth’s 2020 Cost of Care Survey), the average WS initial maximum daily benefit of $148.90 would cover 6.2 hours of such care per day at issue, whereas the typical NWS initial daily maximum of $163.60 would cover 6.8 hours of such care per day, as shown in Table 14. This year’s higher cost (the hourly cost was $23 in 2019) contributed to the decrease in the number of initial covered hours from 6.8 (WS) and 7.1 (NWS) last year.
The number of future home care hours that could be covered depends upon when care is needed (we have assumed age 80), the home care cost inflation rate between now (age 42 for WS and 58 for NWS) and age 80 (we have calculated with two, three, four, five and six percent inflation), and the benefit increases provided by the LTCI coverage between now and age 80.
Table 14 shows calculations for 3 different assumptions relative to benefit increase features:
- The first line presumes that no benefit increases occur (either sold without any benefit increase feature or no FPOs were exercised).
- The second line reflects the average benefit increase design using the methodology reported in the July article, except it assumes that 40 percent of FPOs are elected (intended to be indicative of “positive” election FPOs, in which the increase occurs only if the client elects it) and provide five percent compounding.
- The third line is like the second line except it assumes 90 percent of FPOs are elected (intended to be indicative of “negative” election FPOs, in which the increase occurs unless the client rejects it). It also assumes the FPOs reflect five percent compounding.
Table 14 indicates that:
- Without benefit increases, purchasing power deteriorates significantly, particularly for the WS purchaser because there are more years of future inflation for a younger buyer. With four percent inflation and no benefit increases, the number of covered hours of home care at age 80 dropped from 1.8 in 2019 to 1.4 in 2020 for the WS market and from 3.0 in 2019 to 2.9 in 2020 for the NWS market.
- The “composite” (average) benefit increase design assuming that 40 percent of FPO offers are exercised preserves purchasing power better than when no increases are assumed, but still generally leads to significant loss of purchasing power. The exceptions: both WS and NWS purchasers gain a bit of purchasing power if the inflation rate is only two percent (with a 40 percent FPO election rate, the composite is greater than two percent compounding). With three percent inflation, the NWS clients gain purchasing power but the WS clients lose a slight bit of purchasing power.
- With 90 percent FPO election rates, the average WS buyer would experience increased purchasing power with four percent or less inflation but would lose purchasing power with five percent or more inflation. The average NWS buyer gains purchasing power with three percent or less inflation but loses purchasing power with four percent or more inflation.
Table 14 also underscores the importance of considering future purchasing power when buying LTCI. Please note:
a) The average WS buyer was 16 years younger at issue, hence has 16 more years of inflation and benefit increases in the above table. The effective inflation rate to age 80 is not likely to be the same for 42-year-olds versus 58-year-olds purchasing today.
b) WS sales have more FPOs, so WS results are more sensitive to FPO election rates.
c) Results vary significantly based on an insured’s issue age, initial maximum daily benefit, and benefit increase feature, as well as the inflation rate and the age at which the need for care occurs.
d) By the median age of starting to need care (about age 83) and the median age of needing care (about age 85), more purchasing power could be gained or lost.
e) Table 14 does not reflect the cost of professional home care or a facility. According to the aforementioned 2020 Genworth study, the average nursing home private room cost is $290/day, which is currently comparable to 12.1 hours of non-professional home care. However, the inflation rate for facility costs is likely to differ from the inflation rate for home care. From 2004-2020, Genworth’s studies showed the following compound growth rates: private room in a nursing home (3.1 percent), assisted living facility (3.7 percent), home health aide (1.6 percent), and home care homemaker (2.2 percent).
f) Table 14 could be distorted by simplifications in our calculations. For example, we assumed that the FPO election rate does not vary by age, size of policy or market and that everyone buys a home care benefit equal to the average facility benefit.
Partnership Program Background
When someone applies to Medicaid for long-term care services, most states with Partnership programs disregard assets up to the amount of benefits received from a Partnership-qualified policy (some IN and NY policies disregard all assets). Partnership programs exist in 44 jurisdictions (all but AK, DC, HI, MA, MS, UT, and VT), but MA has a somewhat similar program (MassHealth). The first four states to develop Partnerships (CA, CT, IN and NY) have different rules, some of which have become a hindrance to sales. We are not aware of a Partnership-qualified WS LTCI product in those states, which is unfortunate because the WS market serves many people who could benefit from Partnership.
To qualify for a state Partnership program, a policy must have a sufficiently robust benefit increase feature. Many jurisdictions have lowered the minimum Partnership-eligible compounding benefit inflation rate to one percent. To facilitate Partnership sales in such jurisdictions, an insurer could lower its minimum size by 1/3 (e.g., from $1500 to $1000) if one percent compounding is included in a core program. The revenue from the core program would typically increase. The premium would be more level by issue age, shifting risk to the younger ages which is preferable for the insurer in a core program.
Jurisdictional Distribution
Broker World’s website (Click here) has a chart of the market share of each US jurisdiction relative to the total, WS and NWS markets, and the Partnership percentage by state. This chart indicates where relative opportunity may exist to grow LTCI sales.
Elimination Period
More than 90 percent of the NWS market buys 90-day elimination periods (EPs). For that reason, many WS programs offer only a 90-day EP. Yet, probably because we lack data for some insurers which sell almost entirely 90-day WS EP, our WS data shows many more WS policies with 180-day or longer EPs (7.8 percent) than in the NWS market (5.0 percent).
Table 15 also shows how many policies had a 0-day home care feature and a longer facility EP and how many policies had a calendar-day EP (as opposed to a service-day EP). We have reflected that all LifeSecure policies are 90-day EP with a calendar-day definition and all Transamerica sales have 0-day home care EP. Policies which have 0-day home care EP, but define their EP as a service-day EP operate almost identically to a calendar-day EP.
The significant differences in 0-day home care EP and in calendar-day EP by market reflect specific insurers’ design preferences; they do not appear to be driven by the market.
Gender Distribution and Sales to Couples and Relatives
Insurers began sex-distinct LTCI pricing in 2013, but, as explained above, unisex pricing continues in the WS market. The 2013-2015 percentages of females in the NWS market were high as insurers which still offered unisex pricing attracted single females.
In the past five years, the percentage of female buyers in the NWS has been stable, fluctuating from 54.3 to 54.9 percent.
From 2015-2018, the high percentage of WS buyers who are female suggested that women were particularly attracted to voluntary WS LTCI (presumably because of unisex pricing). Our WS results are heavily distributed to executive carve-out programs, and many executive carve-out programs cover spouses.
The low 2019 percentage of female sales in the WS was mostly attributable to a drop in female sales for a major insurer. That insurer’s percentage of female sales bounced partly back in 2020.
In 2020, women constituted 50.5 percent of the USA age 20-79 population1, but a slightly higher 54.3 percent of total LTCI purchases. Women were only 46.8 percent of workers2 but accounted for 53.9 percent of WS sales.
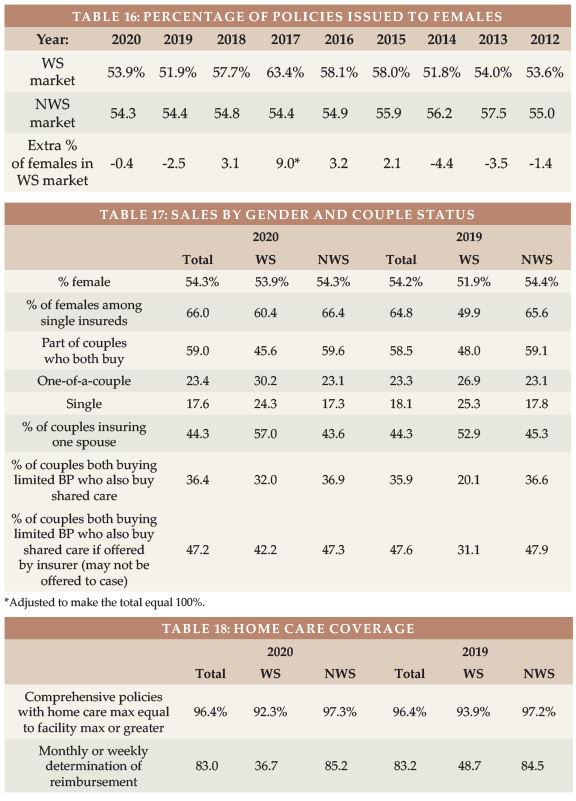
Table 17 digs deeper, exploring the differences between the WS and NWS markets in single female, couples and Shared Care sales.
It shows that the bounce-back in female sales at the WS was primarily among single people. Insuring one spouse became more common in the WS market, but when both spouses were insured, Shared Care became more common. Shared Care is less common in the WS market because it often is not offered and because spouses often don’t buy. Also, executive carve-out programs may feel that insuring spouses favors married personnel and that adding Shared Care does so to an undesirable degree.
The NWS market saw a shift to more couples-both-buying sales, but among sales to single people, the percentage of females increased.
Our limited data with regard to relatives who buy shows that two spouses are insured for every three employees. That’s a high percentage reflective of executive carve-out data. Only about one percent of purchasers are relatives other than the employee and employees’ spouses.
Type of Home Care Coverage
Table 18 summarizes sales by type of home care coverage. Historically, the WS market sold few policies with a home care maximum equal to the facility maximum. But with increasing emphasis on home care and simplicity, that difference faded. Yet, in 2020, there was a small drop in WS sales with a 100 percent home care benefit.
Table 18 also shows that monthly determination dominates the NWS market, but daily determination still dominates the WS market. The particularly low 2020 monthly determination percentage in the WS was caused primarily by a change in distribution of WS sales among participants.
Many WS products embed a “partial cash alternative” feature (which allow claimants, in lieu of any other benefit that month, to use approximately 1/3 of their benefit for whatever purpose they wish, with the balance extending the benefit period) or a small informal care benefit.
Other Features
Table 19 suggests that Return of Premium (ROP) became more common in the WS market in 2020 but a bit less common in the NWS market. In each market, the percentage of ROP features actively chosen by purchasers increased. The percentage of ROP riders that expire increased even though embedded ROP almost always expires. ROP with expiring death benefits can provide an inexpensive way to encourage more young people to buy LTCI but may not provide a meaningful benefit.
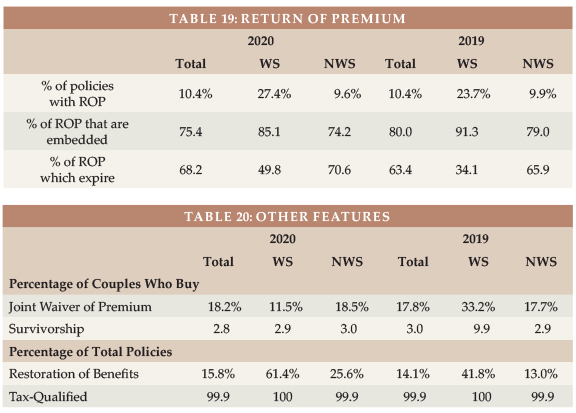
Table 20 shows significant drops in WS sales of Joint Waiver of Premium and Survivorship to couples, but and a significant increase in Restoration of Benefits (ROB). These changes are significantly related to changes in market share by insurer. All WS sales are tax-qualified. Our 2019 percentages are corrected in Table 20.
CLOSING
We thank insurance company staff for submitting the data and responding to questions promptly. We also thank Sophie Fosdick, Margaret Liang, Nicole Gaspar, and Alex Geanous of Milliman for managing the data expertly.
We reviewed data for reasonableness. Nonetheless, we cannot assure that all data is accurate.
If you have suggestions for improving this survey, please contact one of the authors.
References
- https://statisticstimes.com/demographics/country/us-sex-ratio.php#:~:text=Gender%20Ratio%20in%20the%20United%20States%20in%202020%20is%2097.948,to%2049.48%20percent%20male%20population.
- Bureau of Labor Statistics, https://www.bls.gov/cps/cpsaat11.htm.