This article is somewhat of a meshing of my last couple of monthly columns. In one article I discussed the economics and the “internal rates of return” by delaying your Social Security benefits. In another article I discussed indexed annuity GLWBs versus the old four percent rule. This article is bringing both concepts together—GLWBs and internal rates of return.
First, what is a GLWB? Quite simply, a GLWB is a rider that attaches to an annuity that allows for the client to continue to receive income from that annuity beyond the point where the accumulation value (the consumer’s money) hits $0. Without a GLWB, the alternative may be that the consumer lives so long that they spend all of their money and are left with no income from that point forward. GLWBs are “longevity insurance” that can be attached to a base annuity, usually for an additional fee. That additional fee may be one percent of the “Income Value/Benefit Base” for example. The consumer’s withdrawals under the provisions of the GLWB go on for as long as the consumer lives. Now, obviously that doesn’t mean the consumer can choose whatever level of income they would like! There are maximums that are specific to the company, the product, the amount of time the consumer defers payment, and the age that the consumer is when he/she elects to activate “lifetime income.” The economics of those GLWB maximums is what we are assessing in this article.
With interest rates increasing the way they have, GLWBs have better “economics” than what they had just one or two short years ago. As a matter of fact, the guaranteed income from these GLWBs dwarf the “safe withdrawal rules of thumb” that I discuss in previous articles. However, although it sounds good to say “GLWBs will generally pay out higher income than the four percent rule,” what does that mean? What kind of returns are GLWBs expected to give consumers over a normal lifetime in exchange for that one percent or so rider fee? Are they more sizzle than steak?
The benefits that GLWBs provide to consumers are highly dependent on how generous the carrier is with pricing their GLWBs, along with a ton of other “macro” items like interest rates, consumer longevity, etc. At any one point in time, the carriers are all dealing with the same macroeconomic environment and consumer longevity. But even with that being the case, some carriers have great GLWBs, some have lousy GLWBs, some carriers do not even offer GLWBs.
My company’s job as an IMO/FMO is to identify the carriers that have great GLWBs for my agents among other things. But even if that “best” carrier is identified, the attractiveness of their GLWB can vary from situation to situation. Some carriers may have their GLWB priced the best for consumers that start their income at older ages, or younger ages, or the consumers that delay taking income the longest, or scenarios where the husband and wife want “joint income,” etc.
Think of term life insurance. There are carriers that usually have the lowest prices on term life insurance in general. However, within those top carriers, some carriers may focus on the “smoker” niche. Some may focus on the “Super Preferred” niche. Some may stand out relative to their peers with substandard health ratings. The list goes on. Many of us have seen term insurance “heat maps” where the best carriers for a bunch of different ages and situations are mapped out. Finding the right GLWB for your consumers is very similar. The following analysis is just the tip of the iceberg in what we can look at with GLWBs, but I think it does an adequate job of addressing the three goals of this article:
- What are the “economics” to the consumers of GLWBs?
- How can GLWB pricing vary from carrier to carrier?
- Even if we identify a “favorite carrier,” how does the GLWB attractiveness vary from scenario to scenario?
I have done research on several GLWBS. However, in order to keep this article digestible, I am only going to use a couple different examples.
One of the top products that my company offers is a product that has 10 percent simple rollups until the client activates their income. At that point in time, the “benefit base” stops receiving the 10 percent rollups and the client gets a percentage (payout factor) of whatever the benefit base is. Naturally, the fact that the benefit base is increasing year after year means that the consumer is rewarded with higher GLWB payments the longer he delays. Plus the payout factors increase with age as well, which is the case with most GLWBs. The flipside is, every year that the consumer delays is one year less that they will be taking income because they are one year closer to their death. That sounded morbid, didn’t it? So, the million dollar question is, do the increasing payments outweigh the fact that for every year that goes by, you shave off one year of income? This is where it comes down to internal rates of return and finding the product’s sweet spot. A lot like what I did with my previous Is Delaying Social Security Worth It? article.
Let’s say we have a 60-year-old male that is retiring this year. With $100,000 he is looking for income that will supplement his Social Security payments that he will get eventually. He has plenty of other money but he would like a guaranteed baseline of income that he will have for the rest of his life. Because he has other money, he has the freedom to take the GLWB income now, or delay. Whatever makes the best financial sense. So, you run the illustration on the product that I just mentioned. On the illustration, that product will show you (and him) the levels of income that he is guaranteed if he were to activate the GLWB at various ages. For this product, those numbers are represented in my green bars.
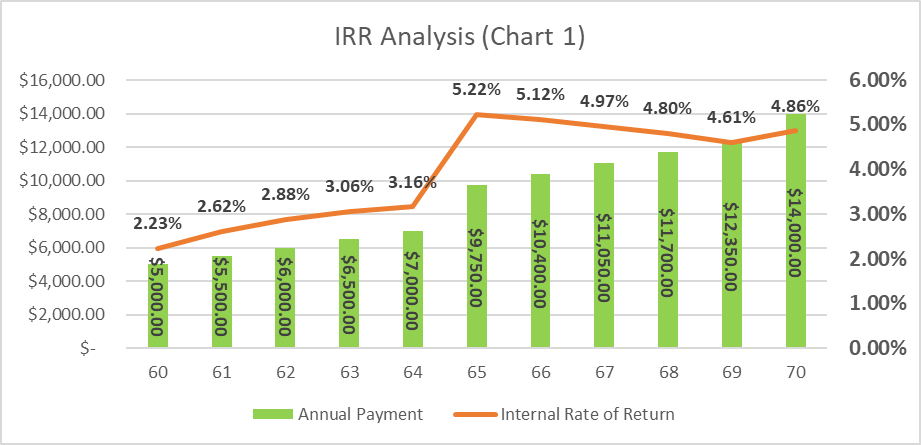
Those green bars indicate that if he wants to take income immediately, he is guaranteed $5,000 per year for the rest of his life. If he waits five years, he gets $9,750 per year. (Note: How are these numbers versus the four percent rule? I discussed that in last month’s column.)
The most interesting part of the graph is the red line. The red line represents the internal rate of return on his $100,000 premium if he chooses income at those respective ages and lives until his approximate life expectancy of age 85. For example, if he were to take his $5,000 income immediately and have that income until age 85, that is only a 2.23 percent internal rate of return. Not real great! Conversely, if he were to wait until age 65 to start taking income, you are now talking about a 5.22 percent internal rate of return. Not a bad bond alternative! To really take the scenario to the extreme, if he were to live until age 100, his IRR would be 6.79 percent.
Notice how the IRR spikes up if he delays five years instead of four years? That is because the payout factor on this product is banded at every five years and thus shoots up at age 65, age 70, etc. In other words, if our guy came to me and said he wanted to start taking income at age 64, I would be inclined to encourage him to wait an extra year.
Also note, I have seen people want to start taking income on the “contract anniversary,” without paying attention to anything else. Pay attention to ages and if there will be a birthday soon that would significantly bump up his payout factor. If so, it would behoove him to wait to get the higher payout factor!
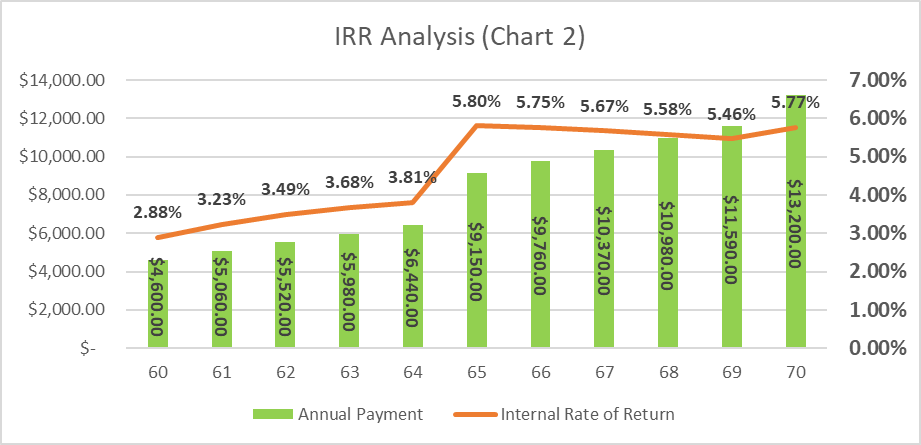
What if he wanted “Joint Income” with his spouse that is the same age? The second chart represents the same product, just a different IRR Curve. This assumes the second spouse will “unalive” at age 92.
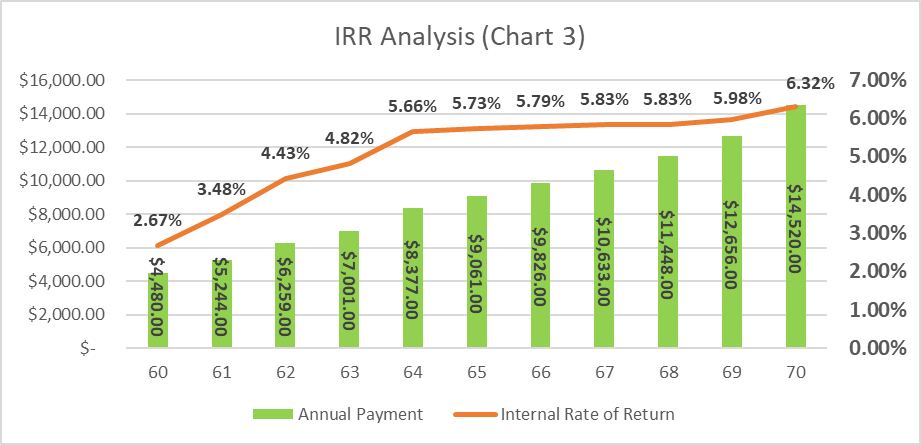
Now check out the next product that is completely different with a different carrier. If my couple has the additional money that allows them to defer taking income from this annuity for 10 years—until age 70—I would likely recommend this one. By delaying until age 70, they are looking at an IRR of 6.32 percent, assuming the income stops at age 92. This is a great “Joint Income Later” product that is priced at a whole 50 basis points higher than some of the other ones I have seen.
It is interesting to see the different shapes of various carriers’ IRR curves and how they price their products. Of course, there are calculators that I use that tell my agents the highest paying products for each scenario, but it is interesting putting the numbers into IRR context and comparing that to the yields that carriers are getting on their investments today.
It also raises a lot of carrier actuarial questions such as:
- What life expectancy assumptions are carriers using? Is the 6.32 percent IRR so high only because the carrier expects everybody to die sooner than the other carriers?
- What about lapse assumptions? If everybody cashes out their policy at the end of the surrender period, then the IRRs are a moot point. Remember the variable annuity carriers “buying out” the clients with GLWBs? This is because the IRR analysis was too high for the carriers to support paying out.
- Future interest rate assumptions?
- Assumptions on accumulation value growth? Afterall, a GLWB can be a moot point if consumers never ran out of their accumulation value because of stellar performance.
With scores of GLWB carriers out there and all of the possible scenarios that each GLWB can have, there are thousands of different scenarios that we can choose. By giving you a sample of a few, I hope this article at least demonstrates how every carrier and every product can vary in attractiveness depending on the exact situation. Partner with an IMO that understands the nuances.
If we wanted to get even more complicated, we could use the IRR analysis of these GLWBs in conjunction with the IRR analysis on delaying Social Security! If we only had the financial flexibility to delay taking income from one of those two sources, which one would I take income from first, Social Security or the GLWB? It depends on the IRR tradeoffs between the two…