In part one we discussed the differences between traditional fixed UL and IUL—with UL the general account yield generates an interest credit to the client, whereas with IUL the general account yield is instead used as a call option “budget.” We also discussed the expenses within UL and IUL. With this column we dive into the details about the call options strategy that is purchased with the options budget.
Hypothetical Product Design
The most prominent FIA and IUL design is an annual reset, point to point, with a cap design. Meaning, if a product has a cap of 10 percent on an IUL and the market goes up five percent over a year, the client gets a credit of five percent. If the market goes up 15 percent over a year, the client gets a credit of 10 percent. If the market plummets 40 percent, the client gets a zero percent credit. Of course, with all these scenarios the “big three” of expenses is deducted as well. This product design is what I use in my explanation below.
With this structure, carriers typically do not just buy call options in order to give the client those product attributes. Rather, they buy and sell call options. The “buying and selling” of call options is the bull call spread strategy that I will discuss in a bit. But first, let’s discuss options in general.
Options Explained
Options are a subcategory of derivatives. Derivatives are contracts whose value depends on an underlying asset. Examples of derivatives are futures contracts based on oil, collateralized debt obligations based on company debt, and call options based on a company’s stock or an index. In other words, the value of “derivatives” is “derived” by an underlying asset. The derivatives that we want to focus on in this column are call options on the S&P 500 Index.
The definition of a call option is: The right but not the obligation to buy an underlying asset at an agreed upon price (Strike Price) by a certain point in time (Maturity Date). With indexed annuities and IUL, that “asset” is usually the S&P 500. (Note: There are many indices that can be used in indexed product designs. There have also been many new volatility-controlled indices that have come to market. However, the S&P 500 is the focus of this column because of simplicity and prominence.)
Options are also generally separated by American style call options and European style call options. The style that is most prominently used with IUL is the European style that can only be exercised when the option matures. Naturally, if the IUL product the carrier is hedging is an annual reset design, then that carrier would buy (and sell) options with a one year maturity.
So again, with a one year maturity, at the end of that one year period the options expire worthless (if the market is flat or drops) or worthwhile (if the market increases and the option is exercised). Our $430 that the carrier is allocating to the options strategy can be 100 percent decimated if the market drops. This is why options are extremely risky. The tradeoff is, however, that options have huge upside leverage that allows the carrier to take only $430 to link the client’s entire $10,000 to the S&P 500. Below I explain more.
What in the World is a “Bull Call Spread?”
First the carrier needs to purchase a call option that will give the client’s $10,000 the upside of the S&P 500.
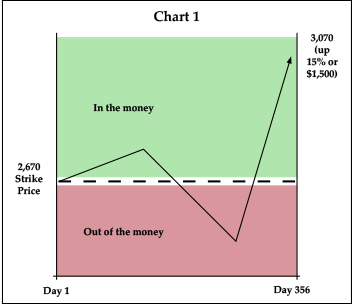
Well, based off the S&P 500 being at 2,670 today as well as the pricing characteristics of call options today (strike price, volatility, interest rates, etc.), a call option on a “notional value” of $10,000 will cost the carrier seven percent or $700**. By purchasing this call option on a notional value of $10,000, this means that if the S&P 500 goes up 15 percent, per the example in chart 1, then the company would get $1,500 to pass through to the client. By the way, a $1,500 gain on only $700 in options demonstrates the huge upside leverage that options have. Furthermore, if the market went up 20 percent or 30 percent, then the option purchaser (carrier) could get a relatively massive $2,000 or $3,000 gain respectively. Again, however, the tradeoff is that with options you also have a relatively high probability of losing all your $700, i.e. the mudhole.
Remember that the agreed upon price that we would buy the asset (S&P 500 in this case) for is called the “strike price” and when the asset/index moves above that strike price it is considered “in the money.” You can also see above why volatility affects option prices. If the market never deviated from the dotted “strike price” line, then there would never be any payoff to the carrier nor risk to the investment bank. Thus the bank would sell the option cheaply. However, when the market zigs and zags is when it is more possible to end up “in the money.” Hence, higher option costs with higher volatility.
In our example the S&P 500 finished the year “in the money” by 15 percent. This means the carrier could get $1,500 from the investment bank. This is a good thing!
However…
At this point I know what you are thinking: “But the above is impossible because the carrier does not have an options budget of seven percent or $700! The carrier only has 4.3 percent or $430 to spend on options!” You are correct! Therefore, the carrier would actually do a second trade in addition to the original options purchase. This is where the carrier needs to sell an option back to the investment bank to “net out” to a total cost of $430 or 4.3 percent. Before we go there, let’s discuss “strike prices” some more.
The fact that we bought the S&P 500 index with a strike price of 2,670 means that we bought an “at the money” call option. Naturally, with call options, the lower the strike price, the more expensive it would be. To exaggerate, if we were to buy a call option on the index at a strike price of $5,000 (almost double the current index level) it would not cost $700 because the chances of the S&P 500 almost doubling over the next year is next to nothing. Therefore, that option would cost almost nothing because it is of no risk to the counterparty (investment bank) and is also of little value to the purchaser (insurance carrier). So, the higher the strike price, the cheaper the option; the lower the strike price, the more expensive the option.
So now that the carrier purchased the option in the above diagram that is 2.7 percent (seven percent minus 4.3 percent) beyond their options budget, the carrier needs to dial in at what strike price they should sell a call option. To put in accounting terms, they have a debit of $700 and now they need a credit of $270 to arrive at the options budget.
The higher the strike price the better from an IUL cap standpoint, because the strike price on the option the carrier sells is what determines the cap! Yet the higher the strike price, the less the credit is to the carrier to get down to the option budget. Where is that magical intersection we are looking for? In order to keep the math simple let’s assume it is 10 percent. That is, the strike price on the option we will sell is 10 percent “out of the money” per chart 2. This means that we sold an option with a strike price that was 10 percent higher than the current index level. Because the carrier is effectively not participating in any index return beyond the strike price on the option they sold, 10 percent is the cap on the IUL. Voilà! The product is now fully hedged!
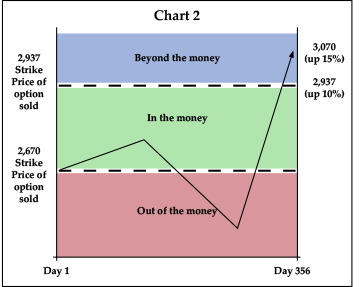
In summation, by our hypothetical carrier buying an option (at the money) for seven percent and selling an option (10 percent out of the money) for 2.7 percent, the net cost is their option budget of 4.3 percent. This is how carriers arrive at IUL and indexed annuity caps. Albeit, the math with indexed annuities is slightly different as we will discuss.
(Note: Technically, based off today’s option prices, a 4.3 percent option budget will buy a cap slightly less than 9 percent. I used 10 percent for simplification. Furthermore, the options budgets vary by carrier and could be greater than my hypothetical 4.3 percent.)
Just for fun: What if the carrier instead sold a 15 percent “out of the money” option in order to provide a high 15 percent cap to the IUL purchaser? In this case the carrier of course would still purchase the $700 call option but at what price would they sell the 15 percent out of the money option? Only around one percent! Remember, with call options the higher the strike price the cheaper the option. Thus, this product design would cost the carrier almost six percent (seven percent minus one percent), which is obviously way beyond their 4.3 percent option budget.
With my example shown in Chart 1 and Chart 2 you may be thinking: “Could a carrier subsidize the options budget by imbedding additional expenses into the policy so they could offer a higher cap like the 15 percent example in Chart 1?” The answer is, to a certain extent they can. For example, there have been many innovative product features that have come to the market such as interest multipliers. These can effectively work like higher caps and many times are subsidized by higher policy charges. (Note of caution: There are, however, product and illustration regulations that put limits on what carriers can do with the creativity around product and the illustrations. This speaks to the notion that these are non-securities products. If a carrier gets too out of hand with loading up expenses to subsidize the options budget in order to get the consumers massive upside, the product will get into “securities” territory with the regulators.)
Static Hedging Versus Dynamic Hedging
A very brief note on static hedging versus dynamic hedging. What I just explained was static hedging and not every carrier does this, although I believe most of them do. Some may do both static and dynamic hedging.
In last month’s column I discussed how I love shooting precision rifles. The problem with high powered rifles is the cost of ammo. It costs a lot of money to buy precision ammo and it still is not “customized” to your firearm. So years back I said, “Why should I pay somebody to do what I can do myself when I can do it even better?” So, I bought the ammo presses, dies, the projectiles, etc., and I started making my own ammo. I have saved money over the years and I have also been able to customize my ammo.
Some carriers feel the same way about their hedging as I do about ammo. These carriers might say, “What can the investment bank do that I cannot do?” and hedge the indexed products themselves without the bull call spread. This is called dynamic hedging. When a carrier buys and sells the options like I’ve related, that is “static hedging.” There are positives and negatives to both.
Why the Difference in IUL and Indexed Annuity Caps?
Many people have asked me how IUL policies are able offer double digit caps while annuity products are offering four to six percent on the design we discussed. The primary reasons are:
Usually IUL is priced as a “portfolio rate” product where the blended general account yield is what determines the pricing. Conversely, indexed annuities are typically priced with “new money” interest rates. This allows for more yield “horsepower” to be available for IUL than with indexed annuities because, as we discussed, new money has been paying less than general account portfolios. This may change when interest rates start increasing.
IUL carriers don’t depend as much on the general account “spread” as indexed annuity companies do because of the expense levers that IUL companies have. This means generally higher call option budgets for IUL.
Because of the longer duration nature of IUL it is easier for the carriers to “wait out” interest rate slumps relative to annuity carriers.
General Account Yields Continue to Decline
As we have discussed, when a client sends the insurance company a premium check for a life insurance policy the insurance company backs that life insurance liability by purchasing assets within their general account portfolio. Over time these insurance companies accumulate billions of dollars of these assets in various securities. Per Milliman, at the end of 2015, US Life Insurers’ general accounts consisted of 76 percent bonds on average, of which a large majority were investment grade corporate bonds.*
It’s not breaking news that life insurance carriers (and everybody else) have seen 37 years of dropping yields on bonds. Because of these persistent low interest rates, insurance carriers have been forced to reprice their annuity and life insurance products many times over. This is because of the resulting decreases in general account yields. To put numbers to it: At the end of 2007 the general account yield for US life insurance focused insurance companies was 5.72 percent. Only eight years later (end of 2015) that yield had dropped to 4.59 percent.* Thus, it is no mystery why caps on IUL have decreased. As a matter of fact, if you were to do our IUL math today based off of the 2007 general account yield of 5.72, you would see that caps would be in the neighborhood of around 3.5 percent higher today, all else being equal. Very substantial!
Of course, the general account yield is the “weighted average” of all the yields of the securities the insurance company has in inventory. As the bonds that the carriers bought say 15 years ago mature and are replaced by new lower yielding bonds, the company’s general account yield continues to get watered down. Here is a simplified example of the current conundrum insurance companies are fighting: If an insurance company’s general account has a “blended yield” of 4.5 percent and this year has $20 million in bonds from 15 years ago that are maturing, they must reinvest that $20 million in today’s low rate environment. The yield on the bonds that are maturing could very easily have been seven percent. It does not take a mathematician to understand that unless you replace those “old” seven percent bonds with “new” seven percent or greater bonds, the general account yield is going to continue to be watered down. So, interest rates could actually rise from here and it still would not stop the yield compression for insurance carriers.
The silver lining: There will eventually be a point of “equilibrium” where the general accounts no longer yield less than the new investments put into the general account. I am hoping we are close to that point as the Moody’s Aaa yield is not much lower than the average general account yield. The Moody’s Baa yield is actually above five percent, which is more than the average general account yield of 4.59 percent.
Dropping general account yields is not just an IUL problem, this is a term problem (increasing prices), this is a GUL problem (increasing prices), this is a whole life problem (decreasing dividends). In the end, the value of all these products is relative to what else is out there, and the value is still unquestionable. After all, prevailing interest rates have also dropped the rates of savings accounts, certificates of deposit, money market accounts, etc.
Insurance companies are faced with an unprecedented 37 year dropping interest rate environment and as a result they have been forced to adjust the pricing on policies as well as discontinue products. Not because they wanted to, but because they have had to.
In Closing
The magic that these products provide, whether life insurance or annuities, lies in the mortality and longevity credits. With life insurance, if one dies prematurely, there are thousands of other insureds in the insurance pool that pay for the death benefit of the deceased that could equal multiples of the premium the insured paid. Ben Feldman would discuss that with life insurance you can purchase “dollars with pennies.” With annuities you have the opposite: If you live until the ripe old age of 110, those in the “pool” that passed away early bought the “longevity credits” that guarantee you lifetime income.
Mortality and longevity credits are what make these products special. By the way, the potential tax benefits of life insurance and annuities are kind of nice as well!
References:
*Milliman: Investment strategies of US Life Insurers in a low interest rate environment.
** https://www.barchart.com/stocks/quotes/$SPX/options?expiration=2020-01-17)