The 2023 Milliman Long Term Care Insurance Survey, published in the July issue of Broker World magazine, was the 25th consecutive annual review of long term care insurance (LTCI) published by Broker World magazine. It analyzed product sales, reported sales distributions, and detailed insurer and product characteristics.
From 2006-2009, Broker World magazine published separate group LTCI surveys, but discontinued those surveys when the availability of group LTCI policies shrank. In 2011, Broker World magazine began this August annual analysis of worksite (“WS”) sales to complement the July overall market analysis.
The WS market consists of individual policies and group certificates (“policies” comprises both henceforth) sold with employer support, such as permitting on-site solicitation and/or payroll deduction. If a business owner buys a policy for herself and pays for it through her business, participants likely would not report her policy as a WS policy because it was not part of a WS group. If an employer sponsors LTC/LTCI educational meetings, with employees pursuing any interest in LTCI off-site, sales would likely not be reported as WS sales.
We limit our analysis to US sales and exclude “combination” products, except where specifically indicated. (Combination products pay meaningful life insurance, annuity, or disability income benefits in addition to LTCI.)
As reported in Market Perspective, the bulk of worksite sales that cover support with activities of daily living (ADLs) or cognitive impairment do not qualify as LTCI under section 7702(B) and are not covered in this survey (except as specifically mentioned).
About the Survey
Participants
Seven participants (Bankers Life, Knights of Columbus, Mutual of Omaha, National Guardian Life, New York Life, Northwestern, and Thrivent) contributed broadly to stand-alone sales distributions reported herein. Total 2022 sales data includes one additional contributor (LifeSecure) and 2022 inforce data includes two additional contributors (LifeSecure and CalPERS).
Our survey includes stand-alone WS sales and statistical distributions from participants National Guardian Life, New York Life, and Northwestern, and WS sales data from contributor LifeSecure.
The following eleven insurers participated in our combination sales data: AFLAC, John Hancock, Mass Mutual, New York Life, Nationwide, Northwestern Mutual (Northwestern), OneAmerica, Pacific Life (2021 survey only), Securian, Trustmark and United of Omaha.
Comparisons of sales distributions
We compare WS sales to individual LTCI policies that are not WS policies (NWS) and to total sales (Total).
Our WS stand-alone statistical distributions can vary significantly from year-to-year because insurers focusing on particular WS markets may be over- or under-represented. As has been the case for several years, our worksite sales distributions are dominated by executive sales. Carriers that provided 2022 distributions had an average worksite annual premium of $2,565, excluding FPOs, whereas the insurers that provided sales, but not distributions, had an average worksite premium of $1,876 annually. We believe this difference is narrower than in the past several years because of the inclusion of delayed Washington sales in our 2022 WS data.
Highlights from This Year’s Survey
As explained in the July issue, a large number of 2021 applications were delayed by insurer backlog in 2021, eventually being issued in 2022. We successfully worked with most participants to reassign cases to 2021 so we could isolate the boost in 2021 sales driven by the Washington Cares Fund (WCF) exemption rules. Nonetheless, our total sales distributions are still somewhat impacted by delayed 2021 sales in the state of Washington.
Reassigning those policies was a lot of work for participants, so we chose not to reassign corresponding worksite policies to 2021. Thus, while our total distributions are largely adjusted for such lag, our WS distributions are not adjusted for such lag. Our NWS distributions are also not adjusted for such lag, because we calculated NWS distributions by subtracting unadjusted WS sales from unadjusted total sales. Readers should keep in mind that some results may be meaningfully different next year when all data will be on the same basis.
Table 1 shows the number of sales and premium in the total market and in the worksite market both nationally and in Washington for years 2020 to 2022. Including NAIC data for non-participants, it shows that Washington accounted for 75 percent of reported stand-alone LTCI policies sold in 2021 (an estimated 35 percent of premium) and 54 percent of combination life/LTCI policies (21 percent of premium).
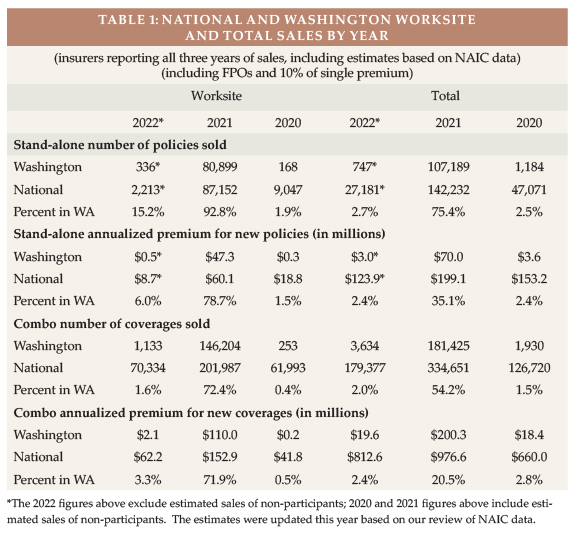
Stand-alone worksite 2022 sales receded significantly from their higher, Washington-impacted 2021 sales. Participants reported worksite sales of 2,213 lives and $8.7 million in premium, compared to (for same companies) pandemic-influenced 2020 sales of 2,124 lives and $7.1 million of premium. Transamerica, which produced more 2020 worksite sales than all our participants combined, stopped selling in the first half of 2021 and is not included in the prior sentence. Thus, our participants appear to have, at best, absorbed a small portion of Transamerica’s share of the worksite market. As discussed in Market Perspective, many worksite sales with coverage for ADL-deficiency and cognitive impairment shifted to products that do not qualify as LTCI under section 7702(B).
As shown in Table 1, stand-alone WS sales (including Transamerica) dropped significantly from 2020 to 2022, but combo worksite reported sales increased by 13 percent (number of coverages) and 49 percent (annualized premium).
Worksite sales contributed eight percent of participants’ stand-alone sales in 2022 and seven percent of stand-alone annualized premium, as explained in the discussion of Table 3. Table 1 also shows that Washington accounted for 15 percent of the reported 2022 worksite cases and six percent of the worksite premium, indicating a low average premium for Washington sales compared to National. Washington’s higher market share in terms of policies is an indicator that our stand-alone worksite sales include many delayed 2021 sales. Our numbers reflect a significant drop in stand-alone LTCI sales in the worksite, which would be even greater had we adjusted worksite sales for the Washington sales lag.
As reported in our July issue, the number of 2021 Washington stand-alone LTCI sales was approximately 90 times the 2020 Washington sales. The ratio varies significantly between worksite insurers (483) and individual insurers (26).
In the combo market, worksite sales accounted for 39 percent of participants’ reported coverages sold and eight percent of annualized premium. Life/LTCI combo insurers sold 89 times as many coverages in Washington in 2021 than in 2020. The ratio also varies significantly between worksite insurers (578) and individual insurers (21). We include here some WS policies that qualified for exemption from the WCF tax even though they do not qualify under section 7702(B), which largely explains different results than some other reports. We have a good-sized sample of combo insurers, but a lower percentage of industry sales than in the stand-alone market.
MARKET PERSPECTIVE
There are three segments of the WS market. A single WS case may involve different segments for different employee classes.
- In “core” (also known as “core/buy-up”) programs, employers pay for a small amount of coverage for generally a large number of employees. Employees can buy more coverage. “Core” programs generally have low average ages, short benefit periods, low daily maximum benefits and a small percentage of spouses insured.
- In “carve-out” programs, employers pay for robust coverage for key executives and usually their spouses. Generally, executives can buy more coverage for themselves or spouses. Compared to “core” programs, a higher percentage of insureds are married, more spouses buy coverage, the age distribution is older and average premium is higher.
- In “voluntary” programs, employers pay none of the cost. The typical coverage is more robust than “core” programs, but less robust than “carve-out” programs. Voluntary programs tend to be most weighted toward female purchasers.
National Guardian, New York Life, and Northwestern write mostly executive carve-out programs and are the only insurers that provided statistical distributions; therefore, our data is heavily weighted to the executive carve-out market. If an employer purchases coverage for only one or two employees, the insurer may not recognize the case as executive carve-out, in which case we would under-report executive carve-out sales.
Because of tax savings, small executive carve-out issue dates are weighted toward the end of the year. On the other hand, large voluntary cases are traditionally weighted toward fall enrollments with January 1 effective dates. Large voluntary cases are probably more evenly distributed through the year than in the past, but differences remain.
Carrier and product shift: Last year, we noted that the future of the non-executive carve-out LTCI market was unpredictable with Transamerica’s departure. This year’s decline in the stand-alone WS market was not surprising.
WS programs have gravitated toward products that include life insurance, which is viewed as a more immediate potential need by young employees with families. The possibility of guaranteed issue also draws employee benefit advisors and employers to such products. Such products can allow 100 to 300 percent of the death benefit to be used for “chronic illness” (defined in terms of ADLs and cognitive impairment), typically using up to four percent of the death benefit each month. Alternatively, they can allow 100 to 200 percent of the death benefit to be used, restoring used death benefit each month so beneficiaries will receive the full death benefit.
These products do not qualify as LTCI under section 7702(B). As they have a fixed chronic illness benefit, the purchasing power of the coverage typically deteriorates over time. For example, if a 30-year-old employee buys a $100,000 death benefit, she will have a $4,000 maximum monthly benefit for chronic illness (assuming the benefit features described above). That $4,000 benefit would cover a much higher percentage of her cost of care if she needed care in the next few years compared to if she needs care 50 years from now.
Washington Cares Fund: Washington state’s “Washington Cares Fund” (WCF) imposes a 0.58 percent employee-paid payroll tax to fund a $36,500 lifetime pool (intended to inflate according to the Washington consumer price index) for care, as defined in the Revised Code of Washington 50B.04, received in Washington. People who purchased private stand-alone or combination LTCI by November 1, 2021 could file to be exempt from the tax. WCF received approximately 484,000 applications for exemption.1
Other states are interested in state-run LTCI programs. Examples include:
- California: A task force identified alternative programs which are being priced in 2023. Recommendations will be made to the legislature for possible 2024 legislation.
- New York SB 9082 did not pass in 2022 and no legislation was proposed in NY’s 2023 legislative session. However, Governor Hochul issued an executive order in November 2022 citing her “vision of a long-term care system that is accessible, effective, and affordable.”2
- In Minnesota, bills for a state LTCI program have been introduced twice. The state has commissioned a study to be produced in 2023 to explore alternatives.
Pricing and Underwriting Considerations: Most people interpret Title VII of the 1964 Civil Rights Act to require that employer-involved LTCI programs use unisex pricing if the employer has had at least 15 employees for at least 20 weeks either in the current or previous year. Some states apply similar laws to employers with fewer employees. The expense of separate pricing, marketing and administration discourages insurers from serving both the WS and NWS markets.
Moreover, insurers fear anti-selection. Because women have higher expected future claims, unisex pricing saves women money compared to gender-distinct NWS pricing, whereas men pay much more with unisex pricing than with gender-distinct pricing. Insurers may vary pricing based on the employees’ gender distribution.
Insurers also fear health anti-selection (less-healthy people buying, while healthier people do not buy). Insurers are more vulnerable to health- or gender-anti-selection if the group has a large portion of young or less affluent employees as this group is generally less likely to buy LTCI. When the coverage has a life insurance component, more employees are likely to buy, which can help reduce the insurer’s anti-selection concerns.
Furthermore, because WS programs rarely offer “preferred health” discounts, healthy couples may pay more for WS coverage than for corresponding NWS coverage.
To control risk, most insurers will not accept a voluntary WS program if there are fewer than 100 employees. However, one insurer (which offers no health concessions) will accept voluntary LTCI programs with as few as 2 to 5 (varies by jurisdiction) employees buying.
Because of tax advantages when an employer pays the premium, a more expensive WS product can still produce after-tax savings compared to a cheaper NWS policy. The specter of future tax increases enhances the attractiveness of employer-paid premium.
Availability of coverage: As few people younger than age 40 buy stand-alone LTCI, some insurers have raised their minimum issue age to avoid anti-selection and to reduce exposure to extremely long claims. Such age restrictions can discourage employers from introducing a program, especially a carve-out program if they have executives or spouses too young to be covered.
With increased remote work, more employers have employees stretched across multiple jurisdictions and eligible non-household relatives might live anywhere. But insurers may not offer a product in jurisdictions with difficult laws, regulations or practices, such as slow policy form approval. So, it can be difficult to find a product which can cover everyone unless LTCI is sold on a group policy form and the employer does not have individuals in extra-territorial states.
One contributor no longer offers WS LTCI to non-household relatives. Reduced availability for such relatives does not have much impact on sales, because typically a small percentage (about one percent of 2022 sales) of WS buyers are not an employee or partner. If a program does help elder relatives, it is still not likely to meaningfully address the negative impact of employees being caregivers.
Prior to gender-distinct pricing, an executive carve-out for two partners of a company with more than 15 employees could have been serviced by any LTCI company, but now it is hard to find a carrier that offers unisex pricing under such circumstances. Such executives may buy policies with gender-distinct pricing either because they are unaware of the requirement under Title VII of 1964 Civil Rights Act; they may disagree with the interpretation that such policies should have unisex pricing to avoid the risk of a civil rights complaint; etc.
Some employee benefit brokers are reluctant to embrace LTCI because of declinations, the effort of enrollment, certification requirements, their personal lack of expertise, etc. WS sales gain from LTCI specialists forming relationships with employee benefit brokers.
Support for Employees who are Caregivers: Various programs offer LTC-related services to employees and their families. Regardless of whether the employee is insured or the relative is insurable, they may be able to access information, advice, services, and products that make caregiving more efficient, more effective, safer, and less expensive. Enabling employees and their families to have better LTC experiences and to use more (not necessarily 100 percent) commercial care should boost productivity at work. Some of these programs are packaged with WS LTCI.
STATISTICAL ANALYSIS
As mentioned earlier, insurers’ sales distributions can vary greatly based on the submarket they serve (for example, in the WS market: core, voluntary, or carve-out). Therefore, in addition to fundamental changes in the industry, distributions may vary significantly from year to year due to a change in participating insurers, distribution within an insurer, and market share among insurers. Policies in the carve-out market are designed similarly to those in the NWS market. Our sales distributions reflect only stand-alone LTCI. Two insurers reported their number of new employer cases as well as the number of new worksite sales. Combined, they averaged 7 applications per new employer case, which seems to confirm the executive carve-out concentration in our data.
The aggregate sales section includes estimates for 2021 and 2020 to reflect a more accurate picture of the industry. Subsequent sections do not include sales estimates.
Aggregate Sales
Table 1 shows the number of sales and premium in the total market and in the worksite market both nationally and in Washington for years 2020 to 2022. Table 1 spotlights the impact of Washington on 2021 sales and the drop in worksite sales in 2022.
Last year, to provide a clearer view of what happened in Washington in 2021, we estimated 2020 and 2021 sales from non-participants. A lot of 2021 sales, particularly worksite sales, were made by non-participants. However, the non-participant with the bulk of the 2021 sales stopping selling in mid-2021. In 2022, we did not estimate sales of non-participants, as our general observations of the market would be unchanged.
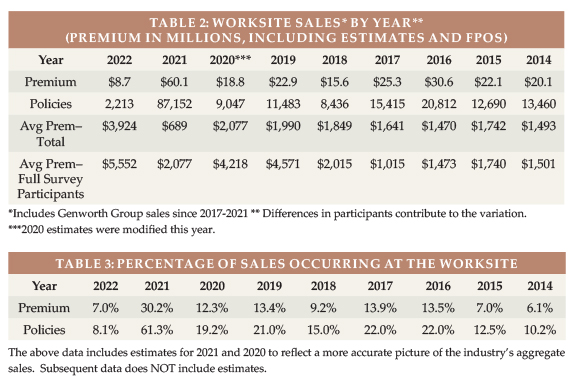
Table 2 shows historical WS sales over a longer period of time, including some estimates based on our review of NAIC data. It shows overall average WS premium for all carriers that reported sales compared to the average WS premium for the participants who contributed statistical data beyond sales. As shown in Table 2, our WS statistics likely represented the broad WS market reasonably until 2017 (the WS average premium for survey participants was similar to the total average premium before 2017). Average premiums plummeted last year because of the WA sales. We believe the full survey participant average premium was lowered by delayed Washington policies.
Table 3 shows WS sales as a percentage of total LTCI sales. As noted earlier, the WS percentage declined in 2022 due to an insurer dropping out of the market. The 2022 percentages would be significantly lower if we had removed the sales pushed into 2022 by the flood of 2021 applications.
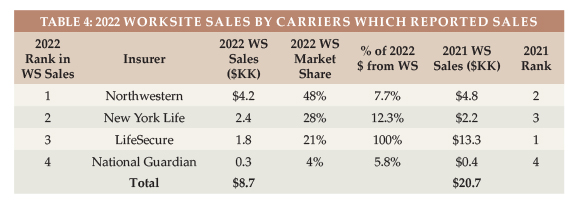
Market Share
Table 4 shows the insurers’ reported WS sales, including FPOs and additions to worksite cases issued in prior years. Excluding FPOs, New York Life would have been in the lead, followed by LifeSecure.
We also examined the distribution of new insureds by jurisdiction for both the total market and the WS market. The WS market share of five states (AK, IA, ND, VA and WA) was 50 percent or more greater than their overall market share (e.g., if they had a two percent overall market share, they had at least a three percent market share in WS). In 18 jurisdictions, the market share of total sales was at least 50 percent greater than the WS market share, suggesting that there may be opportunity for WS sales in these jurisdictions: AL, CO, IN, KS, ME, MD, MA, MI, MO, NE, NH, NM, PA, SC, TX, UT, VT, and WI. In five jurisdictions, our participants had no stand-alone WS sales at all (DC, RI, WV, WY, and Puerto Rico).
Average Premium Per Buyer
Table 5 shows the average premium per new insured (NB Insured) and per buying unit (a couple comprise a single buying unit). For these two average sizes to be comparable, we must include only insurers which report sales for couples. The average premium per new insured including all insurers that reported sales is $3,556.
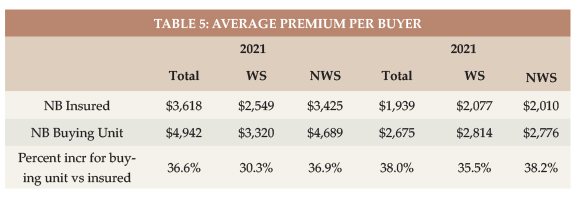
As always, the average premium per buying unit (a couple comprise a single buying unit) is higher because there are fewer buying units than insureds. Normally, the increase in average premium per buying unit compared to per insured is lower for WS sales, because more WS buyers are single and because spouses are less likely to buy in the WS. However, in the carveout market, more buyers are married and spouses are more likely to buy.
Issue Age
In reviewing the balance of the statistical presentations, we urge you to be selective in how you use the data because it is not representative of the entire WS market as explained above.
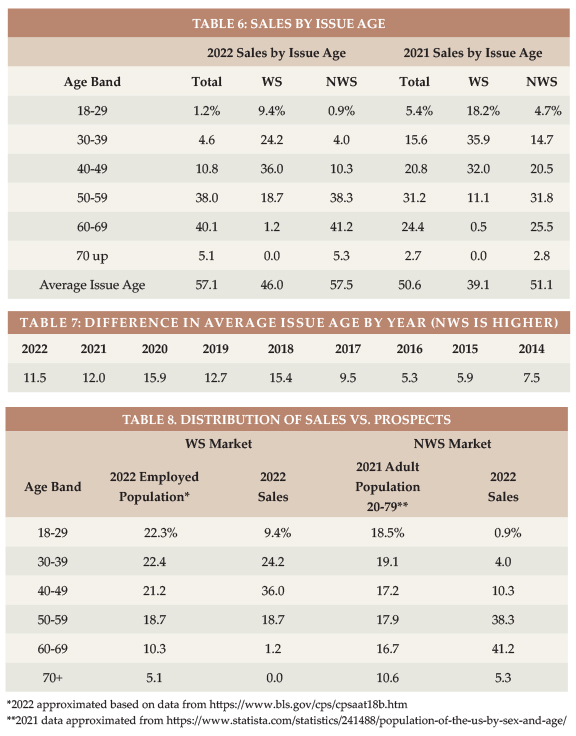
Table 6 shows that the average age increased 6 to 7 years for both the NWS market and the WS market, which was generally expected due the influence of 2021 Washington sales.
Table 7 shows how much older the average NWS buyer has been compared to the average WS buyer.
Table 8 displays the relative age distribution of workers ages 16+ vs. the age distribution of purchasers in the WS market. It also shows the age distribution of adults 20-79 compared to the age distribution of purchasers in the NWS market. If the percentage of sales in a particular age group is higher than the percentage of population in that age group, we can conclude either that LTCI is more appealing to that age group or that the industry gets in front of that age group more. For whichever reason, the industry is particularly effective with ages 40-49 in the WS market. In the NWS market, the industry is particularly effective for ages 50-69.
Rating Classification
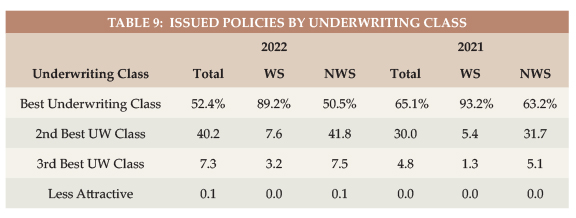
Most WS sales are in the “best” underwriting class (see Table 9) because there generally is only one underwriting class. Insurers often do not get enough information in WS to determine whether a “preferred health” discount could be granted and use the additional revenue (from not having a “preferred health” discount) to fund extra cost resulting from gender or health anti-selection. Carve-out programs are more likely to offer a “preferred” discount, which means a higher percentage of carve-out policies are issued in the second-best underwriting class. The percentage of policies issued in the best underwriting class soared in the NWS market in 2021 because younger and healthier buyers were drawn to LTCI in WA.
Benefit Period
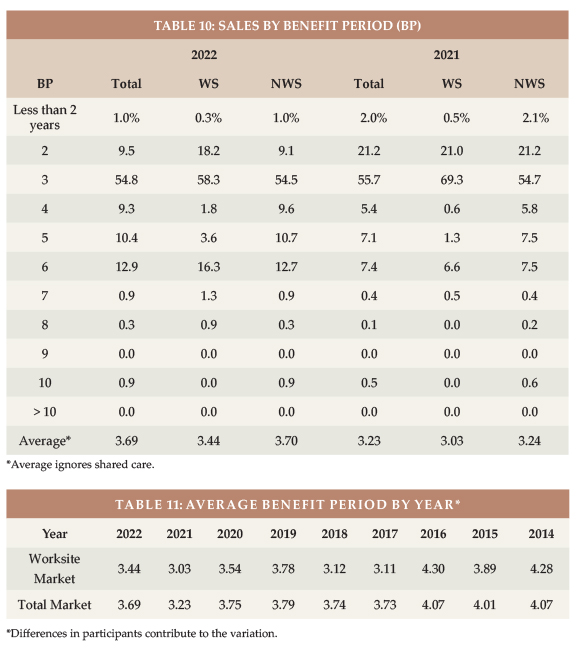
The WS average benefit period is low for core/buy-up programs and somewhat low for voluntary programs. Executive carve-out programs sometimes have longer benefit periods than the NWS market. In 2022, the average benefit period returned to pre-2021 levels. The NWS market had an average benefit period of 3.70 years compared to 3.76 in 2020. The WS market had an average benefit period of 3.44 compared to 3.54 in 2020.
The difference in benefit periods between the markets is larger than these statistics indicate, because these statistics ignore Shared Care (the WS market issues much less Shared Care).
Table 11 shows corresponding data back to 2014. As noted elsewhere, this data can jump around based on which insurers provide such detail and whether large core/buy-up cases are written in a particular year.
Maximum Monthly Benefit
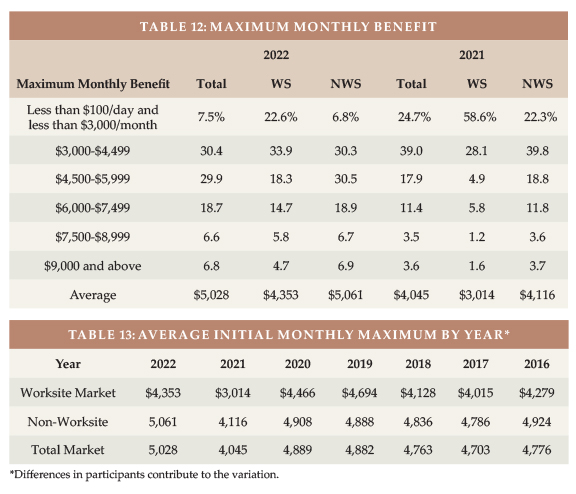
In 2020, the average initial monthly maximum was about nine percent lower in the WS market than in the NWS market. In 2021, the difference tripled to 27 percent lower in the WS market. To calculate the average initial monthly maximum, we presume an average size in each size range. The $2,100/month we assume for the smallest size range seems to overstate dramatically in 2021 as many people opted for the minimum $1,500/month.
The Total Market average initial monthly maximum was the highest we have seen since 2015 partly due to a shift in distribution away from the WS market (see Table 13). The WS initial monthly maximum varies more over time than the whole market because of participant changes and how many core/buy-up plans were sold in a particular year.
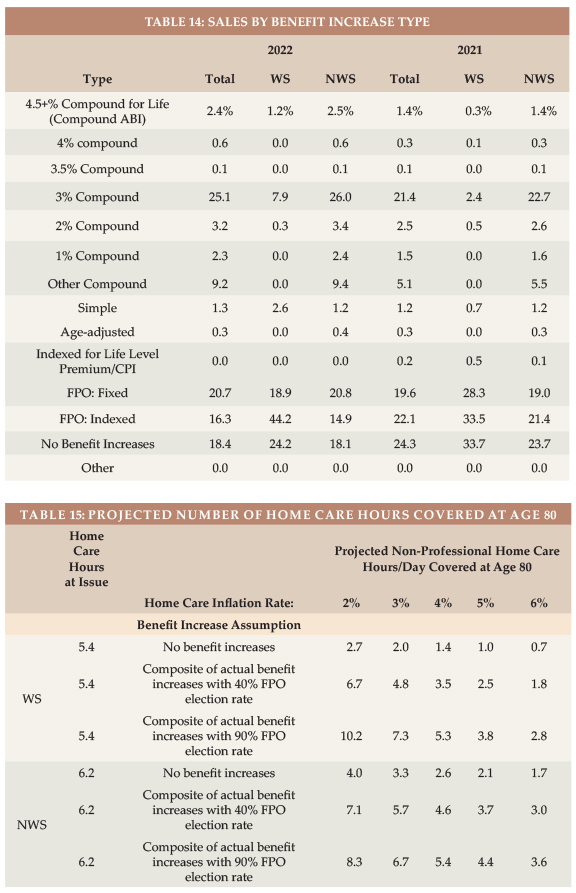
Benefit Increase Features
As shown in Table 14, 9.1 percent of 2022 WS sales had compounding of three percent or higher, compared to 2.8 percent in 2021 (and 5.6 percent in 2020). Of the 2022 WS sales, 24 percent had no increase feature and 63 percent had a FPO feature.
In the NWS market, 29.2 percent had three percent or higher compounding compared to 24.5 percent in 2021 (and a 35.5 percent in 2020).
Future Protection
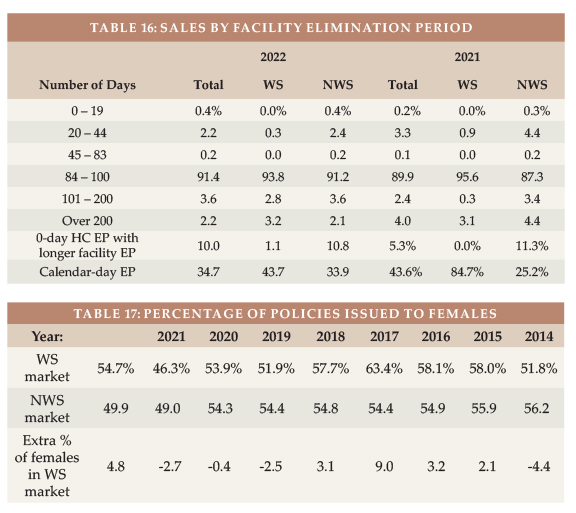
Based on a $27/hour cost for non-professional personal care at home ($27 is the median cost according to Genworth’s 2021 Cost of Care Survey), the average WS initial maximum daily benefit of $145 would cover 5.4 hours of such care per day at issue, whereas the typical NWS initial daily maximum of $169 would cover 6.2 hours of such care per day, as shown in Table 15.
The number of future home care hours that could be covered depends upon when care is needed (we have assumed age 80), the home care cost inflation rate between now (age 46 for WS and 58 for NWS) and age 80 (we have calculated with two, three, four, five and six percent inflation), and the benefit increases provided by the LTCI coverage between now and age 80.
Table 15 shows calculations for three different assumptions relative to benefit increase features:
- The first line presumes that no benefit increases occur (either sold without any benefit increase feature or no FPOs were exercised).
- The second line reflects the average benefit increase design using the methodology reported in the July article, except it assumes that 40 percent of FPOs are elected (intended to be indicative of “positive” election FPOs, in which the increase occurs only if the client elects it) and provide five percent compounding.
- The third line is like the second line except it assumes 90 percent of FPOs are elected (intended to be indicative of “negative” election FPOs, in which the increase occurs unless the client rejects it). It also assumes the FPOs reflect five percent compounding.
Table 15 indicates that:
- Without benefit increases, purchasing power deteriorates significantly, particularly for the WS purchaser as younger buyers have more years of future inflation prior to claim onset. For example, with a flat benefit, the number of covered hours of home care at age 80 drops to 2.0 hours for the average WS purchase age if there is three percent inflation and fewer than 2 hours if inflation is higher. The average NWS buyer would have 3.3 hours of care (rather than 2 hours) at age 80 if they had no benefit increases and inflation was three percent because the average NWS buys a larger daily benefit and is older.
- The “composite” (average) benefit increase design assuming that 40 percent of FPO offers are exercised preserves purchasing power better than when no increases are assumed. The average WS buyer gains buying power over time if the inflation rate is two percent, being able to pay for 6.7 hours at age 80. But if the inflation rate is four percent, this drops approximately in half. The average NWS buyer does better because of a higher initial maximum daily benefit and a higher issue age.
Assuming that 90 percent of FPO offers are exercised, this buyer would have at least as much coverage at age 80 as at issue if the inflation rate is less than four percent. The average NWS buyer has increasing purchasing power until inflation averages more than 3.3 percent.
Table 15 underscores the importance of considering future purchasing power when buying LTCI. Please note:
- The average 2022 WS buyer was 12 years younger at issue than the average 2022 NWS buyer, hence has 12 more years of inflation and benefit increases in the above table. The actual inflation rate to age 80 is not likely to be the same for today’s 46-year-olds as for today’s 58-year-olds.
- Individual results vary significantly based on issue age, initial maximum monthly benefit, and benefit increase feature, as well as the inflation rate and the age at which the need for care occurs.
- Between the median age of starting to need care (about age 83) and the median age of needing care (about age 85), more purchasing power could be gained or lost.
- Table 15 does not reflect coverage for professional home care or facility care. According to the 2021 Genworth study, the average nursing home private room cost is $297/day, which is currently comparable to 11 hours of non-professional home care. However, the inflation rate for facility costs is likely to differ from the inflation rate for home care. From 2004-2021, Genworth’s studies showed the following compound growth rates: private room in a nursing home (3.0 percent), assisted living facility (3.8 percent), home health aide (2.2percent), and home care homemaker (2.6 percent).
- Table 15 could be distorted by simplifications in our calculations. For example, we assumed that the FPO election rate does not vary by age, size of policy or market and that everyone buys a home care benefit equal to the average facility benefit.
- FPO election rates might be different for policies purchased in 2021. How likely is it that 2021’s WA buyers will exercise FPOs?
Partnership Program Background
When someone applies to Medicaid for long-term care services, most states with Partnership programs disregard assets up to the amount of benefits received from a Partnership-qualified policy (with some policies, IN and NY disregard all assets). Partnership programs exist in 44 jurisdictions (all but AK, DC, HI, MA, MS, UT, and VT), but MA has a similar program (MassHealth). The first four states to develop Partnerships (CA, CT, IN and NY) have different rules, some of which have become a hindrance to sales. We are not aware of a Partnership-qualified WS LTCI product in those four states, which is unfortunate because the WS market serves many people who could benefit from Partnership.
To qualify for a state Partnership program, a policy must have a sufficiently robust benefit increase feature. Many jurisdictions have lowered the minimum Partnership-eligible compounding benefit inflation rate to one percent. To facilitate Partnership sales in such jurisdictions, an insurer could lower its minimum size by 1/3 (e.g., from $1,500 to $1,000) if one percent compounding is included in a core program. The revenue from the core program would typically increase. The premium would be more level by issue age, shifting risk to younger ages which can be preferable for the insurer in a core program.
Jurisdictional Distribution
The 2023 Milliman Long Term Care Survey includes a chart of the market share of each US jurisdiction relative to the total, WS and NWS markets, and the Partnership percentage by state. This chart indicates where relative opportunity may exist to grow LTCI sales.
Elimination Period
More than 90 percent of the NWS market buys 90-day elimination periods (EPs). For that reason, many WS programs offer only a 90-day EP.
Table 16 shows distribution by EP and how many policies had a 0-day home care feature and a longer facility EP and how many policies had a calendar-day EP (as opposed to a service-day EP). We have reflected that all LifeSecure policies are 90-day EP with a calendar-day definition. Policies which have 0-day home care EP and define their EP as a service-day EP operate almost identically to a calendar-day EP, because people in facilities get daily care.
Gender Distribution and Sales to Couples and Relatives
Insurers began gender-distinct LTCI pricing in 2013, but as explained above, unisex pricing continues in the WS market.
In the NWS market, the 2013-2015 percentages of females were high as insurers that still offered unisex pricing attracted single females. The next 5 years, the percentage of female buyers in the NWS was stable, fluctuating from 54.3 to 54.9 percent. In 2021, women constituted 50.5 percent of the US age 20-79 population3, but in 2021 the percentage of females dipped below 50 percent in both the WS and NWS markets because of the higher number of males purchasing coverage in WA.
In the WS market, the high percentage of female WS buyers from 2015-2018 suggests that women were particularly attracted to WS LTCI (presumably because of unisex pricing). To the degree that our more recent WS data is over-weighted to executive carve-out programs, it reflects less of the gender anti-selection that likely still exists. Although most executives are male, executive ranks are becoming more gender-balanced and many executive carve-out programs cover spouses. Women make up 47 percent of workers4 but accounted for 55 percent of our reported 2022 WS sales.
Table 18 digs deeper, exploring the differences between the WS and NWS markets in single female, couples and Shared Care sales. The percentage of NWS insureds who are female (49.9 percent) spotlights our statistical distribution difficulties this year. Insurers that reallocated sales from 2022 to 2021 probably moved a high percentage of males from total sales. As the worksite number of males was not adjusted, our method subtracted an unadjusted (high) number of WS males from an adjusted (low) number of total males, producing a misleading high number of NWS males, which explains our low 49.9 percent for females.
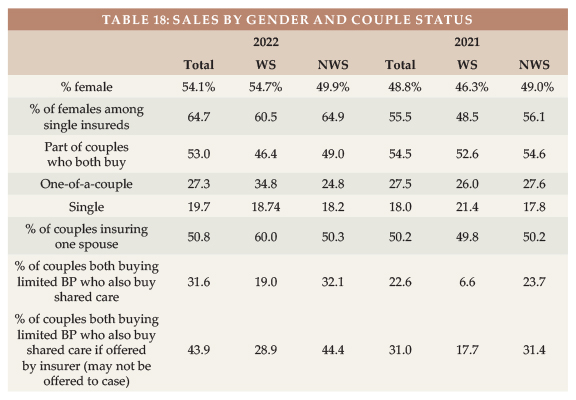
Our WS data had more single buyers, but a lower percentage of single buyers were female.
Slightly more than half the couples in the WS market insured both partners; slightly fewer than half of the couples in the NWS market did so.
Shared Care is less often offered in a WS program.
Our limited data with regard to relatives who buy shows that two spouses are insured for every three employees. That’s a high percentage reflective of executive carve-out data. Only about one percent of purchasers are relatives other than the employees and employees’ spouses.
Type of Home Care Coverage
Table 19 summarizes sales by type of home care coverage. Historically, the WS market sold few policies with a home care maximum equal to the facility maximum. However, with increasing emphasis on home care and simplicity, that difference faded.
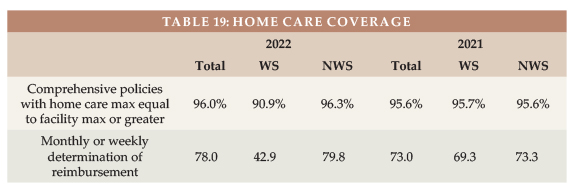
Table 19 also shows that monthly determination dominates both markets.
Because some insurers build these features into products automatically, we are able to include data from an insurer which did not provide sales distributions.
Many WS products embed a “partial cash alternative” feature (which allow claimants, in lieu of any other benefit that month, to use approximately 1/3 of their benefit for whatever purpose they wish, with the balance extending the benefit period) or a small informal care benefit.
Other Features
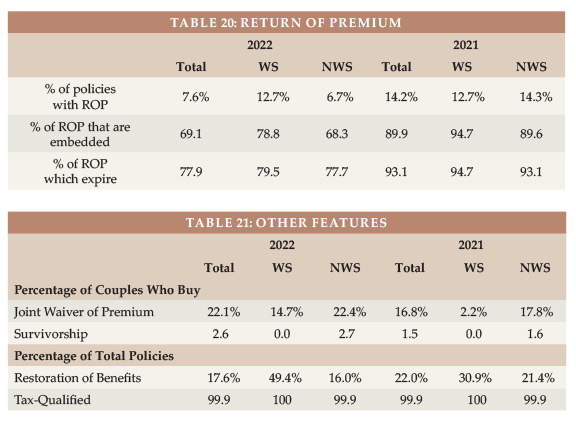
Table 20 shows that almost all Return of Premium (ROP) features were embedded (automatically included) and phased out before death would be likely. ROP with expiring death benefits may provide an inexpensive way to encourage more young people to buy LTCI but does not address the buyer’s concern (what if I keep paying all my life, then die without qualifying for benefits?).
Table 21 shows lower Joint Waiver of Premium and Survivorship sales to couples in the WS market than in the NWS market, mostly due to differences in distribution by carrier. Some products automatically provide Joint Waiver of Premium if a couple buys identical coverage or if a couple buys Shared Care. Employers sometimes are disinclined to add an optional couples’ feature because they are already contributing more money to cover a married employee plus that employee’s spouse than the cost for a single employee the same age.
CLOSING
We thank insurance company staff for submitting the data and responding to questions promptly. We also thank Sophia Fosdick and Quentin Clemens of Milliman for managing the data expertly.
We reviewed data for reasonableness. Nonetheless, we cannot assure that all data is accurate.
If you have suggestions for improving this survey, please contact one of the authors.
References
- Washington State Employment Security Department, https://media.esd.wa.gov/esdwa/Default/ESDWAGOV/Fact-Sheets/2023-wa-cares-overview-230113.pdf
- https://www.governor.ny.gov/news/governor-hochul-signs-executive-order-create-new-yorks-first-ever-master-plan-aging.
- https://www.statista.com/statistics/241488/population-of-the-us-by-sex-and-age/.
- Bureau of Labor Statistics, https://www.bls.gov/cps/cpsaat11.htm.