Tuesday, May 20, 2025
Home Authors Posts by Charlie Gipple, CFP, CLU, ChFC

Charlie Gipple, CFP, CLU, ChFC

115 POSTS 0 COMMENTS
Charlie Gipple, CFP®, CLU®, ChFC®, is the owner of CG Financial Group, one of the fastest growing annuity, life, and long term care IMOs in the industry. Gipple’s passion is to fill the educational void left by the reduction of available training and prospecting programs that exist for agents today. Gipple is personally involved with guiding and mentoring CG Financial Group agents in areas such as conducting seminars, advanced sales concepts, case design, or even joint sales meetings. Gipple believes that agents don’t need “product pitching,” they need mentorship, technology, and somebody to pick up the phone… Gipple can be reached by phone at 515-986-3065. Email: cgipple@cgfinancialgroupllc.com.

Annuities Versus The Four Percent Rule

I recently saw somebody write about how we should not compare annuities to the four percent rule. Although I agree that there needs to be additional disclosures and education in the annuity part of the conversation, I disagree with not comparing the two.

Re-Anchor Clients in Reality, Not Fairy Dust
I believe that consumers tend to “anchor” their retirement income expectations on the wrong thing and therefore should be “re-anchored” in reality. For instance, consumers should be educated on the fact that William Bengen’s study in 1994 showed that in order to sustain a stock/bond retirement portfolio for 30+ years in retirement, the consumer should take out no more than four percent of their retirement account balance that first year in retirement, adjusted each year thereafter for inflation. Consumers should also be aware of the new updated studies that show “rules of thumb” of 2.3 to 2.8 percent. (Note: When using these comparisons versus annuities, it is important to discuss that annuities generally do not have “inflation adjustments” the four percent rule incorporates. More on that in a bit.)

This “re-anchoring” is important because many consumers know that the S&P 500 has gone up double digits on average for the last century and therefore overestimate what withdrawal rate they should utilize. They have seen the glorification of the stock and bond markets and have likely seen the mountain charts like the Ibbotson SBBI Chart. You know what charts I am referring to; those that show that the stock market has done double digit returns forever and that their $1 invested back when Adam met Eve would be worth enough to purchase their own private island today.

Thus, if a consumer has in their brain that stocks and bonds have always performed seven percent, eight percent, 10 percent, 12 percent, then they will tend to believe that their retirement withdrawal rate is beyond the four percent that the research shows. Even if a consumer has heard of the four percent withdrawal rule, they may have not had the math laid out for them yet that is specific to their situation. It is important to explain to those that love their stocks and bonds—as I do—that even though the S&P 500 could average 10 percent over the coming years, it does not mean they will not run out of money by taking only four percent of the retirement value from their stock and bond portfolios! How is this possible? Because of the sequence of returns risk that the stock portion can subject the client to and the low interest rates (still) that affect the bond portion. And because of these two risks a client should not overestimate what their portfolios can do as far as withdrawal rates. If you would like a graphic that helps you explain the sequence of returns risk to your clients, email me.

To demonstrate my points in the previous paragraphs, I want to cite a study by Charles Schwab. In their 2020 Modern Retirement Survey they asked 2,000 higher net worth pre-retirees and newly-retired retirees about how much money they had saved for retirement and also how much money they expected to take from their retirement portfolios. The answers from the participants were that they had $920,400 in retirement savings on average, that they planned on spending $135,100 per year from those portfolios on average, and that they were generally confident in those dollar amounts allowing them to live the retirement they would like.

I would argue that a 14.68 percent withdrawal rate ($135,100 divided By $920,400) defies any retirement research I have seen! Naturally, Schwab then points out that—contrary to these participants’ beliefs—a $920k portfolio will run out in only seven years (obviously not including interest/appreciation). Clearly, these consumers should have the math explained to them. Even if the consumers understand the new rules of thumb, they may be experiencing cognitive dissonance that should be addressed by the financial professional. By doing so, you will “re-anchor” their expectations to the new realities of 2.3 percent, 2.8 percent, or four percent withdrawal rates, which will set you up for the annuity conversation that we’ll discuss.

I am not suggesting an agent go into a big dissertation on these individual studies. I just believe that going over the simplified math—specific to the client’s portfolios—based on these new rules of thumb should be done in order to show the power of annuity GLWBs. Although generous, using the old four percent rule of thumb will suffice in explaining the annuity value proposition. By demonstrating this math to the clients, you will be re-anchoring their expectations to realistic numbers. And only then do I believe they will realize the true power of GLWB Riders.

The GLWB Conversation
Here is what my conversation looks like that I will walk our hypothetical client through:

Let’s say our 63-year-old has $100,000 in a stock and bond portfolio. I start by discussing how this 63-year-old may have the expectation that her $100k grows by five percent or so per year between now and retirement in two years. Well, based on her $110,000 (not including compounding) value at that point, what withdrawal should she take in her first year of retirement? This is where I discuss the four percent withdrawal rule, which usually surprises them because their anchoring is off. I also discuss the reasons for the withdrawal rate being only four percent. But then I will show her $100k growing to $110k in two years at retirement. If the client wants us to assume a 20 percent return over two years, fine! I will do that instead. The math still works.

By the end of the two years, her $100k has grown to $110k. That is when we figure the first-year withdrawal, which comes out to $4,400. Again, that $4,400 is supposed to increase with inflation, per the four percent rule.

That $4,400 is assuming everything goes correctly. That is, that she gets 10 percent appreciation between now and age 65, and also the four percent being indeed sustainable over her 30-year retirement.

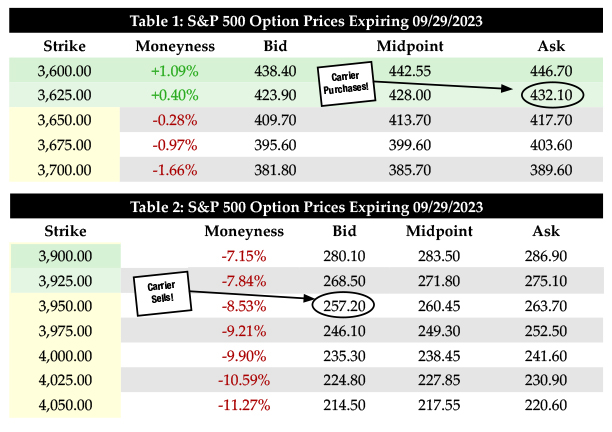
That is when I will switch to the annuity. On one of the industry’s top annuities/GLWB riders right now, her $100,000 will generate a $7,800 payment starting two years from now, guaranteed. That payment will go on forever. This GLWB payment is 77 percent higher than what our four percent withdrawal rule will provide. And you don’t have the “hoping and praying” with the annuity. Usually at this point in the discussion, the responses are in three different areas:

  1. Seems too good to be true! How can the company do that? (This is a topic for another article.)
  2. What if everybody lives forever? Will the company go out of business? (Again, a topic for another article.)
  3. But what about inflation? The four percent rule includes inflation, and the annuity does not.

Let’s discuss.

Level Annuity Payment Versus Four Percent with Inflation
Although I believe we are being generous to the situation by using the four percent rule instead of the more updated and lower rules of thumb, it would be disingenuous to not explain the lack of inflation on the level payout GLWBs. (Note: There are some GLWBs that have increasing income, but let’s leave the conversation to level income for now.)

This objection about annuities not having inflation included, versus the four percent rule, is a reasonable objection as inflation adjustments can be crucial. As a matter of fact, the “inflation rule of 72” says that a 3.5 percent inflation rate—for example—will chop the purchasing power of a dollar in half in only 20.5 years (72/3.5=20.5 years). Meaning that $7,800 would only have the purchasing power of $3,900 in 20.5 years assuming 3.5 percent inflation.

So then what provides the highest cumulative income, our GLWB or the four percent rule example? Above is a graph from a spreadsheet I created to show what provides more income—the $7,800 (GLWB) without inflation adjustments or the $4,400 (four percent rule) with inflation adjustments. (Note: For the inflation adjustments, I assumed 3.5 percent.)

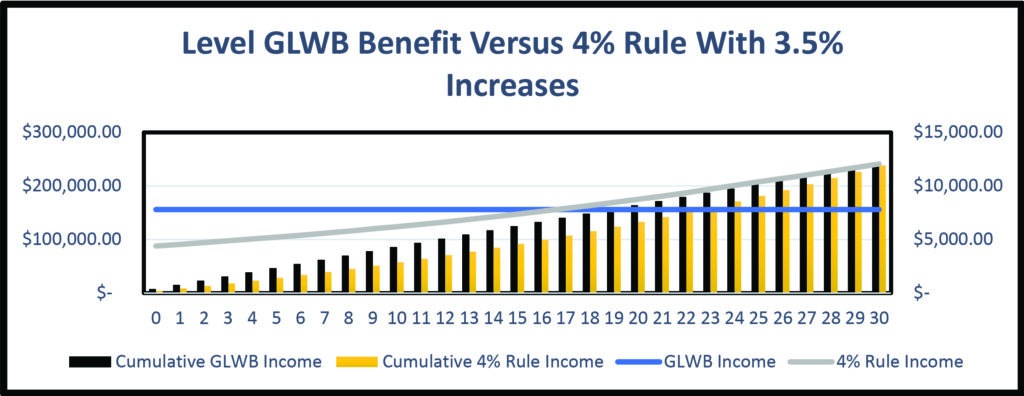
As you can see above, the inflation adjusted four percent rule annual income crosses over to where it is more than the $7,800 in the 18th year. You can see the two lines crossing over. The dollar amounts represented by the lines are in the right axis.

More important however is, what is the cumulative income from each strategy over a period of 30 years? That is represented by the bars and the left axis labels. As you can see, the Cumulative GLWB Income (black bar) stays higher than our cumulative four percent rule all the way through the 30-year retirement. Furthermore, this does not incorporate “time value of money” of the amount of excess GLWB payments we got above and beyond the four percent rule. Technically, those excess dollars reinvested would equate to even more than what our “cumulative” black bar is showing.

Clearly, there are other scenarios that we could run that can benefit or degrade the story on either one of the two solutions. For instance, we could run the four percent rule assuming a much higher return than 10 percent over two years—for example 20 percent. In that case, the “cumulative withdrawals” on the four percent rule overtake the annuity in the 27th year. But then we could also apply the “time value of money” to the excess annuity payments. We could also use the 2.8 percent withdrawal rule. Or, one could add different inflation rates, etc.

In the end and with all of this said, the story should be that consumers need to anchor their expectations reasonably and also that annuities have a great place in many consumers’ portfolios with or without inflation.

“If I Don’t Sell That Product, It’s A Bad Product”

A while back, I posted something on LinkedIn about how to assist consumers that desperately need help get qualified for Medicaid. As you know, Medicaid can pay for long term care (nursing home care primarily), if a consumer is deemed financially incapable. It is not a replacement for long term care insurance, but it can help consumers that did not prepare. And now those consumers are in a time of distress and need. Afterall, this is what we do as an industry—help folks in their time of need. After posting these Medicaid planning tips that leveraged “Medicaid Compliant Annuities,” there were several positive responses from agents who wanted to learn more.

However, as with any social media post that gets thousands of views, there were a few negative posts—although a tiny percentage of total responses. I would divide these negatives into four different camps:

  1. An attorney: All the attorney had to say was that all financial professionals should hire an attorney if they choose to help clients with this, and it’s ridiculous that I should even comment on Medicaid because I am not an attorney. Basically, only attorneys are smart enough to cover this topic.
  2. Fee-Only Advisor: This guy had nothing to say other than annuities are bad and include a lot of “fees,” which was ironic to me. (By the way, single premium immediate annuities for Medicaid purposes generally have no fees!)
  3. The life insurance guy that downplayed Medicaid: Because if everybody owned life insurance with a chronic illness rider, the client would never be in that position in the first place. (PS. I am a “life insurance guy” myself but disagreed with him bashing the client in hindsight.)
  4. My Favorite: The guy that must’ve viewed my post as taking away from his long term care insurance sale. This guy wanted to criticize me because I called it “Medicaid planning,” like the rest of the world—including the CFP Board! (He didn’t realize that I am a significant fan of long term care insurance.) He took the opportunity to plug his designation course for all that were viewing. LOL. Consumers are destitute because of long term care expenses, and we are quibbling over terminology?

My social media post—believe—is an unfortunate microcosm of what can take place in this wonderful industry. All four individuals above viewed that scenario of helping clients who previously failed to plan as taking from their paychecks. I am sure they would not admit that, but that is where the negativity came from. Any proposed solution that was outside of how they got paid in their own world is a bad solution. To the Chevy guy, there is not a Ford on Earth worth anything and vice-versa. This mindset does our collective industry no good. It is OK to be cheerleaders for products and strategies that are different from what we offer and still make great money! There is about $30 trillion in financial assets that Americans own currently. There is enough to go around.

In politics, if you listen to the commentary from our “leaders” on both sides of the aisle, there is never anything that the other side does that is any good. If one party comes out and says, “We cured cancer,” the other party will discuss how that “horrible development” will put a strain on pharmaceutical sales and the industry will collapse. Therefore, those politicians stand on the platform of negativity, as if that will help their party’s cause. What about the “Party” of the American People? Why not just view it all as one party—The American People Party?

I like the social media example above because of the amount of irony. I use attorneys every single week. I am pro attorney. I am also an “investment advisor” that charges fees on securities assets. I am a part of that “party.” As many of you know, I love life insurance and I especially love the chronic illness riders. What about long term care? If everybody in America owned an LTCI product, consumers would be in better shape. I am pro LTCI.

My point is not about how bad social media, or our industry, is, my point is about how we as professionals need to think beyond our immediate paycheck because the “partisanship” in financial services does nothing good for our business as a whole. For instance, is there anybody in our business that thinks Ken Fischer has done anything good for our industry and the reputation of financial professionals? This is the guy who says he would die and go to hell before selling an annuity. Where is he today as the stock market is down over 20 percent and the bond market down 15 percent? Do you think he has turned a few consumers away from our business because of his messaging? Absolutely. I am sure there are consumers that have not saved much in retirement dollars—whether in annuities or with Ken Fischer—because of Ken Fischer’s messaging.

There was actually a fifth camp in my social media post. It was one gentleman that effectively said that he was previously interested in the medicaid planning topic but not so much anymore because of the “partisanship” and confusion. I agreed with him!

Just as important to me is the power of one’s word. When people realize that you are a “partisan” that cheerleads only about your product/strategy, then all of your words ring hollow from there. This is why nobody believes what politicians say, especially when they are speaking about the other party.

When you are a “partisan” in financial services, your recommendations will be scrutinized heavily and your constructive criticisms will be discounted. And when your words become hollow to your prospects and/or clients you will not achieve full potential. Because of this, I do believe in transparency and calling out bad actors and bad strategies. For those close to me, you know that is my style. When my 15-year-old asks me how I thought he did in his basketball game, he knows what he is going to get whether good or bad. But, he is all ears and takes my feedback seriously. He doesn’t even ask my wife (his mother) how he did because she will invariably tell him “Great Honey!” every single time because she is such a positive and wonderful human being. In short, honesty is important but just because some person or some strategy was not in the same “Party” as you does not make them a “bad actor” or their options “bad strategy.” Our words need to mean something.

I listened to a podcast a while back where Neil deGrasse Tyson—an astrophysicist—was talking. He was discussing the deepest part of Earth’s surface and also the highest part of Earth’s surface. He stated that the Mariana Trench in the Pacific Ocean is the deepest—being over 30,000 feet deep. That is about six miles deep! Additionally, the tallest point on Earth is Mt. Everest at around 30,000 feet high. Almost six miles high! These are huge peaks and valleys to us small Earthlings. However, if you were a giant that was holding planet earth that was now about the size of a cue ball, you wouldn’t even feel that valley or that peak. In other words, in relative terms, the Earth is as smooth as a cue ball when you think “big enough.” This makes sense because twelve miles of difference between the deepest part and the tallest part is nothing compared to the overall size of the planet which is almost 8,000 miles in diameter!

Now I am not saying that our industry is as perfect as the surface of a cue ball. What I am saying is that I think it is important that we “think big picture” when it comes to our industry. Are there peaks and valleys when it comes to some products and some strategies? Absolutely. However, by more consumers being involved in our industry, those consumers and the world will be a better place. Partisanship does not help that cause.

GLWBs, Step-Ups, And Other Random Annuity Thoughts

A few weeks ago I was preparing an indexed annuity illustration for one of our agents who had a client that wanted guaranteed lifetime income. So, I was running one of my favorite indexed annuities with the GLWB rider. As I looked at the printout, I came across something that I hadn’t seen in years. It was a “step up!” It had been such a long time since I’ve seen one of these, at least on this type of a GLWB rider, that I was confused until I realized what was happening and why it was happening: The 11.5 percent S&P 500 “cap” was outpacing the GLWB rollup rate. Now that is not something you saw when caps were at five percent!

Over the last few weeks I have also had a few questions from agents asking me, “Can you explain what is happening in this illustration?” So, I felt the topic to be worthy of a column along with a few other random thoughts on GLWBs.

A couple decades ago I was with a very large company that was a leader in the variable annuity space. At the time, the hot item with variable annuities was “guaranteed lifetime withdrawal benefits”(GLWBs), and its predecessor, “guaranteed minimum income benefits” (GMIBs). These were very popular because, on the back end of the dotcom crash, consumers were looking for guarantees to protect them from the turmoil they had just experienced. The GLWBs separated themselves from the GMIBs in that the GLWBs did not require annuitization, just “withdrawals.” Hence, with the GLWBs, the company did not require the client to lose control of their account value by locking it into a perpetual income stream.

At that time our hot VA product story was that the client had a “benefit base” that was guaranteed to grow by seven percent every year, regardless of what the actual account value did on that variable annuity. Even if the account value lost 50 percent, again, the client had that baseline guarantee that they can eventually take income based off of. Furthermore, the variable annuity world marketed an additional benefit, and that benefit was “step-ups.” The notion of a step-up was that if, at the end of the year, the actual account value is higher than the benefit base—meaning that the account value increased by more than what the seven percent rollup percentages had done—the client’s new benefit base would “step up” to what that account value was in that year. And then the ongoing seven percent roll up percentages would generally apply to that higher value. Later on came quarterly step-ups, monthly step-ups, and then daily step-ups. Then the economy crashed in 2009, interest rates plummeted, and these robust variable annuity benefits “stepped down”…but I digress.

We all know that GLWBs on indexed annuities came from the variable annuity world. The first GLWB was put on an indexed annuity chassis around the year 2006, after the variable annuity business had been running with the concept of GLWBs and GMIBs for years. This made sense to the indexed annuity market because the VA business had used these riders with huge success. The VA business was a good business to copy because the VA business at the time was about six times the size of the indexed annuity business. 2006 VA sales were $160 billion and indexed annuity sales were around $25 billion.

Over the last two decades these riders have evolved like everything else. I now discuss that there are two different categories of GLWBs in general: a) Performance-Based (the newer breed); and, b) Guaranteed Rollup Riders (the traditional breed).

The performance-based riders generally have minimal (sometimes none) “rollup rates.” These riders largely rely on the account value to increase in order to have the benefit base (and eventual income) increase. An example of one of these GLWBs may be, your benefit base will increase by two times what the amount of credit/performance was in your account value.

The performance-based riders are a good option for the clients/agents that believe that the performance of the underlying index may enable the benefit base to grow faster than what a guaranteed rollup rider may be able to do. These riders effectively rely on “step-ups” like what I discussed with the variable annuities.

The other category—at least how I categorize them—is “Guaranteed Rollup Riders.” These are the traditional seven percent, 10 percent, etc., benefit base rollup rates. These GLWBs are for the clients/agents that want straight guaranteed income without any reliance on the account value. These are the riders that have been on indexed annuities since the beginning.

Generally, the “performance-based” riders will show “non-guaranteed” income that is higher than the guaranteed-rollup riders, at least based on the illustration. However, from a guaranteed income standpoint, the guaranteed rollup riders will generally show the highest guaranteed income.

With the guaranteed rollup riders, something odd is starting to happen with interest rates having spiked the way they have, and that is the potential to receive a step-up on the benefit base… If the indexed annuities in the early years had much potential for “step-ups” back then, then I certainly don’t remember it. If there was ever much potential then it only lasted until the financial crisis, when interest rates really started to plummet.

Why no step-ups? Two primary reasons:

  1. Low interest rates: Because caps and par rates on these products were so low that the odds of having the accumulation value outpace the “benefit base” was almost nothing. (Caveat: There are some “volatility-controlled indexes” that show very high “backcasted rates” that have been able to show a step-up, but that has not been the norm.)
  2. Bifurcation of objectives: Another reason that you have not seen step-ups on this flavor of GLWB is because the GLWB focused annuities are “generally” watered down from an accumulation standpoint relative to the same company’s accumulation focused annuities. If you compare the cap rates, par rates, etc., on a product that provides very good guaranteed income, you will find that the tradeoff is “usually” the lack of accumulation performance. (Note: There are exceptions to this rule in that there are products that have the same cap as their “accumulation focused” counterpart. Hence, the product I used in the first paragraph.)

With interest rates having increased the way that they have, and by choosing a product that also has great accumulation potential, there may be opportunities to show the consumer the potential for an occasional step-up on their indexed annuity. But be cautious of rosy illustrations.

One last point on income focused products that also have great caps, par rates, etc. Even without a “step-up,” a great income focused annuity represents less of an “opportunity cost” to the client—versus a purely accumulation product—when that income focused annuity also has great accumulation potential.

Why Focus On Social Security?

A while back an agent of mine was calling out to confirm social security seminar attendees from a marketing campaign that we conducted for him. At the time, he had around 20 registrants and was calling out to these prospects to confirm their attendance for the upcoming seminar. While he was doing this, he sent me a text message that said, “I have feedback on the calls that I have been making and observations, if you would like to hear them?” Although it sounded somewhat ominous to me I said, “Of course.” Later that day he called me. As I picked up the phone, I must admit that I was somewhat cringing because, again, his previous text sounded ominous. I was hoping that his feedback was not outside of the normal observations that I and my numerous other agents have experienced. I thought, “Maybe his geographic area does not care about Social Security” or, “I wonder if he is not able to get a hold of the registrants and he is unhappy.” Etc. So I was dying to hear his feedback.

When our phone conversation turned to the seminar and his call outs, he went into what his observations were. He said in a surprised voice, “I am amazed that almost everybody I spoke to did not treat me like a cold caller, but rather they were actually looking forward to the seminar because they want to learn more about Social Security!” He also said that many of the consumers had questions for him on their particular situation while he was on the phone with them. He had to tell them, “We are going to cover that in the seminar.”

When he was done giving me his feedback on his first experience with Social Security seminars, I breathed a sigh of relief and told him what I will tell the readers of this column: Consumers are passionate about learning more about their Social Security. This is because there are very few credible places for them to go to get feedback/advice on their Social Security.

To me, one of the greatest ironies about the financial services business is the fact that Social Security is not a large part of our industry’s education apparatus. To demonstrate, If I were to pile up the books that I had to read in order to get my CLU® designation, CHFC® designation, CFP® designation, my life insurance license, my Finra Series 7 license, and also my Finra Series 66, it would be a stack probably two to three feet high. However, the total pages in all of those books that are dedicated to teaching us—the financial professional—about Social Security would probably amount to not much more than 100 pages, if that. There is no exaggeration in that statement.

This is ironic because Social Security represents the largest asset for many of the folks that we work with. As many know, over a couple’s lifetime, it is not uncommon to get $1 million in Social Security payments.

So you have an asset that is the largest asset that many households have, while at the same time it is one of the most complex assets that they have. And our industry has not educated these consumers on how to maximize that asset. That is ironic.

The good news is, that irony also represents opportunity for those financial professionals that wish to take advantage of it. As I laid out in the first paragraph, the opportunity is not some theoretical conclusion that I arrived at but rather a true need that these consumers have. I hear the questions from consumers everyday and I see the results from agents helping consumers with Social Security everyday. It is a huge need that you can help these consumers with and also make a great living with if you make sure you do a few things:

  1. Learn Social Security: It is complex but it is worth the trouble, I promise.
  2. Plug into a program that will get you in front of those consumers that need help and are qualified prospects. (Note: You do not have to spend $4,000, $5,000, $6,000 to get in front of 20+ people in a seminar room!)
  3. If you are not comfortable in front of people, get a mentor/partner that will do the seminars for you and also teach you how to do them.
  4. Use the right tools/software to help you with the backend implementation of the consumers’ Social Security maximization. Once the seminar is done, you need to help the attendees. How do you do it? By having the right tools and the right knowledge.
  5. Partner with an IMO that will help you, guide you, and mentor you on all of the above, from getting you in front of prospects all the way through joint Zoom calls with the prospects after the seminar.

One misperception that I hear a lot is, “But people that attend Social Security Seminars usually are not very affluent and therefore not an ideal client of mine.” I beg to differ. Of course socioeconomic factors are also a function of the profiling you conducted in your target marketing, but my experience says that if you have a room of 20 attendees that want to hear about Social Security, a few of them in the room will actually be millionaires.

Another misperception I hear about Social Security seminars is, “There is no way for an agent to make money when helping with Social Security optimization.” There are indeed ways to make a significant amount of money by helping consumers with Social Security. Afterall, much of maximizing Social Security from an after tax standpoint has to do with other assets that the client plans to draw from in retirement. Coordination between Social Security and those assets is of paramount importance. And those other assets are where the opportunity lies for financial professionals. And I would argue that if a consumer is given a choice on who to manage the assets between, a) ABC Brokerage Firm that doesn’t even know how to spell Social Security, and, b) a financial professional that just showed them how to get an additional $200k in Social Security benefits over their projected lifetime, that consumer will choose “b” almost every time.

Buckle Up! We Are Going To Create An Indexed Annuity!

Get out your financial calculators, spectacles, and your pocket protectors because we are going to have some fun with this column. We are going to create a product. Of course I am being somewhat facetious because there’s much more that goes into “creating a product” than just the numbers, such as: Non-forfeiture requirements, state filing, illustration parameters, surrender charges, MVAs, utilization rates, etc. I do not pretend to be an actuary, but I am about as “actuarial” as a sales guy can be. My wife tells me that’s like being the tallest elf.

Regardless, this elf is going to show you the not-so-basics of creating an indexed annuity with a “cap” based on today’s (October 7, 2022) interest rates and options prices. The purpose of this is to not make everybody into actuaries but rather to enable you to easily answer many questions about these products by having a deep understanding of how they are created.

Here is the product we—the insurance company—are going to create. This will be a 10-year indexed annuity that utilizes an annual reset S&P 500 strategy. This strategy has a “cap” that we will need to figure out based on today’s interest rates and options costs. This product will have a seven percent commission to the agent. Furthermore, we—the carrier—have shareholders that require a “return” on the company’s capital to the tune of eight percent (more on this later).

Agenda:

  1. Determine how much we, the insurance company, can get in yield when we invest that client’s money.
  2. Based on our IRR requirements from the shareholders, how much of a “spread” do we shave off the top of the yield that we are getting in bullet point number one above.
  3. We then take what is left of the difference of number one and number two above and that determines our call option budget.
  4. We take our call option budget, and we buy and also sell call options based on today’s option prices. Based on the pricing of call options, you and I will be able to identify what cap rate a person can get in today’s environment. Sounds pretty cool huh?

1: How Much Yield Do We Get?

First off, when a carrier takes a client’s $100k (example), that carrier will invest almost all of that money in the bond market. Although a lot of folks use the 10-year treasury as “the benchmark” for the yield rate, a better benchmark is the Moody’s Baa bond yield. This is because carriers generally invest more in corporate bonds than they do in Treasury bonds. Why? Because corporate bonds provide a higher yield. For instance, an index of “investment grade” corporate bonds might represent a 5.99 percent yield. This is much better than the 10-year Treasury bond that is currently yielding 3.88 percent. Thus, the reason corporates are favored over Treasuries.

Now that the insurance company knows that it can invest their money and earn approximately six percent on this money that is going into their “general account,” the carrier needs to allocate that money between the bonds and the call options. The bonds will be purchased to guarantee the money grows back to $100,000 every single year, regardless of what the S&P 500 does. This is how the carrier is able to support the policy guarantees. The call option chunk will give the indexed annuity the “link” to the stock market in the up years. Again, Bonds=Guarantees and Options=Upside.

2: The Carrier’s Cut

Before we calculate how much money goes to bonds and how much money goes to the call options, the carrier takes their cut… This is where the “carrier spread” comes in. That is, the carrier shaves a little off the top of that six percent (technically 5.99 percent in our example). That “spread” is how the carrier makes money. How much spread does the carrier require? It depends…

Our carrier has shareholders that require them to make a certain amount of money on the carrier’s capital. And make no mistake that putting a case on the books costs a carrier capital. Afterall, the carrier has to pay for the administration, paperwork, and the big one, agent commission. This is why if you have ever seen a carrier grow “too fast” they will shut off new sales.

There are various measurements on the amount of money the carrier makes off their investment, such as Return on Investment (ROI) and Internal Rate of Return (IRR).

To simplify this, let’s say that we, the carrier, pay $7,000 to put our $100,000 on the books, or seven percent. This is simplified because our agent commission is seven percent and there are technically more expenses than that but bear with me! If the carrier shareholders demanded an eight percent internal rate of return over the 10-year life of our product, what annual income would be required for the carrier to achieve that? If you put this in your financial calculator, it would require $1,043 per year to the carrier (PV=-7,000, N=10, %=8, FV=0, solve for PMT). In other words, by the carrier “investing” $7,000 of their own money, in order to get an eight percent return over the 10-year life of the product, that carrier would need 1.043 percent ($1,043) off the top of our six percent. Hence, a spread of 1.043 percent. (Note: In corporate finance you learn that if the IRR is greater than the carrier’s “cost of capital,” it is a project that is worthwhile. Hence, if a carrier borrows money at six percent and gets an IRR on that money/capital at eight percent, that is a product that has a positive “Net Present Value” and is good!)

For our example, let’s simplify the above and say that the carrier’s yield is six percent and the carrier spread that is required to keep the shareholders happy is simply one percent. No need to get crazy here with the decimals.

3. Calculating the Call Option Budget

After the carrier takes its one percent off the top, we have five percent to play with for our client and their $100,000. This is where we need to divide the money between the bonds and the call options. The bonds need to guarantee $100,000 at the end of every year to—again—support the policy guarantees. So, what dollar amount needs to go into the bonds—earning five percent—so that those bonds in the general account grow back to $100,000 at the end of the year? Hint: The correct answer is not $95,000! The correct answer is $95,238. Thus, if you add five percent to $95,238, you will get $100,000. So, if the insurance carrier is investing $95,238 in bonds, what are they doing with the other $4,762? Call options. We have arrived at our call option budget.

Review:
What have we done so far? So far, we have designed the commission level on the product at seven percent. We also calculated how much the carrier needs in spread to make the shareholders happy, and we have also arrived at our call option budget of 4.76 percent that will soon determine the cap. (Note: All of these calculations revolve around the interest rate of six percent—technically 5.99 percent. This is why indexed annuity pricing has gotten better over the past year.)

4. Buying and Selling Call Options to Arrive at Our “Cap”

So, we have $4,762 to buy call options that link our client’s $100,000 to the S&P500. That is a call option budget of 4.76 percent of our $100,000. So, the first thing we want to do is look at the prices of call options on the S&P 500 (SPX). We want this call option to give us all of the upside of the S&P 500 between now and 12 months from now, because our product is an “annual reset.” (Note: My discussion is going to be largely about percentages. The exact dollar amounts to link the client’s $100,000 would be just a function of buying multiples of what we are talking about below. The exact dollar amounts are not important. The call option budget percentages are important.)

Table 1 represents five rows—out of hundreds of rows—that represent today’s (10/8/22) option prices for an S&P 500 option that expires approximately one year from now. Because we want this option to give us growth on our client’s money from where the market is today (3,639), we need to find the “strike price” that is close to that number. In other words, we want to buy an “at the money” call option. So, we need to see what options sellers are “asking” for these options. It appears that we can buy an option for $432.10 on a S&P 500 value of 3,625. This call option represents a whopping 11.92 percent (432.10 divided by 3,625) of the “Notional Value” that is linked to the market! We have a problem here because our options budget is only 4.76 percent.

No fear, there is a solution here. That solution is that we can buy this option but then immediately sell another option that will give us back approximately 7.16 percent. This will ensure that our net options cost is only 4.76 percent. In other words, by us buying an option for 11.92 percent and selling one for 7.16 percent, our total net cost will be our options budget of 4.76 percent (11.92 percent-7.16 percent=4.76 percent).

So above, let’s buy the “at the money” option for 11.92 percent of the “notional value.”

Selling a Call Option
As you can see in the options pricing tables, the higher the “strike price” on call options, the cheaper they are. It is because the “strike price” represents the point in time where the option purchaser actually starts making money. Hence, “in the money.” So, if we are selling a call option, we want to go as far down the “strike price” as we can. This is because when the market increases to that number, that is the point that we will be giving the upside to somebody else! Ideally, we would just purchase the option that we already did above and not have to sell a call option. However, we don’t have the large call option budget to do that, therefore we must sacrifice some upside. So, let’s go down the list and see what we need to sell. We need to produce about $259.55 (7.16 percent of 3,625) so that we net out to our 4.76 percent budget.

We found something close! We can sell an option for $257.20 at a strike price of 3,950. What does this mean?

  • We netted out to a cost of $174.90 (Paid $432.10—Sold $257.20). This represents something very close to our call option budget—4.82 percent (174.90 divided by 3,625)
  • We just created a product with an approximate “cap” of nine percent. This is because we are participating in the upside of the market starting at 3,625 and handing off the upside “participation” in the market once it crosses over 3,950. 3,950 is approximately nine percent (8.97 percent technically) higher than 3,625.

What we have just done is created an indexed annuity that:

  1. Guarantees the client’s money will never be lost. This is because the carrier has the bonds that grow back the money to $100,000 every year, assuming rates stay the same.
  2. Gives the shareholders their IRR, assuming rates stay the same.
  3. Gives the carrier a 4.76 percent call option budget to buy the call options after they expire every year, assuming rates stay the same.
  4. Gives the carrier upside potential of nine percent that they can pass through to the client in the form of a “cap.”
  5. Pays the agent a seven percent commission.

Although my calculations are my own calculations and not specific to a carrier, the product I just explained with those caps, commission rates, etc, really does exist today. So, those calculations are not pie in the sky.

Technically, one of my favorite products is the same as what I laid out here, except the A-rated carrier just announced a cap increase to 10.5 percent for premiums over $100k! How can they do that? Numerous ways. Maybe the carrier is demanding less spread for themselves. Or maybe the carrier is able to get investments at higher yields than my six percent. Both of these would mean more call option budget.

I am fully cognizant that this was a three-coffee article for you to read, but I promise you, if you are serious about indexed products, this article will help you in the future when it comes to answering questions about “How do the carriers do it?.”

The Best Time To Use A CRM Was 20 Years Ago—The Second-Best Time Is Now!

I know, I know! That is not exactly how the old Chinese proverb went, but it was something like that! It was actually, “The best time to plant a tree was 20 years ago but the second-best time is now.“ What that proverb gets at is the power of investing time today with the foresight that you will ultimately get a benefit out of it. That awesome shade tree we sit under today was because somebody took the time 20 years ago to plant it.

In our business, slowing down and taking time to “plant trees” can be exceedingly difficult. I know that you know the feeling: You are going through the day trying to keep all of your customers happy while at the same time trying to bring in new customers, while at the same time putting out fires, while at the same time in meetings, while at the same time getting calls from wholesalers, etc., etc. Just merely coming up for a breath can be difficult. Then when you throw on top of it the time you should set aside to do extra reading, studying, working out, staying healthy, watching the Chiefs play (Steve?), etc., there are simply not enough hours in the day! Again, I know the feeling of having to focus on what is important while letting other things go. However, sometimes those “other things” can be trees that you should be planting…

With that said, there is one task that has become non-negotiable for me. This is a tree planting ceremony that I no longer sacrifice in the name of being “too busy.” This task has become just as important as taking breaths, because I have seen it pay off many many times. That is, entering customer and case data into my company’s CRM (Customer Relationship Management) system.

As a marketing organization that processes and manages the business of scores of agents, needless to say, a CRM system is important. However, even if you are a one man/woman shop, it should be important to you as well. I know this because I do personal production myself and have found that in my “personal production” role, I can’t live without it.

Many of you might be saying, “Duh Charlie! Of course, CRMs are important. All financial professionals should have their customer and policy data in an easily accessible program.” My response is twofold: 1. I would guess that it is not a large majority of agents that actually have a CRM; 2. Most importantly, I am not referring to just the basic common-sense stuff like client names, addresses, and policy information. I am also referring to certain “events” that take place over the life of an annuity or life insurance policy.

Annuity Events
When an agent writes an annuity case with my company, we will code into my CRM system what month, day, and year that annuity comes to the end of its term. We also have a running report that is automatically emailed to me–from my CRM–of the annuities that are hitting those dates over the next 60-days. Why one should do this is obvious. At the end of those periods, the clients will need help doing something else with that money. And you also get paid again. For instance, if a two-year multi-year guaranteed annuity was issued today, then 60 days prior to November 2024 I will be notified by my CRM that you, the agent, have X dollars coming up for renewal. I feel like Santa Claus sending the agents those emails. If it is an indexed annuity written, we will code into the CRM system when the end of the surrender period is.

Now that we are in an interest rate environment where short term annuities look very appealing, you will find that a two-year or three-year MYGA comes to the end of its surrender period surprisingly quick. Two or three years is a blink of an eye. So, plant that tree today so you can enjoy its shade when your CRM (or your IMO’s CRM) provides you with that renewal report.

Another area for annuities that we code into the system is when the guaranteed lifetime withdrawal benefits were illustrated to be activated. Of course, a good agent that does reviews every year will be able to know when the client would like to take their money, but sometimes annual reviews go by the wayside for some agents. By taking time to code these items in your CRM, or partner with a marketing organization that does this for you, you are planting a tree that will be very profitable in the future. RMD dates are important as well!

Life Insurance Events
If you sell term insurance, there is no better time to contact your clients than when they are about to lose their convertibility privileges.

To back up a bit, most term insurance policies allow a client to convert to a permanent policy later on at the health rating that they originally got on the term policy. So, even if the consumer got sick along the way but wants to “upgrade” to a permanent policy, they are still classified as “super preferred“ if that’s what the term insurance rating was. Imagine how many people during the “term“ of the term life insurance policy get sick prior to the end of the convertibility period. Well, when you or the marketing organization has that “end of conversion period date” coded into the system, which generates a report 60 days prior, imagine the opportunities there. On several occasions I have come across consumers that told me, “I recently learned that I could’ve switched to a permanent product a while back with my old health rating. I did not know this and missed the deadline.” Needless to say, these were not my clients that missed that deadline. My clients do not miss this deadline.

IUL Death Benefits and Values
IUL is often illustrated with an increasing death benefit (Option 2) that turns to a level death benefit (Option 1) sometime in the 23rd century. Sarcasm. Is that a point in time that you may want a reminder email from your CRM or your partner IMO? You bet!

In addition to the above, some CRM systems will allow you to code into the system the various policy values you illustrated by the end of the fifth year, tenth year, fifteenth year, etc. This is something that I have recently begun to do. This will allow my agents to have great conversations with their clients as these policy anniversaries approach. If the policy has actually performed at a rate beyond what was illustrated, that is an enjoyable conversation to have with clients!

Image by Pavlo from Pixabay

Multiple Product Lines: The Convenience Of Walmart But The Expertise Of The Mayo Clinic

On a monthly basis I get automatic reports that are generated from my CRM system. These reports are sorted out by the agents that work with my IMO and show what policies are coming to the end of the term within the next 60-days. For instance, a two year multi-year guaranteed annuity that was written two years ago represents an opportunity right now for my agent. Additionally, a term life policy coming to the end of its convertibility period represents an opportunity for my agent. This is what this report shows me. From there I am able to send the agent their report so they can reach out to their client and have that conversation. I feel like Santa Claus delivering these reports to my agents.

Anyway, as I was going through my report last month on two-year MYGAs that are reaching the end of the surrender period, I observed one agent that had three cases on this report that were coming to the end of their surrender periods. The total amount of these three annuities that were “coming due” represents about $950,000. Those are three great sales meetings that this agent will be having! But that is not the interesting part. The interesting part is, 30 months ago, this agent did not even know how to spell annuities! He was almost exclusively P&C. Now however, his business has taken on a life of its own. He has policies that are rolling over and, most importantly, he knows how to sell annuities to his massive P&C book of clients. How did all of this happen? Let’s back up and I will discuss.

The number one retailer in the United States is Walmart. The number one grocer in the United States is also Walmart. Now, Walmart is usually the cheapest around which is largely the reason for dominating in both areas, but I would argue that a lot of their “multi-offering” success is about convenience as well. Consumers have a limited amount of time, and it is nice to be able to buy that car battery they need while simultaneously grabbing what’s for dinner tonight. Making one trip is better than two. Plus, at Walmart, you have some great people-watching to keep you entertained, but I digress.

I mention the above example because I often work with agents who are very good in one area—annuities, life insurance, long term care—but not good in other areas. And if they are not fluent in those other areas, they completely disregard those other product lines while having conversations with their clients. Like everybody, agents tend to have a bias where they only want to talk about what they are comfortable with for fear that they are asked a zinger question that they don’t know the answer to. This is natural. Well, perfection is the enemy of progress many times. You don’t have to be perfect to merely get the client interested in a separate product line.

If you are an agent that works with my marketing organization, you will attest that I have been imploring everybody for some time now that if they have clients, they should be able to discuss with those clients annuities, life insurance, and long term care insurance—all three. That may sound daunting to some because we only have so much room in our brains, and it is hard to be an “expert” in multiple areas. Well, with what I am talking about, the goal is to just know enough to get the clients interested in the concept. And once they are interested, bring somebody into the equation that does know that product line. I promise you that you will make a lot of money if you get out of your comfort zone and start taking that step.

In this same Broker World issue, I discuss a little bit about partnerships and what are some recommended commission split structures. If the thought of partnering with another agent and splitting your commission with them makes you cringe, just know that many times you can have an IMO as one of your “partners” where a commission split may not apply. For instance, multiple times a week I am brought into the “three-way calls” with the agent and client via Zoom to discuss the concepts, ideas, and minute details that the agent may not have known. Because it is merely a Zoom call, there are no “splits” involved and is actually the best use of my time. If there are better uses of an IMO’s time than helping consumers with financial security while simultaneously helping agents make a great living, I would like to know what that is! The broad acceptance of Zoom calls is one of the few positives that COVID has brought about. I never would have thought that the average 65-year-old client would be fine with logging onto a Zoom call, but we are there.

But is the above scenario suboptimal? Would it be more optimal if you knew everything (annuities, life, long term care) so you did not have to get a third-party “expert” involved? I don’t believe so! There is power in discussing with your clients that you are a specialist in certain areas and have a “team” of other specialists that help you with the other product areas. Afterall, this is how one of the most credible clinics in the world operates, the Mayo Clinic.

If you are providing your clients with the convenience of Walmart but expertise like the Mayo Clinic, I promise you that you will make a lot of money. It is just a matter of finding the right partners and also the courage to broach the conversations in those areas that may be foreign to you. For my P&C agency that I started this column with, it took a lot of courage to start conversations about annuities, but he did, and now he is making a significant amount of revenue from annuities. And his clients view me as a part of his “team,” as I am.

Once you jump into these other product areas and get a couple of sales under your belt, your business will start to take on a life of its own. You will become more familiar with the sales concepts and product details via the best way possible–through observing an expert communicate the story to your clients. It may not be as exciting as observing the people at Walmart, but it is certainly more profitable.

Suggested Commission Split Structures For Agents

My dad, who was the wittiest and toughest person I ever knew, owned a construction business (underground utilities and concrete) for 40-years. As somebody who “dug ditches” since his early teens all the way up to his death, he had a way with words that I usually don’t repeat but I will here. He once told me jokingly, “How do you know when the deal was negotiated fairly for both sides? When both sides of the agreement feel that they have been screwed.” Now, that’s not something that you learn in business school, nor do I condone that method of thinking. He tended to say things for the effect.

Rather, I prefer the thought of both sides feeling that they received a fair deal. That is how you make for happy business partners and a sustainable and reputable business. I do believe that when agents partner with other agents and “split commissions” that there is a structure that—based on my experience—does exactly that. It makes both sides feel the deal is fair.

Oftentimes a “junior agent” might seek to partner with a veteran agent. The reasons for this partnership are obvious. If the junior agent cannot get the sale without the help of a veteran agent, it would be silly to not utilize a veteran (assuming one is available) even if it means that the junior agent would get less than 100 percent of the total compensation. As they say, 100 percent of $0 is zero compensation. By the way, if you are a junior agent and don’t have access to a “veteran agent,” partner with an IMO that will help you with the sale. In many cases—as with my IMO—there would generally not be a commission split unless I am hopping on an airplane.

A second scenario might be the inverse of the above. This is where a veteran agent will seek to partner with a junior agent. Why would a “rainmaker” want to partner with somebody junior? For the veteran agent to free up time to do what he/she does best—rainmaking. Thus the veteran agent may seek to offload some of the time-consuming legwork to a junior agent.

A third example may have nothing to do with junior versus veteran. It may be a scenario where an insurance agent is partnering with a CPA or an attorney. Many times the CPA has a captive audience and they just need an “insurance expert” to do the case design and also close the case for them.

These three scenarios are great business scenarios and very smart! They allow each individual to do what they do best while not trying to do a task that neither person is optimal at, while at the same time the junior advisor (or the CPA/Attorney) is learning from the veteran agent. The three scenarios are efficiency at its finest and what makes our industry’s compensation flexibility such a great thing. However, you must know what a fair “split” arrangement looks like so that neither party feels ripped-off.

So, what is a fair split arrangement? This is the main topic of this article.

The Million Dollar Round Table (MDRT) was the first—that I know of—to really prescribe a breakdown of what commission splits should look like. These commission split percentages that they recommended were generally based on the types of services that each agent would provide. The below breakdown is very similar to what the MDRT first came up with except for some slight verbiage changes that we applied. This is merely a guide, but I believe a very good guide.

  • 20 percent—Prospect Delivery: This is where the agent has brought the client to the table, whether through past relationships, a referral, or marketing activities.
  • 20 percent—Data Collection and Delivery: This is where the agent collects all the data needed for the sale (health information, financial information, fact finding) and also delivers material to the client that is needed prior to the sale.
  • 20 percent—Case Design: This is where the agent designs the strategy, which includes: running illustrations, modeling scenarios, seeking the right prices, organizing the end plan that is to be presented, etc.
  • 20 percent—Closing The Deal: This is where the veteran agent comes in many times to “make it rain.” This is where the final presentation/conversation occurs with the clients. This is the inflection point—the case/plan either gets implemented here or dies here!
  • 20 percent—Ongoing Service: This is the delivery of the policy, annual reviews, continuous updates for the clients, etc.

With the above being said, a common approach would be that the veteran helps close the sale. That would mean that the veteran could easily justify getting 20 percent and the junior agent getting 80 percent. If the veteran also did case design, then he/she might ask for 40 percent.

As an IMO, I work with scores of agents per week and they often ask me how they should get compensated on cases they “split” with other agents. I have never had an agency balk at the above MDRT method.

Volatility Controlled Strategies: Not Better, Not Worse

If you had a choice between inheriting 40 percent of Jim’s estate or 100 percent of Richard’s estate, which one would you choose? My answer is:

It depends…

Of course, this is a ridiculously vague question that requires more information in order for you to make the correct choice. Who are these people? How much does each person have? Etc. Choosing to inherit 100 percent of Jim’s estate with the minimal amount of information given above, just because 100 percent is larger than 40 percent, seems completely haphazard. Afterall, we know nothing about Jim and Richard!

Even though my example above may seem egregious, I do see these types of decisions being made every week when it comes to indexed products. My example above is equivalent to an agent or a client preferring an indexed product with a 100 percent participation rate over a product with a 40 percent participation rate, merely because 100 percent is larger than 40 percent.

A while back I posted on LinkedIn examples of the interest credits that my clients were currently receiving on their annual statements. This was to educate financial professionals that these indexed products are doing as they were designed to do. That is to beat the bank, not the stock market!!! Also, to provide security in an insecure world… That is when the anti-annuity trolls chimed in with accusations and also stating that, “It made no sense that the clients could be receiving that much interest when the BNP Paribas volatility-controlled index was not reflecting the extensive growth that I was communicating.” They basically accused me of lying. That is when I indicated that the annuity actually had a 190 percent participation rate over that statement period, which means the client got almost double the return that the actual index did. At that point they effectively accused me of lying about the fact that the product had a 190 percent participation rate. They made statements like, “What indexed annuities don’t have caps?” and, “It is impossible for the companies to give 190 percent participation rates on the market,” etc.

This LinkedIn exchange served as a great microcosm of the confusion that exists around caps, par rates, and volatility-controlled strategies. I will explain.

Very Basic Indexed Annuity Pricing
Although this logic below would also apply to indexed universal life, I will use annuities as an example. When the carrier invests the client’s money, whether a fixed annuity or a fixed indexed annuity, the “General Account” investments will give the carrier maybe five percent, for example, per year on that investment. Well, the notion with indexed annuities is that instead of the carrier giving the consumer a fixed rate of four percent (for example), what if that carrier took that four percent and instead bought call options each year with it? So, if a client paid $100,000 in premium, instead of getting $4,000 in interest that first year—as they would with a fixed rate annuity—what if that carrier bought call options with that $4,000 that are linked to a stock market index? What I just explained is the difference between a “Multi Year Guaranteed Annuity” and a “Fixed Indexed Annuity.” Also, in my example above, notice how the carrier made money? The carrier got five percent in interest from their General Account but passed through four percent to the client. The one percent difference is the “carrier spread.”

With a fixed indexed annuity, by the carrier taking that $4,000 and buying call options on a stock market index, the carrier is linking the client’s growth to that particular index—which will likely give the client much more upside potential than the $4,000 that the client could have otherwise received in a multi-year guaranteed annuity.

When the carrier goes to the investment bank to buy call options on the Index, the carrier only has a set amount of money, $4,000 in my example. That $4,000 is the call option budget that the carrier has to link the client’s $100,000 (notional value) to the index that the client’s product is based on. So, to greatly simplify, it is at that point where the investment bank effectively agrees to give the carrier a certain percentage of that index’s growth. For example, our client may get 40 percent of the growth in the S&P 500 index over the next year. That 40 percent is not 100 percent because the carrier only had $4,000, which only bought a 40 percent “Participation Rate.” The logic above can also apply to indexed annuities with caps. The only difference is that the insurance company might give the client an eight percent “cap” instead of a 40 percent participation rate. Again, I am using random numbers here. In either case, the par rates and caps are a way for the investment bank to limit the amount of money they have to pay out in exchange for the $4,000 option premium.

What if the index/market drops over a year’s time? The call options expire worthless for that particular year. The client gets no growth, but their $100,000 premium is still intact! That is when the carrier goes back to the investment bank the following year with another $4,000 (assuming the same interest rates) to buy additional call options. Year after year this process continues. (Note: The carriers do not call the investment banks on every case, like my simplified $100,000 example. They do it in multi-million dollar “tranches.” Also, carriers usually buy and sell options versus my simplified charts.)

The most important part above is that the “limiters” such as participation rates and caps are on the products because the investment banks can only offer so much upside potential on a particular index. Afterall, the investment bank is only getting $4,000 in my example.

Uncapped Is Not Unlimited
Let’s start with the client’s point of view and a mutual fund analogy. If your clients had a choice between the two mutual funds (Chart 1) to invest their money in, which would they prefer? The volatile blue mutual fund, or the more stable red mutual fund? Most agents would tell me that their clients would likely choose the red, because it is more stable! These agents are usually agents that work with more conservative and retirement-age clients.

Then I will throw a curveball to the agent and say, what if I had some magical way to get rid of all of the down years on these two mutual funds? Now which option would most of your clients choose (see Chart 2) after I black out the down years? The agents invariably come back and say, “I want to change my answer to the blue mutual fund!”

The reason they choose the blue is because there is no risk of the client losing their money, so why not go with the option that has the most upside potential?

What I just explained in my mutual fund analogy was the difference between a non-volatility-controlled index, like the S&P 500, and a volatility-controlled index that have proliferated over the last decade.

The S&P 500 index is quite simply 500 stocks, and as such can give significant upside potential and downside risk. However, when the index is in the wrapper of an indexed annuity, the downside disappears. Conversely, volatility-controlled strategies do have “some” equities included in the index but there are also components to limit the upside and the downside. Those components are: Cash, bonds, commodities, etc. The allocation of equities versus cash (etc.) in a volatility-controlled index depends on the index chosen. Furthermore, even within one particular volatility-controlled index the allocation ebbs and flows with how volatile the underlying equities are. As equities get more volatile, the allocation to equities decreases and vice versa. The main mission of these volatility-controlled indices is to target a certain level of volatility/standard deviation.

So, if most clients would choose the blue line in my mutual fund example, then is my point that the S&P 500 strategy is the better choice within indexed annuities? Not even close. This is because we have “limiters” like caps, par rates, and spreads in the indexed annuities that are harsher with the S&P 500 than the volatility-controlled indices. Why is this?

What is high potential gain for the client is high potential loss for the investment bank. The high volatility in the S&P 500 can subject the investment bank to significant risk for only $4,000 in call option premium. This is because the peaks are high on the blue. This is exactly why volatility impacts the cost of call options. The more volatile the respective index is, the more expensive the investment bank will make the options, all else equal. So, for the clients with indexed annuities that have a choice between the straight S&P 500 index or a volatility-controlled index, they will find that the S&P 500 index strategy will generally have more “limiters” of some sort like caps, participation rates, and spreads. Our client may also see that the “red” volatility-controlled index strategy does not have a “cap.” It may also have a 200 percent participation rate for example.

Which is better? 40 percent of the blue line or 200 percent of the red line? Or, the blue line with an eight percent cap or the red line that is “uncapped?” This circles us back to my analogy: Which is better, 40 percent of Jim’s estate or 100 percent of Richard’s estate? The answer is:

It depends…

Indexed Products Are Designed To Beat Fixed Rates, Not The Market

I have never had a client balk at my indexed annuity or indexed universal life insurance conversations when I tell them that the products are designed to do better than their fixed rate peers, not the stock market. I will tell them that if fixed rates on fixed annuities today are three or four percent, then over the long run they can expect to potentially get four, five, six, or seven percent in an indexed annuity. However, these are not guarantees. If the client balks at that conversation, then it is usually because the client is not the right fit for indexed annuities. For example, if I am talking with a 25-year-old kid who is expecting double digits between now and his retirement, then he will likely scoff at four, five, six, or seven percent. But that is OK because that tells me that he is a bad fit for this product type. Conversely, if I set the expectation that these products will perform for that 25-year-old the way he wants, I would be setting myself up for annual reviews that are as pleasant as colonoscopies. (Note: I would argue that indexed annuities as a bond alternative is something that even some younger folks should think about, but I digress.)

The fact that consumers are fine with indexed annuities, without having to inflate the story, is why I am perplexed when I see in marketing material or hear in a sales pitch how “XYZ product has performed 12 percent over the last ten-years.” To be clear, I have spoken about the true past performance of my clients’ indexed annuities and think that great past performance should be cheered. In fact, I am seeing biennial statements for a few of my clients that are indicating 20 percent interest credits over the last two years. So, am I speaking out of both sides of my mouth here? What is my problem with marketing “12 percent ten-year returns on XYZ Indexed Annuity?” A few things:

  1. There is a difference between stating what has truly happened and setting the expectation that it will happen in the future.
  2. It can be disingenuous: Many times, those returns are not true returns. In fact, oftentimes the product has not even been in existence for 10 years. So how are they marketing that? They are marketing that because that is what the illustrations are able to show. Per illustration regulations, the illustrations are able to show “back casted” performance over the last 10 years, as if that particular index and product had been in existence.
  3. The A-10 Warthog: That favorable “back casting” oftentimes is what the product was designed around. Like how the A-10 Warthog jet was designed around the giant 30 mm gatling gun, versus the gun being put into an already existing airplane, carriers oftentimes find—or create in partnership with an investment bank—indices that “back cast” beautifully and then design the product around that. As we all know by reading the Dalbar Studies, chasing history can be a losing proposition.
  4. It goes against basic economics. If a carrier is able to take a call option budget equal to, say, four percent of the entire premium and turn that four percent into a 12 percent return over a year, it is unsustainable. That is a 200 percent return on our call option budget! If many of the very smart people on Wall Street believed that the carriers’ call option strategies would consistently deliver 200 percent returns, they would swarm to those call options themselves and bid the prices up so high that the ultimate return on that call option strategy would be nowhere near 200 percent. Markets may not always be “efficient,” but I can guarantee that they are efficient enough to not allow 200 percent returns for very long.

These products are beautiful products and the time is right for these products, with the bond market (AGG) being down around 10 percent ytd. and the S&P 500 also being down double digits. Although in a down year a client has the potential to lose out on a four percent interest credit with indexed annuities, I do believe in the notion of “risk premium.” That is, if the carrier were to take that four percent and buy call options with it, they should be able to get more than that four percent back, over the long run. For example, over the long run stocks have done better than bonds, because of the fact that stockholders have always been rewarded for taking on that extra risk. I view the carrier’s call option budget no differently. The carrier may not always get a 200 percent “risk premium,” but an additional one, two or three percent to pass through to the clients on top of the original four percent call option budget would be nice. Said another way, indexed annuities have outperformed their fixed rate peers over the long run, and I believe they will continue to do so. Thus, the title of this column!