


If you had a choice between inheriting 40 percent of Jim’s estate or 100 percent of Richard’s estate, which one would you choose? My answer is:
It depends…
Of course, this is a ridiculously vague question that requires more information in order for you to make the correct choice. Who are these people? How much does each person have? Etc. Choosing to inherit 100 percent of Jim’s estate with the minimal amount of information given above, just because 100 percent is larger than 40 percent, seems completely haphazard. Afterall, we know nothing about Jim and Richard!
Even though my example above may seem egregious, I do see these types of decisions being made every week when it comes to indexed products. My example above is equivalent to an agent or a client preferring an indexed product with a 100 percent participation rate over a product with a 40 percent participation rate, merely because 100 percent is larger than 40 percent.
A while back I posted on LinkedIn examples of the interest credits that my clients were currently receiving on their annual statements. This was to educate financial professionals that these indexed products are doing as they were designed to do. That is to beat the bank, not the stock market!!! Also, to provide security in an insecure world… That is when the anti-annuity trolls chimed in with accusations and also stating that, “It made no sense that the clients could be receiving that much interest when the BNP Paribas volatility-controlled index was not reflecting the extensive growth that I was communicating.” They basically accused me of lying. That is when I indicated that the annuity actually had a 190 percent participation rate over that statement period, which means the client got almost double the return that the actual index did. At that point they effectively accused me of lying about the fact that the product had a 190 percent participation rate. They made statements like, “What indexed annuities don’t have caps?” and, “It is impossible for the companies to give 190 percent participation rates on the market,” etc.
This LinkedIn exchange served as a great microcosm of the confusion that exists around caps, par rates, and volatility-controlled strategies. I will explain.
Very Basic Indexed Annuity Pricing
Although this logic below would also apply to indexed universal life, I will use annuities as an example. When the carrier invests the client’s money, whether a fixed annuity or a fixed indexed annuity, the “General Account” investments will give the carrier maybe five percent, for example, per year on that investment. Well, the notion with indexed annuities is that instead of the carrier giving the consumer a fixed rate of four percent (for example), what if that carrier took that four percent and instead bought call options each year with it? So, if a client paid $100,000 in premium, instead of getting $4,000 in interest that first year—as they would with a fixed rate annuity—what if that carrier bought call options with that $4,000 that are linked to a stock market index? What I just explained is the difference between a “Multi Year Guaranteed Annuity” and a “Fixed Indexed Annuity.” Also, in my example above, notice how the carrier made money? The carrier got five percent in interest from their General Account but passed through four percent to the client. The one percent difference is the “carrier spread.”
With a fixed indexed annuity, by the carrier taking that $4,000 and buying call options on a stock market index, the carrier is linking the client’s growth to that particular index—which will likely give the client much more upside potential than the $4,000 that the client could have otherwise received in a multi-year guaranteed annuity.
When the carrier goes to the investment bank to buy call options on the Index, the carrier only has a set amount of money, $4,000 in my example. That $4,000 is the call option budget that the carrier has to link the client’s $100,000 (notional value) to the index that the client’s product is based on. So, to greatly simplify, it is at that point where the investment bank effectively agrees to give the carrier a certain percentage of that index’s growth. For example, our client may get 40 percent of the growth in the S&P 500 index over the next year. That 40 percent is not 100 percent because the carrier only had $4,000, which only bought a 40 percent “Participation Rate.” The logic above can also apply to indexed annuities with caps. The only difference is that the insurance company might give the client an eight percent “cap” instead of a 40 percent participation rate. Again, I am using random numbers here. In either case, the par rates and caps are a way for the investment bank to limit the amount of money they have to pay out in exchange for the $4,000 option premium.
What if the index/market drops over a year’s time? The call options expire worthless for that particular year. The client gets no growth, but their $100,000 premium is still intact! That is when the carrier goes back to the investment bank the following year with another $4,000 (assuming the same interest rates) to buy additional call options. Year after year this process continues. (Note: The carriers do not call the investment banks on every case, like my simplified $100,000 example. They do it in multi-million dollar “tranches.” Also, carriers usually buy and sell options versus my simplified charts.)
The most important part above is that the “limiters” such as participation rates and caps are on the products because the investment banks can only offer so much upside potential on a particular index. Afterall, the investment bank is only getting $4,000 in my example.
Uncapped Is Not Unlimited
Let’s start with the client’s point of view and a mutual fund analogy. If your clients had a choice between the two mutual funds (Chart 1) to invest their money in, which would they prefer? The volatile blue mutual fund, or the more stable red mutual fund? Most agents would tell me that their clients would likely choose the red, because it is more stable! These agents are usually agents that work with more conservative and retirement-age clients.
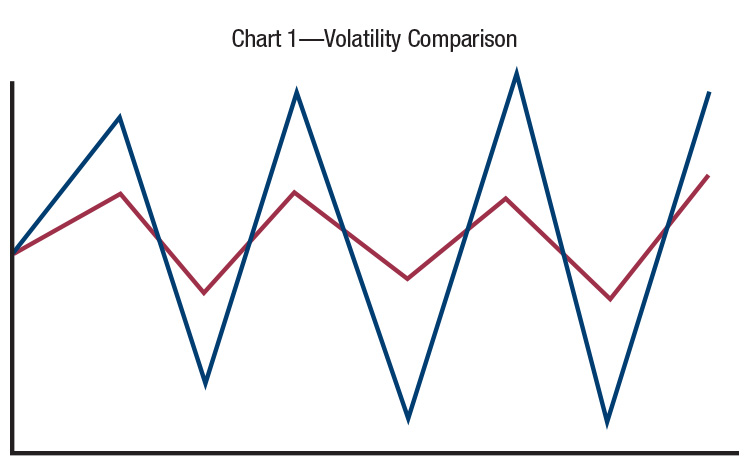
Then I will throw a curveball to the agent and say, what if I had some magical way to get rid of all of the down years on these two mutual funds? Now which option would most of your clients choose (see Chart 2) after I black out the down years? The agents invariably come back and say, “I want to change my answer to the blue mutual fund!”
The reason they choose the blue is because there is no risk of the client losing their money, so why not go with the option that has the most upside potential?
What I just explained in my mutual fund analogy was the difference between a non-volatility-controlled index, like the S&P 500, and a volatility-controlled index that have proliferated over the last decade.
The S&P 500 index is quite simply 500 stocks, and as such can give significant upside potential and downside risk. However, when the index is in the wrapper of an indexed annuity, the downside disappears. Conversely, volatility-controlled strategies do have “some” equities included in the index but there are also components to limit the upside and the downside. Those components are: Cash, bonds, commodities, etc. The allocation of equities versus cash (etc.) in a volatility-controlled index depends on the index chosen. Furthermore, even within one particular volatility-controlled index the allocation ebbs and flows with how volatile the underlying equities are. As equities get more volatile, the allocation to equities decreases and vice versa. The main mission of these volatility-controlled indices is to target a certain level of volatility/standard deviation.
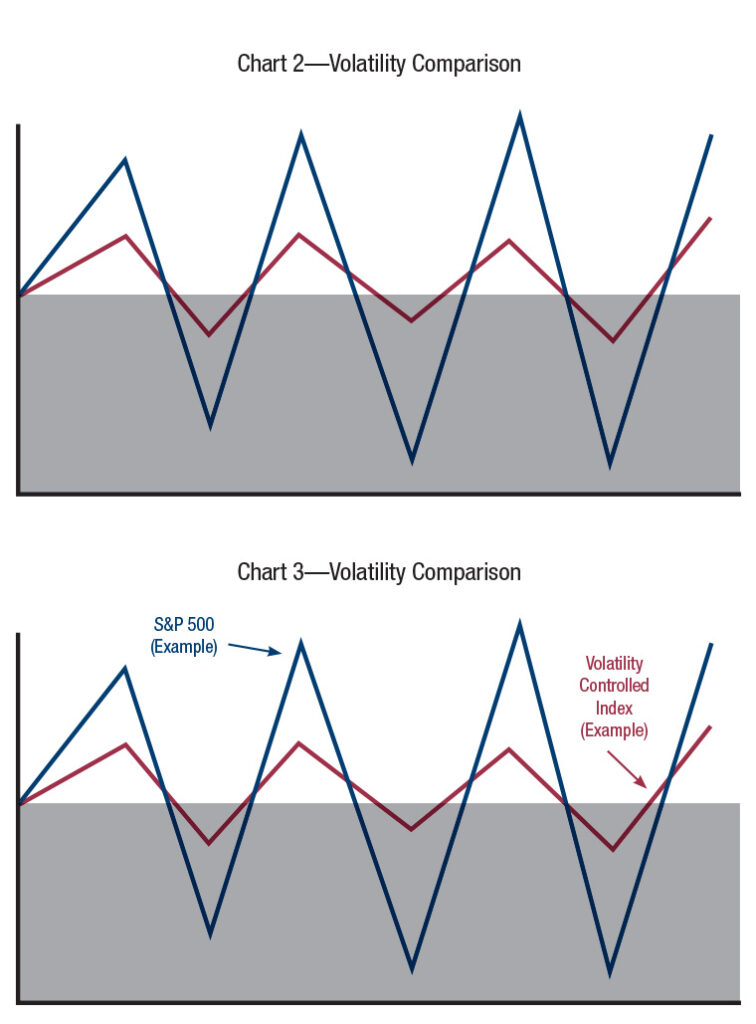
So, if most clients would choose the blue line in my mutual fund example, then is my point that the S&P 500 strategy is the better choice within indexed annuities? Not even close. This is because we have “limiters” like caps, par rates, and spreads in the indexed annuities that are harsher with the S&P 500 than the volatility-controlled indices. Why is this?
What is high potential gain for the client is high potential loss for the investment bank. The high volatility in the S&P 500 can subject the investment bank to significant risk for only $4,000 in call option premium. This is because the peaks are high on the blue. This is exactly why volatility impacts the cost of call options. The more volatile the respective index is, the more expensive the investment bank will make the options, all else equal. So, for the clients with indexed annuities that have a choice between the straight S&P 500 index or a volatility-controlled index, they will find that the S&P 500 index strategy will generally have more “limiters” of some sort like caps, participation rates, and spreads. Our client may also see that the “red” volatility-controlled index strategy does not have a “cap.” It may also have a 200 percent participation rate for example.
Which is better? 40 percent of the blue line or 200 percent of the red line? Or, the blue line with an eight percent cap or the red line that is “uncapped?” This circles us back to my analogy: Which is better, 40 percent of Jim’s estate or 100 percent of Richard’s estate? The answer is:
It depends…










Suggested Commission Split Structures For Agents
My dad, who was the wittiest and toughest person I ever knew, owned a construction business (underground utilities and concrete) for 40-years. As somebody who “dug ditches” since his early teens all the way up to his death, he had a way with words that I usually don’t repeat but I will here. He once told me jokingly, “How do you know when the deal was negotiated fairly for both sides? When both sides of the agreement feel that they have been screwed.” Now, that’s not something that you learn in business school, nor do I condone that method of thinking. He tended to say things for the effect.
Rather, I prefer the thought of both sides feeling that they received a fair deal. That is how you make for happy business partners and a sustainable and reputable business. I do believe that when agents partner with other agents and “split commissions” that there is a structure that—based on my experience—does exactly that. It makes both sides feel the deal is fair.
Oftentimes a “junior agent” might seek to partner with a veteran agent. The reasons for this partnership are obvious. If the junior agent cannot get the sale without the help of a veteran agent, it would be silly to not utilize a veteran (assuming one is available) even if it means that the junior agent would get less than 100 percent of the total compensation. As they say, 100 percent of $0 is zero compensation. By the way, if you are a junior agent and don’t have access to a “veteran agent,” partner with an IMO that will help you with the sale. In many cases—as with my IMO—there would generally not be a commission split unless I am hopping on an airplane.
A second scenario might be the inverse of the above. This is where a veteran agent will seek to partner with a junior agent. Why would a “rainmaker” want to partner with somebody junior? For the veteran agent to free up time to do what he/she does best—rainmaking. Thus the veteran agent may seek to offload some of the time-consuming legwork to a junior agent.
A third example may have nothing to do with junior versus veteran. It may be a scenario where an insurance agent is partnering with a CPA or an attorney. Many times the CPA has a captive audience and they just need an “insurance expert” to do the case design and also close the case for them.
These three scenarios are great business scenarios and very smart! They allow each individual to do what they do best while not trying to do a task that neither person is optimal at, while at the same time the junior advisor (or the CPA/Attorney) is learning from the veteran agent. The three scenarios are efficiency at its finest and what makes our industry’s compensation flexibility such a great thing. However, you must know what a fair “split” arrangement looks like so that neither party feels ripped-off.
So, what is a fair split arrangement? This is the main topic of this article.
The Million Dollar Round Table (MDRT) was the first—that I know of—to really prescribe a breakdown of what commission splits should look like. These commission split percentages that they recommended were generally based on the types of services that each agent would provide. The below breakdown is very similar to what the MDRT first came up with except for some slight verbiage changes that we applied. This is merely a guide, but I believe a very good guide.
With the above being said, a common approach would be that the veteran helps close the sale. That would mean that the veteran could easily justify getting 20 percent and the junior agent getting 80 percent. If the veteran also did case design, then he/she might ask for 40 percent.
As an IMO, I work with scores of agents per week and they often ask me how they should get compensated on cases they “split” with other agents. I have never had an agency balk at the above MDRT method.