The 2020 Milliman Long Term Care Insurance Survey is the 22nd consecutive annual review of stand-alone long term care insurance (LTCI) published by Broker World magazine. It analyzes the marketplace, reports sales distributions, and describes available products, including group insurance.
More analysis of worksite sales will appear in the August issue of Broker World magazine.
Unless otherwise indicated, references are solely to U.S. stand-alone LTCI sales, excluding exercised future purchase options (FPOs) or other changes to existing coverage. “Stand-alone” refers to LTCI policies that do not include death benefits (other than returning premiums upon death or waiving a surviving spouse’s premiums) or annuity or disability income benefits. Where referenced, “combo” products provide LTCI combined with life insurance or annuity coverage. “Linked benefit” policies are combo policies which can allow more than the death benefit or annuity account value to be used as LTCI.
Highlights from this year’s survey
Participants
Nine carriers participated broadly in this survey. Six others provided sales information so we could report more accurate aggregate industry individual and multi-life sales.
We estimate our statistical distributions reflect about 75 percent of total industry policies sold (85 percent of premium) but only about 12 percent of worksite policies sold (28 percent of premium). Our worksite statistical distributions can vary significantly from year-to-year because insurers focusing on particular worksite markets may be over- or under-represented. Last year, we commented that the worksite business in our statistical analysis was overly weighted toward executive carve-out programs. This year, that imbalance has increased. The carriers which provided 2019 statistical data had an average worksite annual premium of $4,568 whereas the ones which provided only total sales had an average worksite premium of $1,627. The corresponding 2018 averages were $2,015 and $1,561, respectively. In 2017, the difference was in the other direction ($1,015 and $1,441, respectively).
National Guardian Life contributed statistical distributions for the first time, but CalPERS and Genworth did not provide statistical distributions this year. Country Life, which has been a consistent participant in this survey, discontinued LTCI sales effective May 1, 2020.
The insurers displayed in the Product Exhibit all provided broad statistical information, although they were not all able to provide all the data we requested. Northwestern also provided such information. Auto-Owners, CalPERS, Genworth, LifeSecure, Transamerica and United Security Assurance contributed total and worksite sales (new premium and lives insured) but did not provide other information. However, in a few places we were able to reflect some of their product designs in our statistical distributions.
Sales Summary
- The 15 carriers reported sales of 54,563 policies and certificates (“policies” henceforth) with new annualized* premium of $170,770,732 (including exercised FPOs) in 2019, which compared to 2018 industry sales of 56,287 policies with new annualized* premium of $169.7 million (both slightly restated from last year’s report), a 3.1 percent drop in the number of policies but a 0.6 percent increase in new annualized premium, the first increase in new premium since 2012. As noted in the Market Perspective section, sales of policies combining LTCI with other risks dropped slightly. *Single premium sales are counted at 10 percent for the annualized premium calculations herein.
- Seven of the top 10 insurers sold more new premium than in 2018, while four sold more new policies. This difference resulted largely because elected FPOs add premium but not new policies.
- Worksite LTCI rebounded in 2019. The three stand-alone LTCI carriers specializing in worksite each saw sales jump by 62 to 76 percent despite increased competition from a major new carrier and from linked-benefit policies.
- With FPO elections included in new premium, Northwestern garnered the number one spot in sales. Mutual of Omaha was a strong second and had a large lead in annualized premium from new policies sold. Together, these two companies combined for 59 percent of new premium including FPOs, compared to 57 percent last year.
- Based on our analysis, for the fifth straight year (and fifth time ever), our participants’ number of inforce policies dropped, but less than one percent.
- Despite the reduced number of policies and increased number of policies in paid-up status, inforce premium increased 10.0 percent and the average inforce premium per policy rose from $2,208 to $2,426. Inforce premium rises due to sales, price increases, and benefit increases (including FPOs), and reduces from lapses, reductions in coverage, deaths, and shifts to paid-up status for various reasons.
Participants’ claims rose 8.1 percent. Overall, the stand-alone LTCI industry incurred $11.6 billion in claims in 2018 based on companies’ statutory annual filings, raising total incurred claims from 1991 through 20187 to $141.5 billion. (Note: 2018 was the most recent year available when this article was written.) Most of these claims were incurred by insurers that no longer sell LTCI. The reported 2018 incurred claims are 5.5 percent higher than the $11.0 billion of incurred claims reported in 2017.
The placement rate rose to 59.2 percent, higher than 58.8 percent in 2018 and 59.0 percent in 2017. The small increase occurred despite the increase in average age. The more favorable and faster underwriting decisions documented below contributed to the higher placement rate. As discussed in the Market Perspective section, the industry may be able to increase placement rates further, which should make financial advisors more comfortable suggesting that their clients consider LTCI, all else equal.
About the Survey
This article is arranged in the following sections:
- Highlights provides a high-level view of results.
- Market Perspective provides insights into the LTCI market.
- Claims presents industry-level claims data.
- Sales Statistical Analysis presents industry-level sales distributions reflecting data from 11 insurers.
- Partnership Programs discusses the impact of the state partnerships for LTCI.
Available at www.BrokerWorldMag.com:
- Product Exhibit shows, for eight insurers: Financial ratings, LTCI sales and inforce, and product details. Please note that, during the COVID-19 pandemic, some insurers have temporarily discontinued sales that would require face-to-face interviews. Our Exhibit ignores such temporary restrictions.
- Product Details, a row-by-row definition of the product exhibit entries, with some commentary.
- Premium Exhibit shows lifetime annual premiums for each insurer’s most common underwriting class, for issue ages 40, 50, 60, and 70 for single females, single males, and heterosexual couples (assuming both buy at the same age), based on $100 per day (or closest equivalent weekly or monthly) benefit, 90-day facility and most common home care elimination period, three-year and five-year benefit periods or $100,000 and $200,000 maximum lifetime buckets, with and without Shared Care and with flat benefits or automatic 3 or 5 percent annual compound benefit increases for life. Worksite premiums do not reflect any worksite-specific discount, though some carriers offer this.
- Premium Adjustments (from our Premium Exhibit prices) by underwriting class for each participant.
- Distribution by underwriting class for each participant
- State-by-state results: percentage of sales by state, average premium by state and percentage of policies qualifying for Partnership by state.
Market Perspective (more detail in subsequent parts of the article)
- Since 2009 (varies by jurisdiction), if an insurer concludes that a claimant is not chronically ill, the insurer must inform the claimant of his/her right to appeal the decision to independent third-party review (IR). The IR determination is binding on insurers. As shown in our Product Exhibit, most participants have extended IR beyond statutory requirements, most commonly to policies issued prior to the effective date of IR. It is hard to get data relative to IR. Regulators do not collect statistics and insurers often do not track it. It has been a positive sign that few IR requests have been made and that insurers seem to have been upheld approximately 90 percent of the time based on data we have received over the years from insurers and from Steve LaPierre, President of LTCI Independent Eligibility Review Specialists, LLC (LTCIIERS). Mr. LaPierre reported a 40 percent drop in IR requests in 2019, but an increase to approximately 30 percent of cases in which insurers were overruled. Part of the increase may be explained by statistical fluctuation because the number of IRs is low. Generally, if the appeal rate drops, the strongest cases are likely to continue to be appealed, resulting in a higher percentage being overruled. Another factor, in the experience of one of the authors, is claims examiners’ unfamiliarity with old policy forms in which standard wording was modified to fit a state-specific requirement, a problem that can be exacerbated if the claim function is transferred to a new entity lacking the historical knowledge. Because the number of IRs is so low, even a small percentage of such errors could cause the IR overturn rate to spike.
- Third Party Notification (TPN) provisions provide another consumer protection. When someone incurs dementia, bills often accumulate unpaid. Under contract law, insurers could then terminate policies for non-payment of premium, despite the cause of non-payment being unknown claim qualification. In response to this issue, insurers and regulators agreed long ago to encourage applicants to name a third-party who must be notified before a policy can be terminated for non-payment of premiums. Insurers do not contact such a third-party until the grace period is over, and then provide at least another 30 days for the third-party to stave off cancellation. Every two years, insurers give policyholders an opportunity to update the contact information or change the third party. The benefit of this provision to policyholders often receives little attention, perhaps partly because no one seems to have ever studied the impact.
This year, we asked some one-time questions related to TPNs. Only two participants were able to provide data. One had TPNs identified for 63 percent of its inforce policies and the other had TPNs identified for 77 percent of its policies. One-fifth of the policyholders who had identified a TPN increased their protection by identifying more than one TPN. Only about 10 percent of single purchasers have named a TPN, despite seemingly having a greater need for a TPN. Financial advisors could serve an important role by stressing the importance of a TPN for single people. Not surprisingly, fewer than half of the policies with third-party billing have TPNs. Thus direct-billed policies and couples have distinctly higher percentages of TPNs than indicated above. - Current prices are more stable than past prices because today’s prices reflect much more conservative assumptions based on far more credible data1 and lower assumed investment yields. Many financial advisors presume that new policies will face steep price increases, hence can be reluctant to encourage their clients to consider LTCI. Although three participants have never increased premiums on policies issued under “rate stabilization” laws, it may take a long time before the market is comfortable that prices are stable.
- Linked benefit products have increased market share, due to influences such as: i) regardless of whether the policyholder has a long-term care claim, their family will receive benefits, ii) they often have guaranteed premiums and benefits, iii) they no longer need to be funded with single premiums; and iv) they are issued to younger ages than before.
According to LIMRA, in the first half of 2019 (the most recent data available when this article went to print), combination life sales dropped slightly, even in the recurring-premium market which continued to gain market share compared to single premiums. The biggest drop (six percent both in premium and policies) was in the Chronic Illness market. - As noted earlier, roughly 59 percent of applications have resulted in placed policies in the past three years, with the low placement rates contributing to financial advisors being hesitant to recommend that clients consider LTCI. The industry may be able to improve placement rates in a variety of ways.
- Utilize E-applications for faster submission and reduced processing time by assuring that all apps are “in good order.” The speed and accuracy increase placement. It would be helpful if brokerage general agents could populate an eApp with quote information, then forward that partial eApp to the broker for completion.
- Pre-qualify an applicant’s health. It is important to stress the importance of such pre-qualification to advisors and prospects and to continue to find effective ways to accomplish quality pre-qualification.
- More effective education of their distribution system by insurers, such as with drill-down questions in on-line underwriting guides and eApps.
- Require cash with the application (CWA), which led to about five percent more of the apps getting placed according to our 2019 survey.
- Continue to improve messaging regarding the value of LTCI and of buying now (rather than in the future). Such messaging would increase the number of applications and improve the placement rate by attracting younger and healthier applicants.
- Over the past two years, 79 percent of our participants’ policyholders exercised their FPO (future purchase option, a guarantee that, under specified conditions, a policyholder can purchase additional coverage without having to demonstrate good health). As both the additional coverage and price per unit increase over time, such options become increasingly expensive, even more so with the price increases that the industry has experienced. The high election rate demonstrates the importance of the coverage to the policyholder and the effectiveness of annual (as opposed to triennial) negative-election FPOs (negative-election FPOs activate automatically unless the client rejects them, as opposed to positive-election FPOs which activate only if the client makes a request). At least in some markets and with some designs, policyholders reliably exercise FPOs when they must do so to continue to receive future offers. Considering such FPOs and other provisions, we project a maximum benefit at age 80 of $306/day for an average 58-year-old purchaser in 2019, which is equivalent to an average 2.9 percent compounded benefit increase between 2019 and 2041. Purchasers may be disappointed if the purchasing power of their LTCI policies deteriorates over time.
- Only four participants offer coverage in all U.S. jurisdictions and no worksite insurer does so. Insurers continue to be reluctant to sell in jurisdictions which are slow to approve new products, restrict rate increases, or have unfavorable legislation or regulations.
- Eight of our nine participants use third party administrators (TPAs) and seven use reinsurers. We thank American United, LifeCare Assurance, Manufacturers, Munich American, RGA, Wilton Re, Long-Term Care Group, Life Plans, and CHCS for their contributions to the LTCI industry. Other reinsurers and TPAs support insurers not in our survey. In some cases, affiliated companies provide reinsurance or guarantees.
- As we reported last year, the NAIC adopted a significantly improved 2019 version of the Shopper’s Guide, covering combination products as well as stand-alone LTCI and adding other information, while reducing the number of pages from 80 to 76. We asked last year’s readers to email claude.thau@gmail.com to comment on the new Guide and how (much) it is used to educate consumers. We received no comments. This year, we polled insurers; their answers suggest they view the Shopper’s Guide primarily as a regulatory requirement. Their suggestions to improve the usefulness for consumers included shortening it, linking to it from state department of insurance websites, and regulators using the guide in a campaign to encourage long term care planning. We visited 31 jurisdiction websites to see if they linked to the NAIC Shopper’s Guide. We found that 13 jurisdictions use their own guides. Five (plus the Federal government) link to the 2019 NAIC Guide, while four link to the 2013 NAIC Guide. One state links to an AHIP Guide, and we found no guide or minimal wording in the remaining eight states.
Claims
- Eight participants reported 2019 claims. As some companies are not able to provide detailed data, some statistics are more robust than others.
- The eight insurers’ combined claim payments on individual policies rose 8.1 percent in 2019 over 2018, despite only a 0.2 percent increase in inforce policies and a 3.7 percent increase in their inforce premium.
- The LTCI industry has had a much bigger impact than indicated above, because a lot of claims are paid by insurers that do not currently sell LTCI or did not submit claims data to us.
LTCI claims paid by insurers no longer selling LTCI may differ significantly from the following statistics as their claimants are more likely to have facility-only coverage, be older, etc.
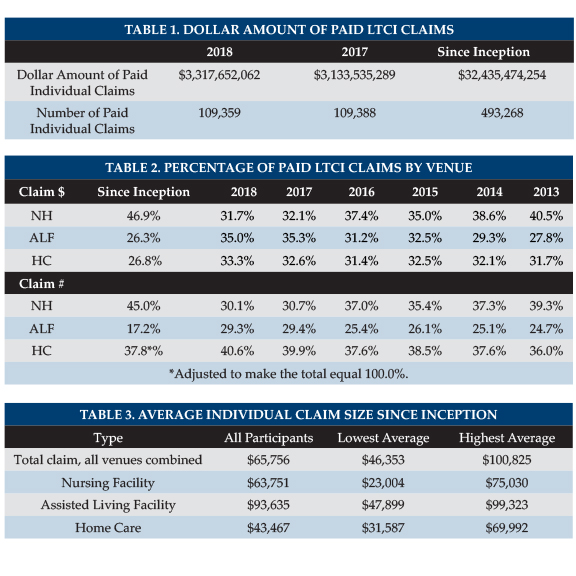
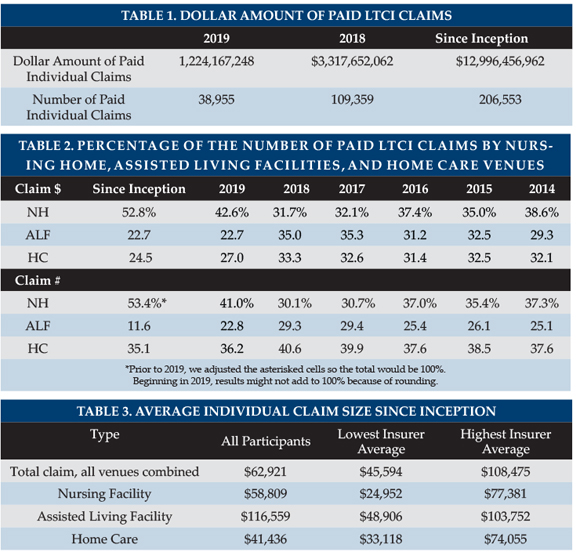
Table 1 shows the total dollar and number of reported individual LTCI claims. The large drop in claims is primarily the result of having Genworth data in 2018 but not in 2019.
Table 2 shows the distribution of those claims by venue, which have shifted away from nursing homes over the years (except in 2019) due to consumer preferences and more claims coming from comprehensive policies. Regarding the change in 2019, we note that, for insurers that contributed data in both 2018 and 2019, the number of claims in nursing homes dipped 0.6 percent following the prior years’ patterns.
The inception-to-date data shows 53.3 percent of the number of claims being in Nursing Homes (vs. 45.0 percent last year). Here again, if we limit data to insurers reporting each year, we see a drop of 0.8 percent instead of an increase of 8.3 percent. Surprisingly, the inception-to-date number of claims is more weighted to Nursing Home than the dollar of claims. The nursing home claims seem to come from older policies with lower minimums.
In the distribution based on number of claims, a person who received care in more than one venue is counted once for each venue, but not double-counted in the total line.
Seven carriers reported their number of open individual claims at year-end, ranging between 59 and 107 percent of the number of claims paid during the year, averaging 75 percent overall. The insurer reporting 107 percent noted that they include open claims that have had no payments made yet. With that carrier excluded, the overall ratio was 76 percent.
Table 3 shows average size individual claims since inception. Because 41 percent of claimants since inception have submitted claims from more than one type of venue, the average total claim generally exceeds the average claim paid for any particular venue. Nonetheless, individual Assisted Living Facility (ALF) claims stand out as high each year, probably because:
a) ALF claims appear to have a longer duration compared with other venues.
b) Nursing home costs are most likely to exceed the policy daily/monthly maximum. Hence the maximum daily benefit negates part of the additional daily cost of nursing homes.
c) People who maximize the use of their maximum monthly benefits can generally spend as much in an ALF as in a nursing home.
d) Although some surveys report that ALFs cost about half as much as nursing homes on average, ALFs often charge more for a memory unit or for levels of assistance that align more closely with nursing home care. Upscale ALFs seem to cost a higher percentage of upscale nursing home costs than the average ALF/nursing home ratio.
Several insurers extended ALF coverage to policies which originally did not include ALF coverage. Providing these additional benefits provides the policyholder with significant flexibility at time of claim, but has contributed to the insurers’ need for rate increases.
The following factors contribute to a large range of average claim results by insurer (see Table 3):
- Different markets (by affluence; worksite vs. individual; geography; etc.).
- Demographic differences (distribution by gender and age).
- Distribution by benefit period, benefit increase feature, shared care and elimination period.
- Distribution by facility-only policies vs. 50 percent home care vs. 100 percent home care vs. home care only, etc.
- Different lengths of time in the business.
The following factors cause our average claim sizes to be understated.
- For the carriers reporting claims this year, 11 percent of the inception-to-date individual claims are still open. Our data does not include reserve estimates for future payments on open claims.
- People who recover, then claim again, are counted as multiple insureds, rather than adding their various claims together.
Besides being understated, average claim data does not reflect the value of LTCI from some purchasers’ perspectives, because the many small claims drive down the average claim. LTCI can provide significant financial return for people who need care one year or longer. The primary purpose of insurance is to protect against adverse results, so the amount of protection, as well as average claim, is important.
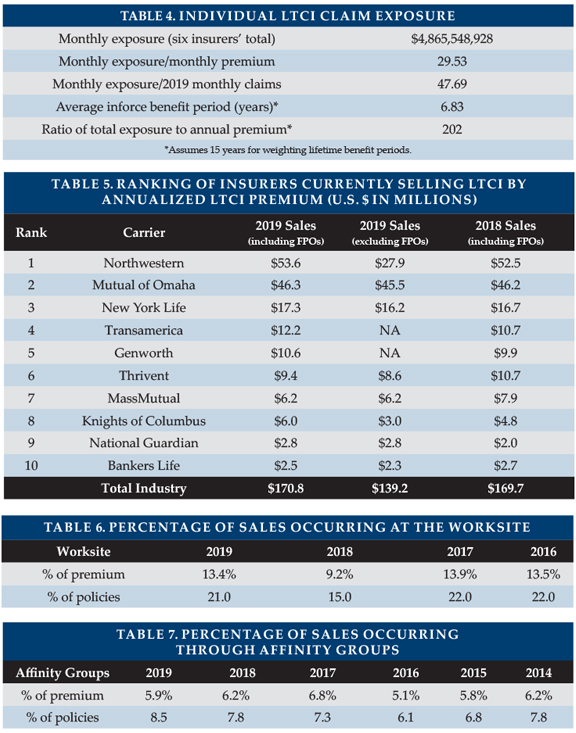
Six insurers provided their current individual (excludes group) monthly LTCI claim exposure, which exceeds $4.8 billion (note: reflects only initial monthly maximum for one insurer). As shown in Table 4, this figure is thirty times their corresponding monthly LTCI premium income and more than 47 times their 2019 LTCI monthly paid claims.
Eight insurers contributed data regarding their inforce distribution by benefit period. Treating endless (lifetime benefit periods) as a 15-year benefit period, we found that their average inforce benefit period is 6.8 years. Changing the assigned value of the endless benefit period by one year has an impact of approximately .25 years on the average inforce benefit period. With annual exposure thirty times annual premium and assuming an average benefit period of about 6.8 years, we estimate that total exposure is 202 times annual premium.
Four insurers reported their current average individual maximum monthly maximum benefit for claimants, with results ranging from $4,696 to $6,552.
Nursing home (NH) claims are more likely to use the policy’s maximum daily/monthly benefit than ALF claims, because ALF costs are generally lower and because policies sometimes have lower maximums for ALFs. ALF claims correspondingly are more likely to use the policy maximum than are adult day care and home care claims.
STATISTICAL ANALYSIS
Nine insurers contributed significant background data, but some were unable to contribute data in some areas. Six other insurers (Auto-Owners, CalPERS, Genworth, LifeSecure, Transamerica and United Security) contributed their number of policies sold and new annualized premium, distinguishing worksite from other sales, but not clarifying whether FPOs were included in the premium.
Sales characteristics vary significantly among insurers based on market differences (individual vs. worksite, affluence, gender distribution, etc.). Year-to-year variations in policy feature distributions may reflect changes in participants, participant practices and designs, participant or worksite market shares and industry trends.
Market Share
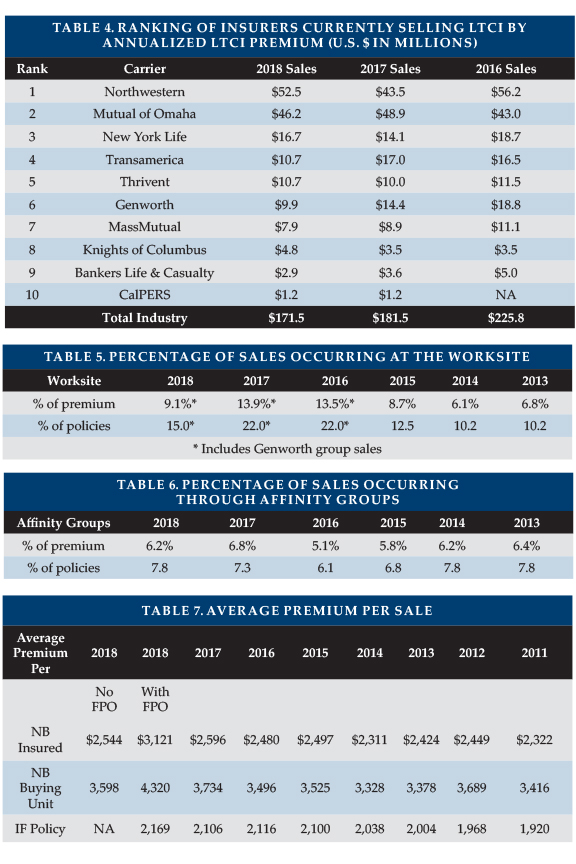
We include purchased increases on existing policies in new premium (we call them FPOs and include board-approved increase offers) because new coverage is being issued. However, looking at new premiums ignoring FPOs spotlights insurers with more new policy sales. Table 5 lists the top 10 participants in 2019 new premium including FPOs and shows their sales (if submitted) without FPOs. Northwestern ranks #1 including FPOs, with Northwestern and Mutual of Omaha accounting for 59 percent of the market. Ignoring FPOs, Mutual of Omaha is #1, 63 percent ahead of #2 Northwestern. The premium includes 100 percent of recurring premiums plus 10 percent of single premiums.
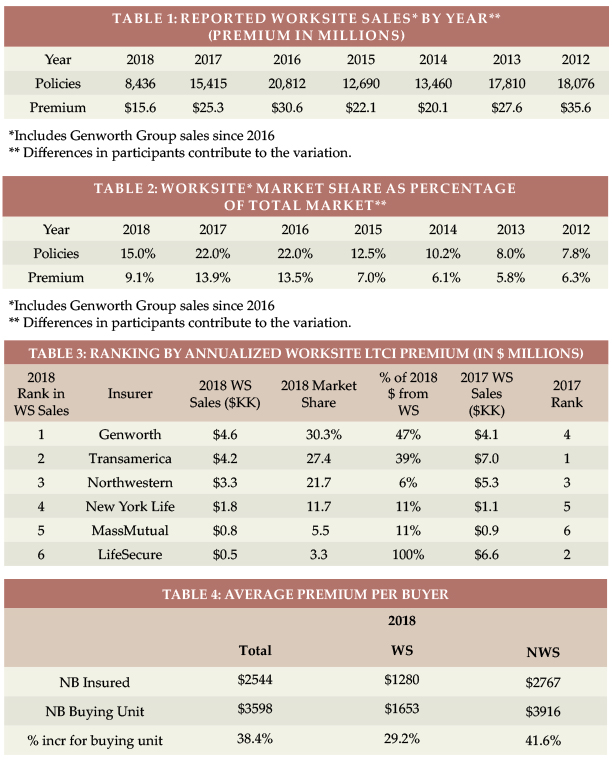
Worksite Market Share
The three stand-alone LTCI carriers specializing in worksite each saw sales jump by 62 to 76 percent despite increased competition from a major new carrier and from linked-benefit policies. Thus, worksite business produced 21.0 percent of new insureds (see Table 6) and 13.4 percent of new annual premium (including FPOs but excluding single premium). Worksite sales consist of three different markets, the first two of which produce a higher percentage of new insureds than of new premiums:
- Voluntary group coverage generally is less robust than individual coverage.
- Core/Buy-Up programs have particularly young age distributions and modest coverage because a lot of people do not buy-up and are less likely to insure spouses.
- Executive carve-out programs generally provide the most robust coverage. One- or two-couple executive carve-out sales may not qualify for a multi-life discount with some insurers, hence may not be labeled as worksite sales in submissions to our survey.
The amount of worksite sales reported and its distribution among the three sub-markets significantly impact product feature sales distributions. Table 6 is indicative of the full market, but this year’s policy feature distributions significantly underweight the large group market, as most of that market is not reflected in our statistical data. More information about worksite sales will appear in the August issue of Broker World.
Affinity Market Share
Affinity groups (non-employers such as associations) produced 8.5 percent of new insureds (see Table 7), but only 5.9 percent of new business premium. Less than 20 percent of the lower affinity average premium is attributable to the affinity discount. The balance may be due to younger issue age or less robust coverage.
Characteristics of Policies Sold
Average Premium Per Sale
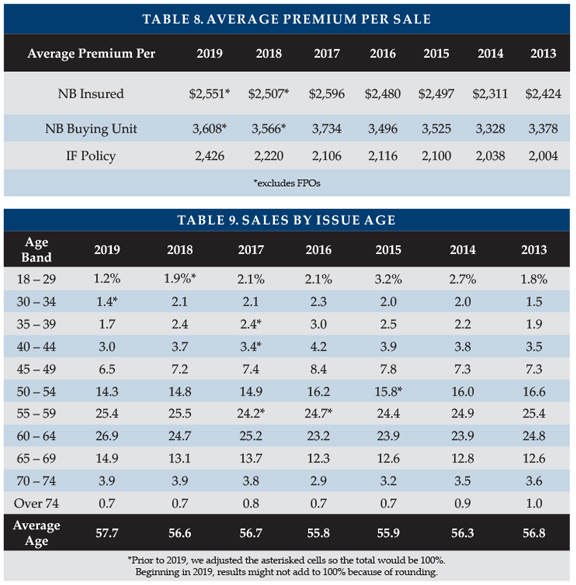
Table 8 shows the average new business premium per insured ($2,551), subtracting FPOs for the insurers that reported statistics. For insurers that reported distribution by couples vs. individuals, the number of insureds was 41.5 percent higher than the number of buying units (a couple comprise a single buying unit), boosting the $2,551 to $3,608.
The average premium for new policies for the 15 insurers rose 1.7 percent compared to 2018 (we recalculated the 2018 results to include more carriers). Our statistics show a higher average initial maximum monthly benefit, a higher issue age and a slightly higher benefit period, which generate a larger increase in average premium for the insurers which provided statistical data.
Data for 2017 and earlier years included FPOs in these calculations, overstating the average premium per new insured and buying unit.
Average premium per new policy ranged from $1,443 to $3,701 among the 15 insurers.
The lowest average new premium (including FPOs) was in Puerto Rico ($2,036), followed by Oklahoma ($2,586) and Kansas ($2,646), while the highest was in the District of Columbia ($4,575), followed by Connecticut ($4,531), West Virginia ($4,349), and New York ($4,270).
Due to rate increases, FPO elections and termination of older policies, the average inforce premium jumped to $2,426, 9.8 percent more than at the end of 2018.
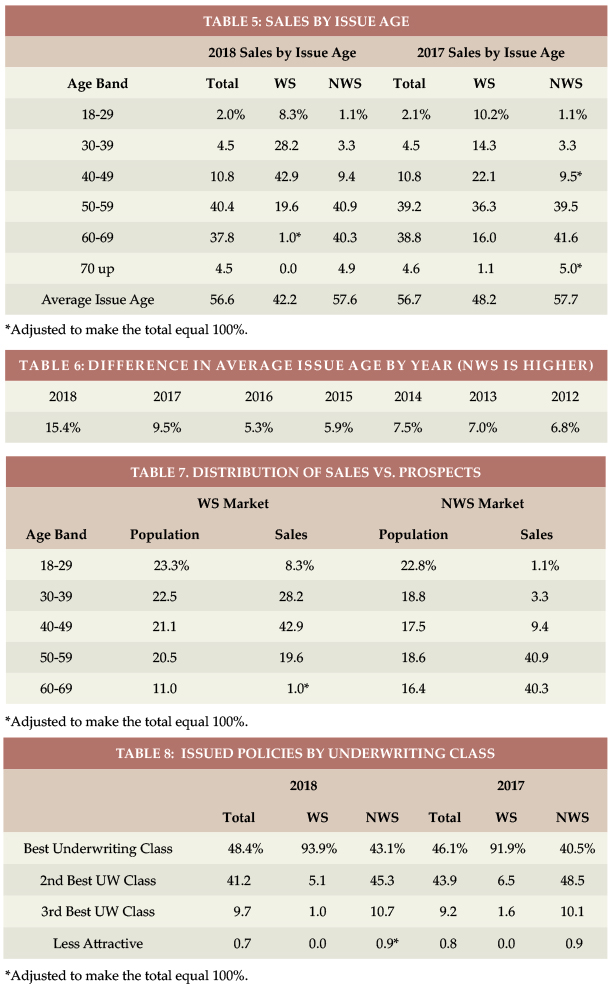
Issue Age
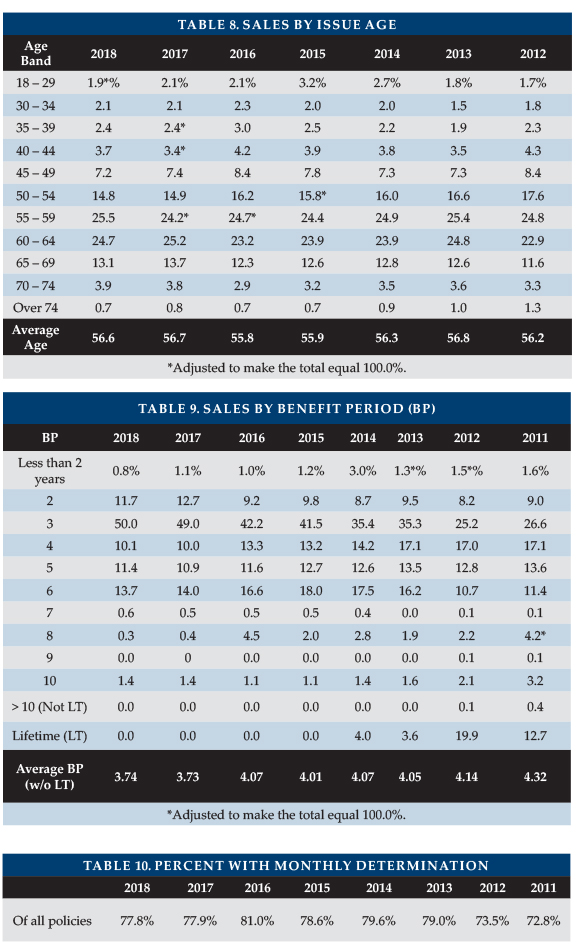
Table 9 summarizes the distribution of sales by issue age band based on insured count. The average issue age increased to 57.7 mostly due to change in participants. The age distributions for 2016 and earlier had more worksite participants than recent years. Note: Two survey participants have a minimum issue age of 40, one will not issue below 30, and two will not issue below 25.
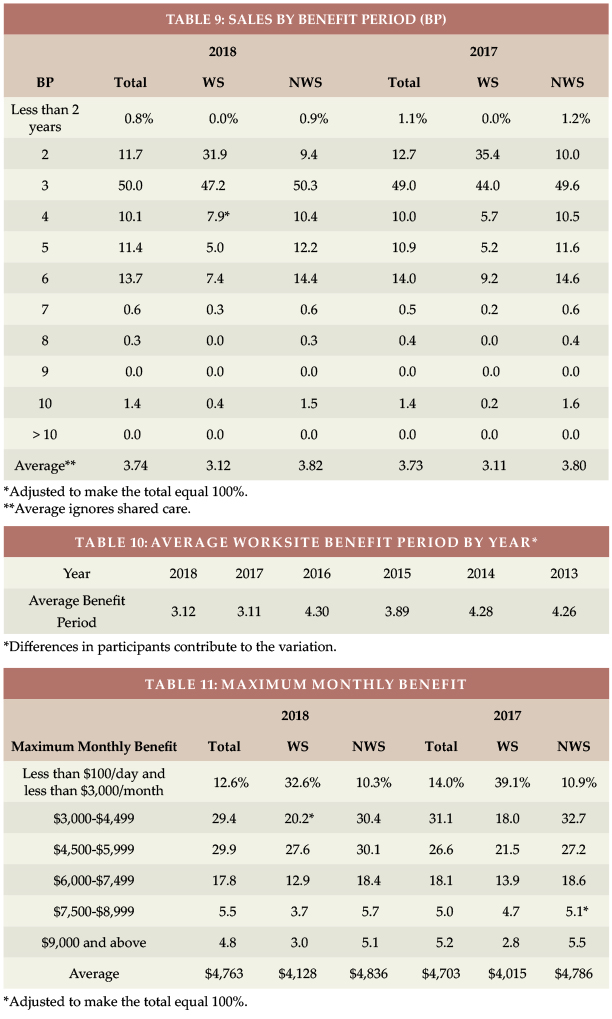
Benefit Period
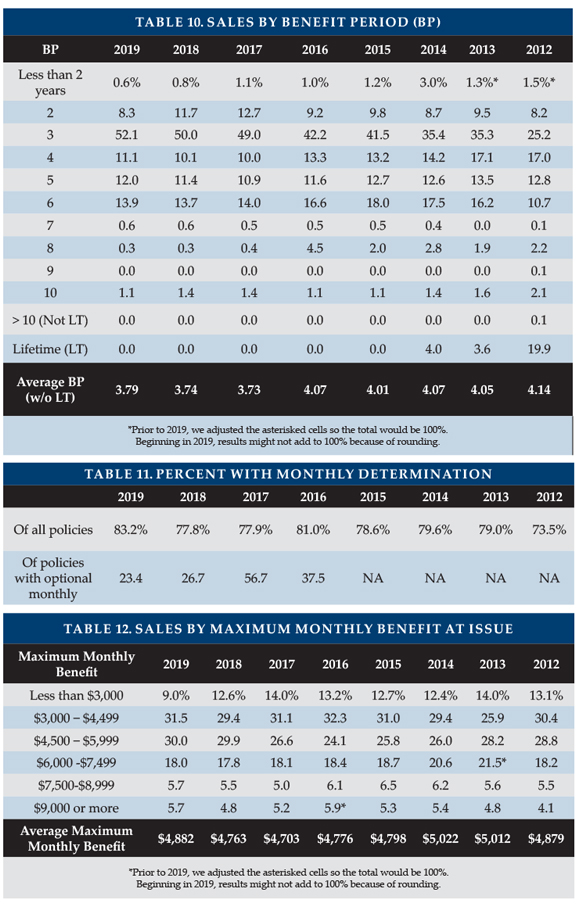
Table 10 summarizes the distribution of sales by benefit period. The average notional benefit period increased slightly from 3.74 to 3.79 because of change in participants. Because of Shared Care benefits, total coverage was higher than the 3.79 average suggests. Three-year to five-year benefit periods accounted for 75.2 percent of the sales, quite a concentration compared to the past.
Monthly Benefit
Table 11 shows that, because of the change in participants, monthly determination applied to a record 83.2 percent of 2019 policies. With monthly determination, low-expense days leave more benefits to cover high-expense days. Among companies which make monthly determination optional, the percentage electing monthly determination ranged from 16 to 43 percent.
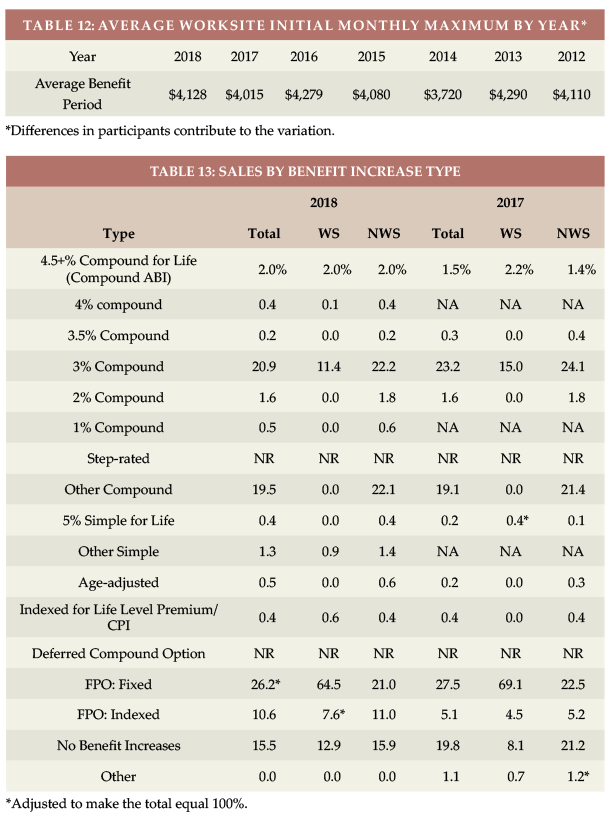
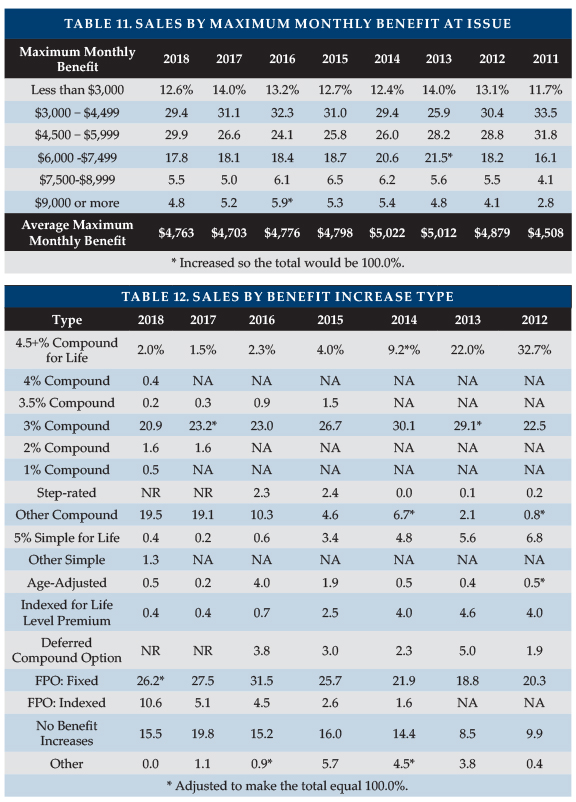
Table 12 shows that the average maximum monthly benefit increased from $4,763 in 2018 to $4,882 in 2019, two-thirds of which increase resulted from the change in participating insurers.
Benefit Increase Features
Table 13 summarizes the distribution of sales by benefit increase feature. The big increase in three percent compounding is less meaningful considering that there was a big decrease in “Other compound” most of which was a variation of three percent compounding.
“Indexed Level Premium” policies are priced to have a level premium, but the benefit increase is tied to an index such as the consumer price index (CPI).
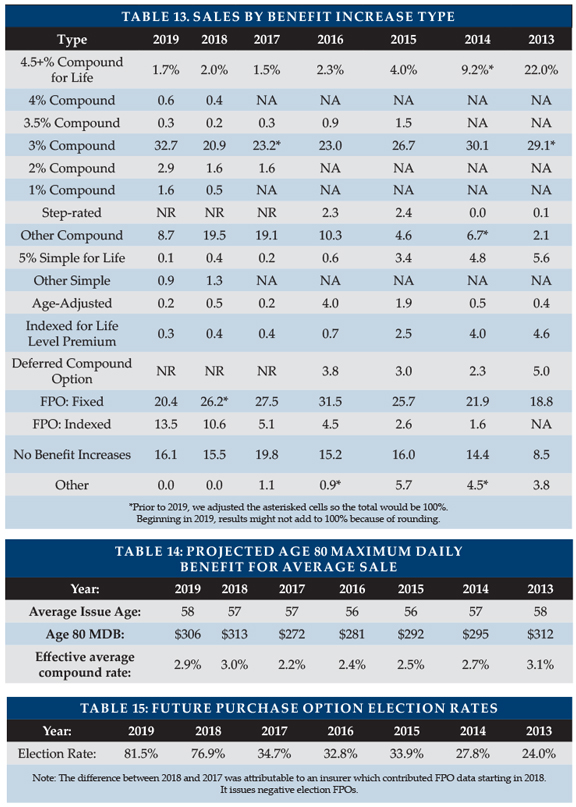
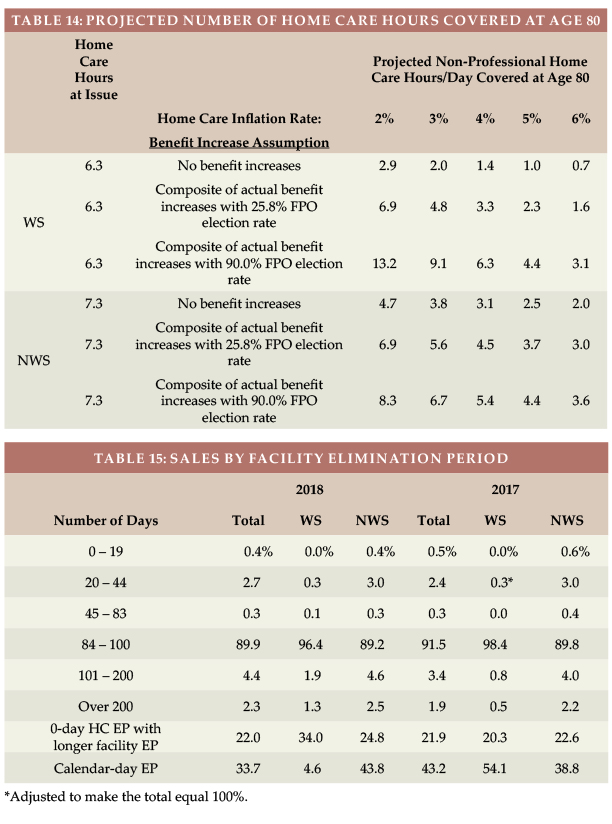
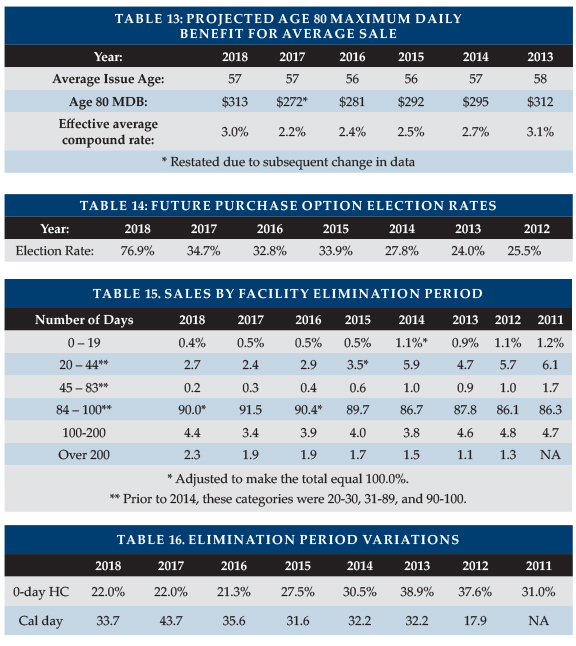
As shown in Table 14, we project the age 80 maximum daily benefit by increasing the average initial daily benefit from the average issue age to age 80, according to the distribution of benefit increase features, using current future purchase option (FPO) election rates and a five percent/year offer for fixed FPOs. The maximum benefit at age 80 (in 2041) for our 2019 average 58-year-old purchaser projects to $306/day (equivalent to 2.9 percent compounding). Had our average buyer bought an average 2018 policy a year ago at age 57, her/his age 80 benefit would be $313/day (equivalent to three percent compounding). The two percent drop is attributable to the change in participants this year. The increase in the FPO election rate added $4/day to the 2041 benefit. Most policyholders seem likely to experience eroding purchasing power over time if cost of care trends exceed three percent.
FPOs are important to insureds in order to maintain purchasing power, and as demonstrated by the fact that 82 percent of our participants’ 2018-2019 FPOs were exercised. The high election rate is very impressive, considering that the cost increases each year due to larger coverage increases each year, increasing unit prices due to age and additional price increases due to rate increases.
The high election rate, coupled with a range of responses from 20 to 90 percent election, demonstrates the effectiveness of annual (as opposed to triennial) options and negative-election (negative-election FPOs activate automatically unless the client rejects them) as opposed to positive-election FPOs (which activate only if the client makes a request). At least some blocks of business demonstrate that policyholders will exercise FPOs if they must do so to continue to receive future offers.
FPOs are also important to insurers, accounting for at least 18 percent of new premium in 2018 and at least 22 percent in 2019. Two insurers had nearly half their new premium come from FPOs.
Elimination Period
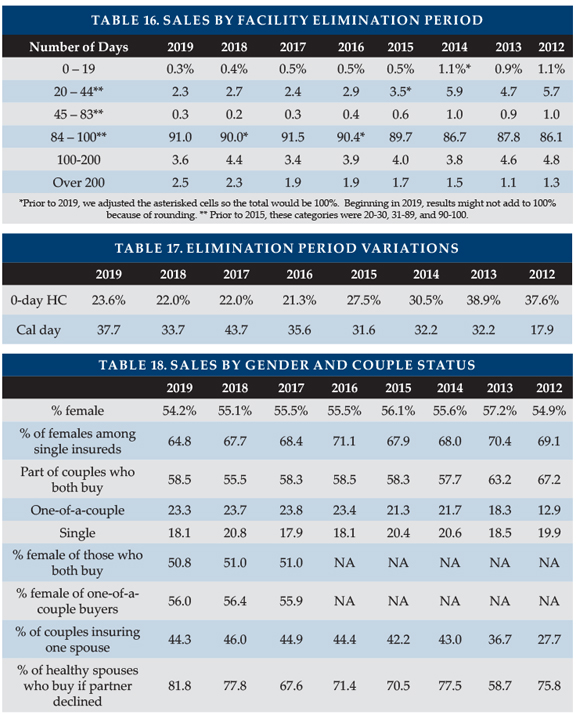
Table 16 summarizes the distribution of sales by facility elimination period (EP). Ninety-one percent (91 percent) of buyers opt for 90-day elimination periods. However, two carriers report 23 to 30 percent of their sales in the 20-44-day EP range. Three carriers reported six to 11 percent of their sales having more than a 200-day EP.
Table 17 shows the percentage of policies with zero-day home care elimination period (but a longer facility elimination period). With most insurers offering an additional-cost zero-day home care EP option, 15 to 30 percent of buyers purchased a zero-day home care elimination period, but one insurer had nearly a 50 percent election rate.
Table 17 also shows the percentage of policies with a calendar-day EP. It is important to understand that most calendar-day EP provisions do not start counting until a paid-service day has occurred.
Sales to Couples and Gender Distribution
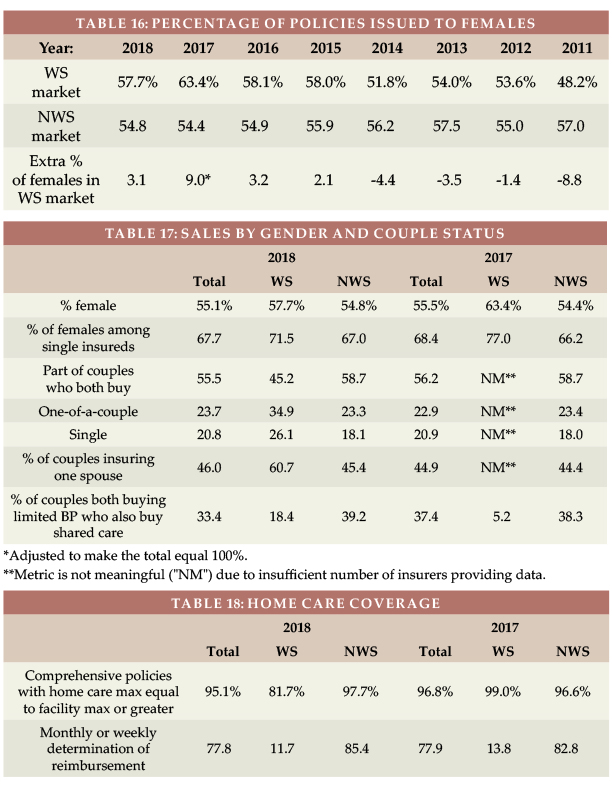
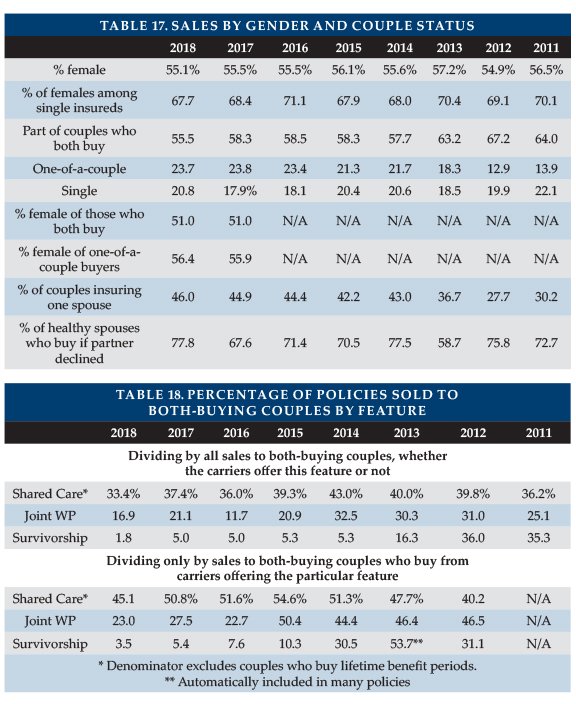
Table 18 summarizes the distribution of sales by gender and single/couple status.
The percentage of buyers who are female dropped to 54.2 percent and the percentage of females among single insureds dropped to 64.8 percent. Changes in participants accounted for only 33 and 17 percent of those respective drops. The percentage of females varies significantly and consistently among companies each year based on their markets.
The 81.8 percent of accepted applicants who purchased coverage when their partners were declined is the highest we have seen. However, some insurers which reported approximately 50 percent success in the past did not contribute data this year.
Shared Care and Other Couples’ Features
Table 19 summarizes sales of Shared Care and other couples’ features.
- Shared care—allows one spouse/partner to use the other’s available benefits if their own coverage has been depleted or offers a third independent pool that the couple can share.
- Survivorship—waives a survivor’s premium after the first death if specified conditions are met.
- Joint waiver of premium (WP)—both insureds’ premiums are waived if either qualifies for benefits.
Changes in distribution by carrier can greatly impact year-to-year comparisons in Table 19, because some insurers embed survivorship or joint waiver automatically (sometimes only in some circumstances) while others offer it for an extra premium or do not offer the feature. However, the 2019 increased percentages of Shared Care and Joint WP are not attributable to changes in participants.
In the top half of Table 19, percentages are based on the number of policies sold to couples who both buy (only limited benefit, for Shared Care). The bottom half of Table 19 shows the (higher) percentage that results from dividing the number of buyers by sales of insurers that offer the feature. Four participants sold Shared Care to more than half their limited benefit period couples; four others sold Shared Care to fewer than half of such couples. Three insurers sold Joint WP to 50 percent or more of their couples; three others sold joint WP to fewer couples. Three carriers sold Survivorship ranging to nine to 16 percent of their couples, while two insurers sold Survivorship to 2.5 to three percent of their couples.
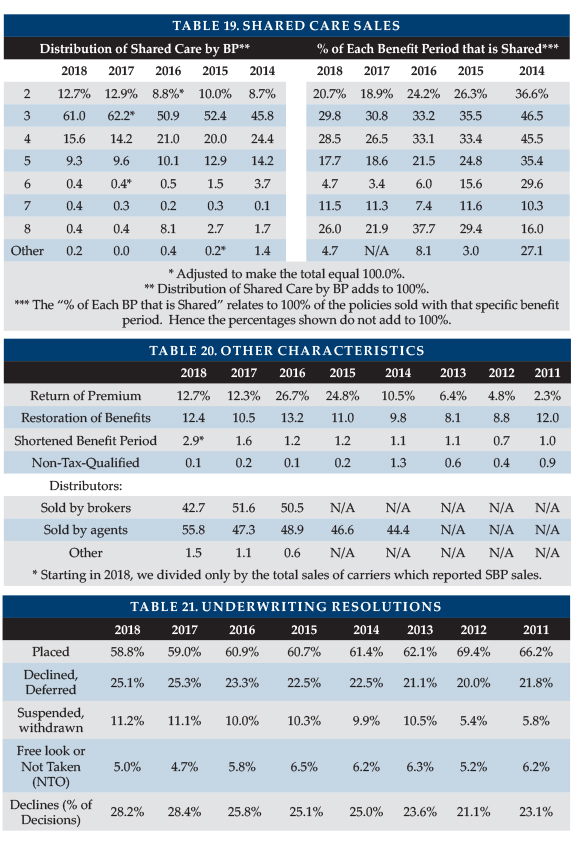
Table 20 provides additional breakdown on the characteristics of Shared Care sales. As shown on the right-hand side of Table 20, two- to four-year benefit period policies are most likely (26 to 32 percent) to add Shared Care. Partly because three-year benefit periods comprise 52 percent of sales, most policies with Shared Care (62 percent) have three-year benefit periods, as shown on the left side of Table 20.
Above, we stated that Shared Care is selected by 35.9 percent of couples who both buy limited benefit period policies. However, Table 20 shows Shared Care comprised no more than 31 percent of any benefit period. Table 20 has lower percentages because Table 19 denominators are limited to people who buy with their spouse/partner whereas Table 20 denominators include all buyers.
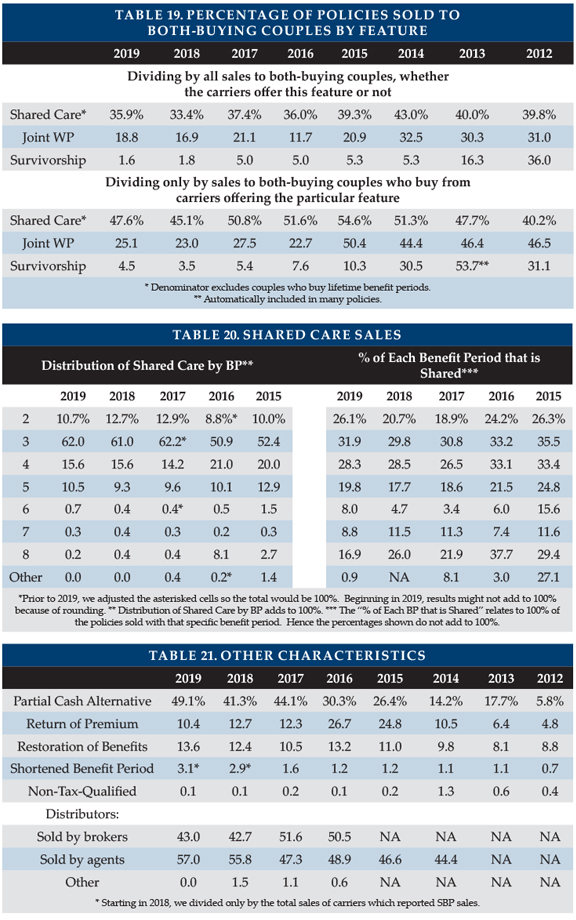
Shared Care is more concentrated in two- to four-year benefits periods (88.3 percent of shared sales) than are all sales (71.5 percent). Couples are more likely to buy short benefit periods because couples plan to help provide care to each other and Shared Care makes shorter benefit periods more acceptable. Single buyers are more likely to be female, hence opt for a longer benefit period. Shared Care percentages rebound at the longer benefit periods reflecting buyers who are trying to cover catastrophic risk and might prefer an endless benefit period.
Existence and Type of Home Care Coverage
For the first time, no participant reported home-care-only sales. Five participants reported sales of facility-only policies, which accounted for 0.7 percent of total sales. Ninety-six percent (96.4 percent) of the comprehensive policies included home care benefits at least equal to the facility benefit.
Other Characteristics
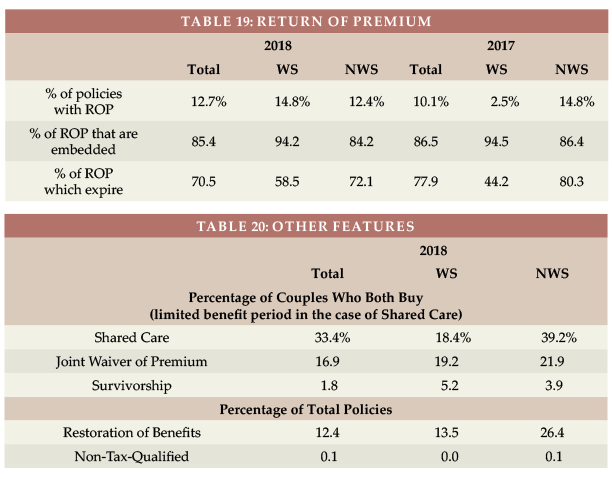
As shown in Table 21, partial cash alternative features (which allow claimants, in lieu of any other benefit that month, to use between 30 and 40 percent of their benefits for whatever purpose they wish) were included in 49.1 percent of sales, including some non-participant sales.
Return of premium (ROP) features were included in 10.4 percent of policies. ROP returns some or all premiums (usually reduced by paid LTCI benefits) when a policyholder dies. Approximately 80 percent of ROP features were embedded automatically in the product. Embedded features are designed to raise premiums minimally, typically decreasing the ROP benefit to $0 by age 75.
Nearly fourteen percent (13.6 percent) of policies with limited benefit periods included a restoration of benefits (ROB) provision, which typically restores used benefits when the insured does not need services for at least six months. Approximately 89 percent of ROB features were automatically embedded.
Shortened benefit period (SBP) makes limited future LTCI benefits available to people who stop paying premiums after three or more years. Although every insurer is obligated to offer SBP, some carriers did not report any SBP sales. Removing their sales from the denominator, we found that 3.1 percent of buyers selected SBP.
Only one insurer issued non-tax-qualified (NTQ) policies, which accounted for 0.1 percent of industry sales.
“Captive” (dedicated to one insurer) agents produced 57.0 percent of the policies. The balance was produced by brokers. At one time, “captive” agents who sold LTCI tended to specialize in LTCI. Now many are agents of mutual companies.
Sales distribution by jurisdiction is posted on the Broker World website.
Limited Pay and Paid-Up Policies
In 2019, only two insurers sold policies that become paid-up in 20 years or less, accounting for 0.8 percent of sales.
Because today’s prices are more stable, premium increases are less likely. One of the key reasons for buying 10-year-pay (avoidance of rate increases after the 10th year) is greatly reduced, while the cost of 10-year-pay has increased, making it less attractive than in the past. Nonetheless, limited-pay and single-pay policies are attractive to minimize post-retirement outflow and to accommodate §1035 exchanges.
Participants reported that 3.8 percent of their inforce policies are paid-up. Less than one percent (0.8 percent) are paid-up because they have completed their premium period. Another 0.8 percent are paid-up due to shortened benefit period and 0.4 percent are due to survivorship features. Almost half of the paid-up policies are paid up for unidentified reasons. For example, shortened benefit period percentages could be as much as three times as high as suggested herein.
PARTNERSHIP PROGRAM BACKGROUND
When someone applies to Medicaid for long term care services, states with Partnership programs disregard assets up to the amount of benefits received from a Partnership-qualified policy. Partnership sales were reported in 43 jurisdictions in 2019, all but California (no participants offer California Partnership policies) and Alaska, District of Columbia, Hawaii, Massachusetts, Mississippi, Utah, and Vermont, where Partnership programs do not exist. Massachusetts has a somewhat similar program (MassHealth).
The Partnership rules in California, Connecticut, Indiana and New York (“original” Partnership states) are significantly different than in other Partnership jurisdictions (“Deficit Reduction Act (DRA)” jurisdictions). The “original” states legislated variations of the Robert Woods Johnson Partnership (RWJ) proposal, whereas the “DRA” jurisdictions use more consistent rules based on the Deficit Reduction Act of 2005. For example, the “original” states require a separate Partnership policy form, generally still have more stringent benefit increase requirements and assess a fee for insurers to participate (none of which applies in DRA states). As a result, only two to five insurers sell Partnership policies in CA (two), CT (four), IN (five) and NY (two). At the time that this article is written, insurance brokers do not have access to Partnership policies in CA and NY.
The National Reciprocity Compact (NRC) requires member states to recognize Medicaid Asset Disregard earned in any other member state. States creating Partnerships under the Deficit Reduction Act of 2005 were automatically enrolled in the NRC but had the right to secede. The four original Partnership states (California, Connecticut, Indiana and New York) had the right to opt in. California is now the only jurisdiction with a Partnership program that is not a member of the NRC. Last year, we reported that New Hampshire had created a unique regulation in 2018, limiting asset disregard for policies sold in other jurisdictions. New Hampshire has reversed that limitation.
PARTNERSHIP PROGRAM SALES
Insurers sometimes delay certifying policy forms as “Partnership” because of other priorities (e.g., needing time to comply with state-specific requirements to notify existing policyholders or offer an exchange). Such delay is not harmful, as certification is retroactive to policies already issued on that policy form if the policies have the required characteristics. For this reason, the “original” Partnership issues mentioned above and because some insurers are not licensed in all jurisdictions, none of our participants sold Partnership policies in more than 40 jurisdictions in 2019. Three had Partnership sales in 38-40 jurisdictions, four in 29-34 jurisdictions, one in six jurisdictions, and the other has chosen not to certify Partnership conformance.
In the DRA states, 55 percent of policies qualified for Partnership status. Once again, Minnesota led the way; 82.5 percent of the policies sold qualified as Partnership. Maine (75 percent) and Wisconsin (74 percent) followed. North Dakota and Georgia were also above 70 percent.
In the original RWJ states, only 0.4 percent of the issued policies qualified as Partnership: Indiana (3.5 percent), Connecticut (1.0 percent), New York (0.4 percent) and California (zero percent).
Partnership policies are expected to have higher average premiums because of the requirement that Partnership policies issued under age 76 have benefit increase features. In our survey, most states did not have such a relationship because we asked insurers to include FPOs in their sales and the carriers with the most FPOs had high average premiums while selling few Partnership policies.
Approximately 60 percent of Partnership states now allow one percent compounding to qualify for Partnership, which can help low-budget buyers qualify for Partnership and also enables worksite core programs to be Partnership-qualified. A higher percentage of policies would qualify for Partnership in the future if insurers and advisors leverage these opportunities. However, currently only three insurers offer one percent compounding.
Partnership programs could be more successful if:
- Advisors offer small maximum monthly benefits more frequently to the middle class. For example, a $1,500 initial maximum monthly benefit covers about four hours of home care every two days and, with compound benefit increases, may maintain buying power. Many middle-class individuals would like LTCI to help them stay at home while not “burning out” family caregivers and could be motivated further by Partnership asset disregard. (This approach does not work where a Partnership minimum daily benefit is required such as CA, $230/day; CT, $291; or NY, $337.) When policies reflecting CA SB 1248 become available in California, California’s minimum size policy will drop to $100/day. South Dakota requires a $100 minimum size for all LTCI and Indiana’s Partnership requires $115.)
- Middle-class prospects were better educated about the importance of benefit increases to maintain LTCI purchasing power and to qualify for Partnership asset disregard.
- The four original Partnership states migrate to DRA rules.
- More jurisdictions adopt Partnership programs.
- Programs that privately finance direct mail educational LTCI content from public agencies were adopted more broadly.
- Financial advisors were to press reluctant insurers to certify their products and create one percent compounding.
- More financial advisors were certified. Some people argue that certification requirements should be loosened. At a minimum, the renewal certification process could be improved.
- More insurers offer one percent compounding.
- Linked benefit products became Partnership-qualified.
UNDERWRITING DATA
Case Disposition
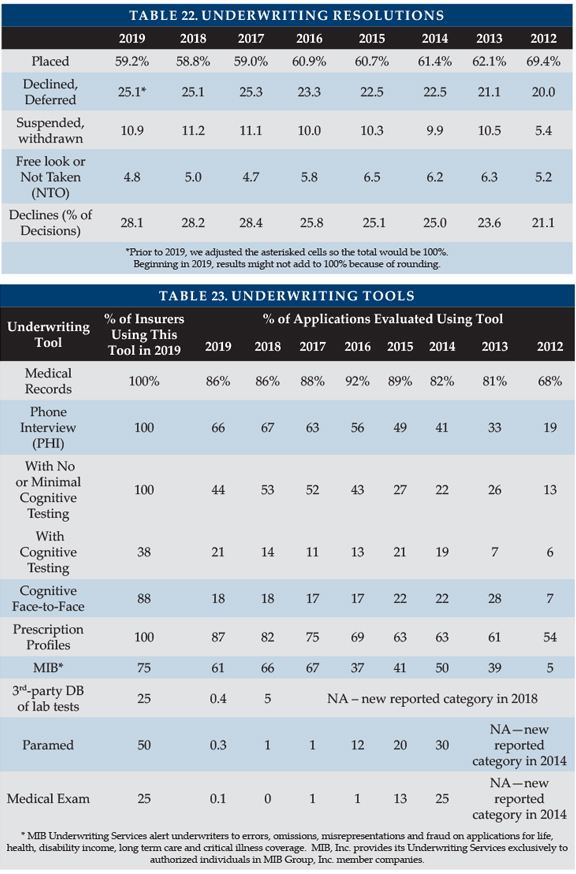
Eight insurers contributed application case disposition data to Table 22. In 2019, 59.2 percent of applications were placed, including those that were modified, a little higher than in 2017 and 2018. Half of the improvement was related to change in participants.
One insurer reported a 76.7 percent placement rate, the second highest being 58.3 percent. Two insurers placed fewer than 50 percent of their apps, the lowest placement rate being 32.3 percent. Low placement rates increase insurers’ cost per placed policy. More importantly, low placement rates can discourage advisors from discussing LTCI with clients. In addition to not wanting to waste time and effort, advisors fear that declined clients will be dissatisfied.
Decline rates slipped slightly for the second straight year. The decline rate by carrier varied from 11.2 to 41.8 percent, affected by factors such as age distribution, market, underwriting requirements, and underwriting standards. Our placed percentages reflect the insurers’ perspective. A higher percentage of applicants secures coverage because applicants denied by one carrier may be issued either stand-alone or combo coverage by another carrier or may receive coverage with the same insurer after a deferral period.
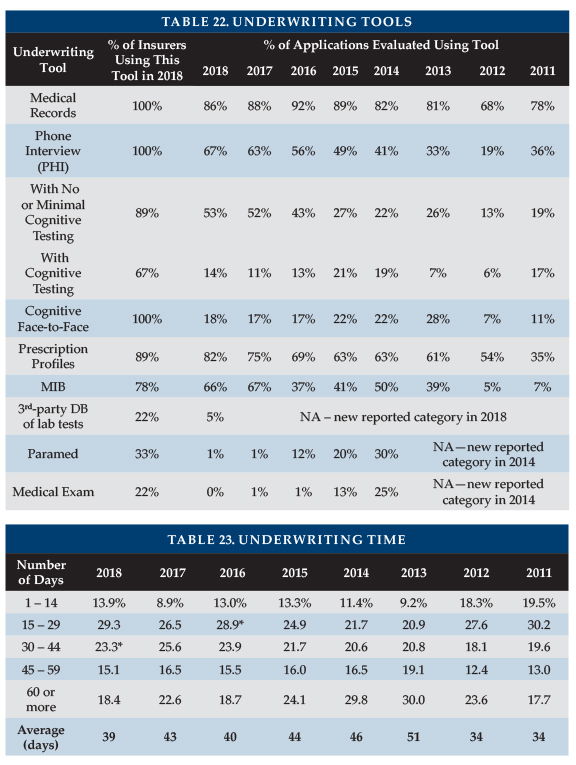
Underwriting Tools
Eight insurers contributed data to Table 23, which divides the number of uses of each underwriting tool by the number of applications processed. For example, the number of medical records was 86 percent of the number of applications. That does not mean that 86 percent of the applications involved medical records, because some applications resulted in more than one set of medical records being requested.
Insurers are trying to speed underwriting to increase placement rates. In the worksite market, insurers are less likely to use some of these tools.
Year-to-year changes in distribution of sales among insurers significantly impact results. Lower maximum ages result in fewer face-to-face exams. Insurers might underreport the use of an underwriting tool because they may lack a good source for that statistic. For example, the cognitive phone calls are understated below because one insurer could not split them apart from their other phone interviews (PHI) and reported them all as PHI with no or minimal cognitive testing.
Underwriting Time
Table 24 shows the average processing from receipt of application to mailing the policy (37.0 days) was 2.4 days faster than in 2018, which in turn had been 3.4 days faster than in 2017. About 38 percent of the reduction was due to the change in survey participants.
The reduction came at both ends of the spectrum, a much higher percentage processed within 29 days and many fewer taking 45 or more days. All but one insurer reported an increase.
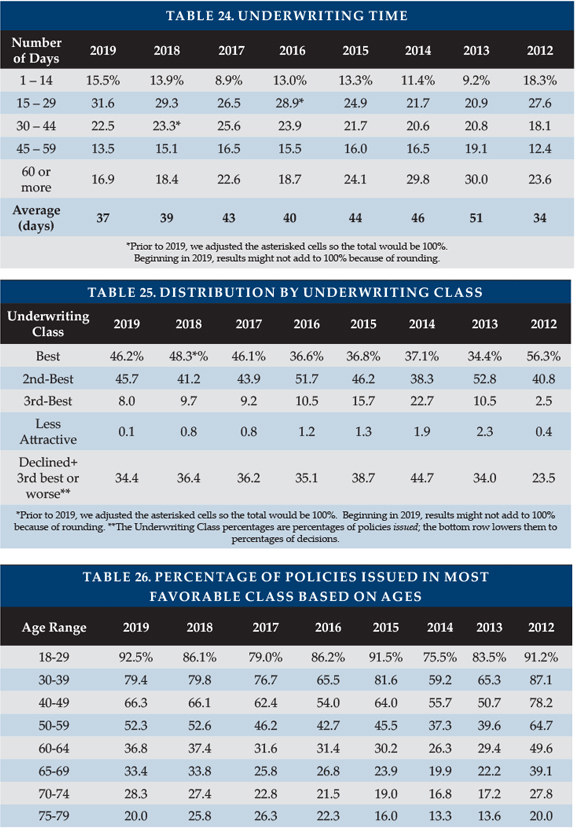
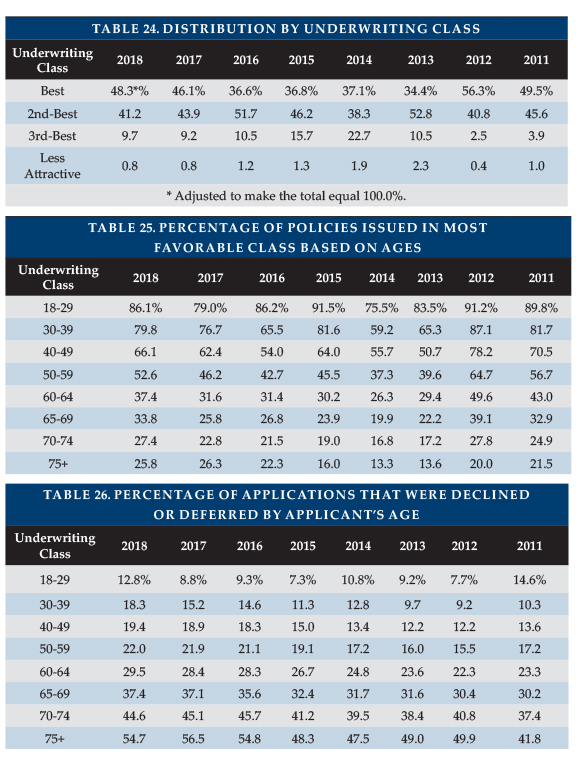
Rating Classification
Table 25 shows that a lower percentage of policies was issued in the most favorable rating classification, but for participants which contributed data both years, the percentage increased 0.4 percent despite a higher average issue age. Two insurers placed more than 80 percent of their applicants in the best underwriting class. Only 8.1 percent of the applicants were placed beyond the second-best classification. In 2016 and prior years, the “best” percentage was lower partly because we received more data from insurers writing worksite business, which does not offer preferred health discounts and because one insurer eliminated its preferred health discount (hence “standard” ratings became its “best”).
Underwriting placements have become more favorable. To gauge whether insurers are declining applicants rather than placing them in a less-attractive rating, we added a line in Table 25 that shows the percentage of decisions which were either declined or placed in the third or less-attractive classification. This approach confirms the more favorable decisions in 2019.
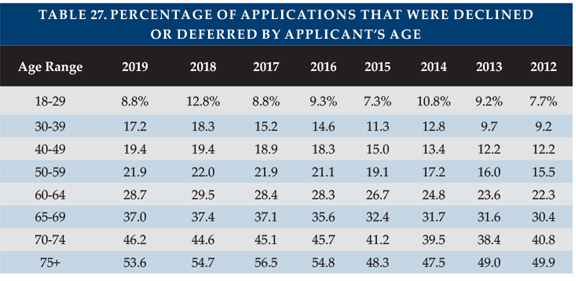
Tables 26 and 27 show by issue age range the percentage of policies issued in the most favorable category in 2019 and the percentage of decisions that were declines. One participant was not able to provide the by-issue-age data, so Tables 26 and 27 do not exactly match Table 25.
Please click on the links below to find the following additional information:
- Product Exhibit shows, for eight insurers: Financial ratings, LTCI sales and inforce, and product details. Please note that, during the COVID-19 pandemic, some insurers have temporarily discontinued sales that would require face-to-face interviews. Our Exhibit ignores such temporary restrictions.
- Product Details, a row-by-row definition of the product exhibit entries, with some commentary.
- Premium Exhibit, which shows lifetime annual premiums for each insurer’s most common underwriting class, for issue ages 40, 50, 60, and 70 for single females, single males, and heterosexual couples (assuming both buy at the same age), based on $100 per day (or closest equivalent weekly or monthly) benefit, 90-day facility and most common home care elimination period (other aspects vary), three-year and five-year benefit periods or $100,000 and $200,000 maximum lifetime buckets, with and without Shared Care and with flat benefits or automatic three or five percent annual compound benefit increases for life. The exhibit includes facility-only policies, as well as comprehensive policies. Worksite products do not reflect any worksite-specific discount, though some carriers offer this.
- Premium Adjustments (from our Premium Exhibit prices) by underwriting class for each participant.
- Distribution by underwriting class for each participant.
- State-by-state results: percentage of sales by state, average premium by state and percentage of policies qualifying for Partnership by state.
CLOSING
We thank insurance company staff for submitting the data and responding to questions promptly. We also thank Nicole Gaspar, Alex Geanous, and Anders Hendrickson of Milliman for managing the data expertly.
We reviewed data for reasonableness and insurers reviewed their product exhibit displays. Nonetheless, we cannot assure that all data is accurate.
If you have suggestions for improving this survey (including new entrants in the market), please contact one of the authors.
Reference:
- Society of Actuaries (November 2016). Long-Term Care Insurance: The SOA Pricing Project. Retrieved May 16, 2019, from https://www.soa.org/globalassets/assets/files/static-pages/sections/long-term-care/ltc-pricing-project.pdf.