

Monday, July 6, 2026
Home Authors Posts by Charlie Gipple, CFP, CLU, ChFC

Charlie Gipple, CFP, CLU, ChFC

118 POSTS 0 COMMENTS
Charlie Gipple, CFP®, CLU®, ChFC®, is the owner of CG Financial Group, one of the fastest growing annuity, life, and long term care IMOs in the industry. Gipple’s passion is to fill the educational void left by the reduction of available training and prospecting programs that exist for agents today. Gipple is personally involved with guiding and mentoring CG Financial Group agents in areas such as conducting seminars, advanced sales concepts, case design, or even joint sales meetings. Gipple believes that agents don’t need “product pitching,” they need mentorship, technology, and somebody to pick up the phone… Gipple can be reached by phone at 515-986-3065. Email: cgipple@cgfinancialgroupllc.com.

If Stocks Have Averaged 10 Percent Since Dinosaurs Roamed The Earth, Why Only 2.5 Percent Withdrawals?

Many years ago I was sitting with a client who had a $500,000 portfolio and was about to retire. He asked me how much I thought he could take in retirement income from his equity mutual funds that would allow his portfolio to last him and his wife their entire lives. When I told him that the old rule of thumb (four percent) would indicate no more than $20,000 each year—adjusted for inflation—he almost kicked me out of his house.

Consumers are perplexed many times when you tell them that the withdrawal “rules of thumb” from a 50/50 portfolio or a 60/40 portfolio range between 2.5 percent (new rule) to four percent (1990s rule). As this client said, “Doesn’t the stock market average almost double digits? And you are telling me to take only four percent?” Well, even if the market does average double digits, the market does not go up in a perfect linear fashion. If it did, then “double digits” per year would be a safe withdrawal rate from a 100 percent stock portfolio, not accounting for inflation adjustments anyway.

If you read my article last month on sequence of returns and sequence of inflation risk, that was a preface to this article. It is because of sequence of returns that there is a disconnect between what the stock market has averaged over time and what the “rules of thumb“ on withdrawal percentages are.

Take for instance the graph that I generated with the “JOURNEYGUIDE” retirement income software. Great software! This graph is a part of “Monte Carlo Analysis“ on a 100 percent stock portfolio. Basically, what I asked my software to do was to show me if my 65-year-old client—who is retiring in a year with a $1 million Roth IRA—can take $40,000 out in the first year (increasing by a three percent inflation rate). The assumption here is that he will live until age 92 as he is extremely healthy. Again, we start with an assumption that his money is in 100 percent U.S. Large Cap stocks.

The “Income Frontier” shows us the probability of him being able to sustain various levels of income in retirement without running out of money. The parallel line is our goal of $40,000 of annual inflation adjusted income. Where our blue curve intercepts indicates that there is only a 54 percent chance that his portfolio would last his lifetime by taking out $40,000 inflation adjusted. Not very good! How is it only a 54 percent confidence level if the growth assumption on this stock portfolio is over seven percent? Because of sequence of returns risk. (Note: What a 54 percent confidence level means is, he runs out of money prior to death in a whopping 46 percent of 5,000 market simulations that take place in this software!)

I like to target the white area—confidence levels of 80 to 95 percent. At the 95 percent confidence level, my client is only projected to take $18,000 per year. However, the tradeoff is the right side of the chart. If one wanted to roll the dice, he could hope and pray that he is in the top five percent of scenarios throughout his retirement years and take inflation adjusted withdrawals of around $80,000 per year. Good luck with that!

If I were to paraphrase Chart 1 I would say, “I am 99 percent confident that you will be able to take retirement income of $15,000 or more per year (left side) and I am almost zero percent confident you can take out more than $90,000 per year (right side).
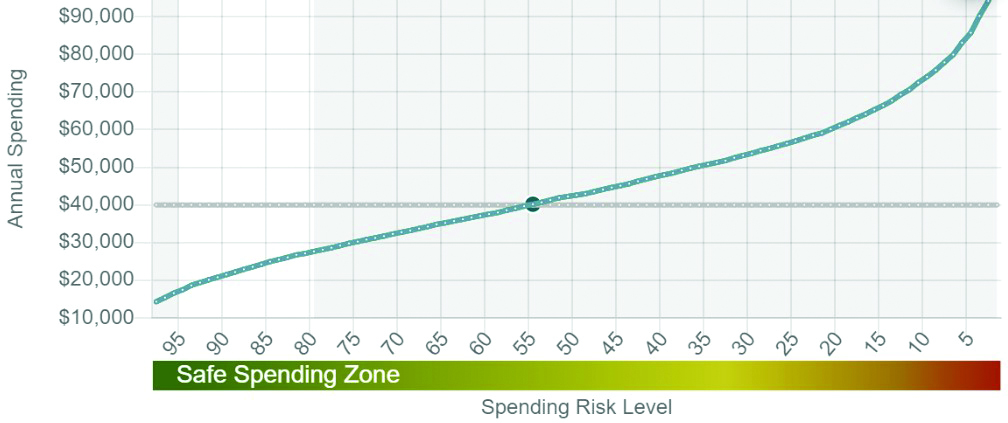
Chart 1

The GLWB
Chart 2 is the same analysis using a GLWB that will guarantee our client (64-year-old male) a flat $57,500 per year forever—once he activates the rider at age 65. First let’s talk about the positive traits. The positive is the flat line. We know with certainty exactly how much income he can take from the annuity forever. There is no “sequence of returns risk.” However, the elephant in the room is that our new blue line is only at $36,200! Why not $57,500? Because of inflation adjustments of three percent that we are incorporating. Remember, the goal is to have an inflation adjusted amount of income each year which, again, is what the withdrawal rules of thumb take into account. So basically, in our first year of retirement, if we were to take out our $57,500 and only spend an inflation adjusted amount every year, what would that amount be so that by the time our client dies at age 92 we have been able to provide this inflation adjusted payment every year? It cannot be $57,500 in the first year because we must inflate it later on, which this GLWB rider does not do. Based on the math and assuming a three percent constant inflation rate, the GLWB would only give us around $36,200 inflation adjusted income per year. (Note: For simplification, we assumed the excess “reinvestment” is going to cash for income in later years.)
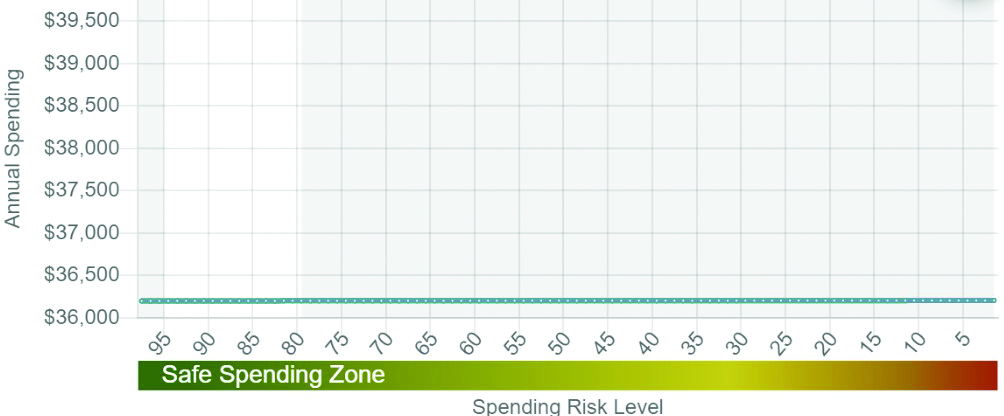
Chart 2

So the positive with our 100 percent stock portfolio is the part of the chart on the right hand side. The upside potential. The negative is the left hand side of the chart. With the stock portfolio, we cannot be anywhere near 100 percent confident that we will be able to get an inflation adjusted income of $40,000 per year.

Conversely, with our GLWB graph, the positive is the predictable flat line and the fact that the flat line is not far off from our goal of $40,000. However, the downside is that the opportunity for more inflation adjusted income is slim. At the 95th percentile we are looking at $36,200 in income. At the overly-optimistic five percent confidence level we are looking at $36,200 in income.

(Note: Technically there is an additional level of variation that one could incorporate in these charts, and that is inflation assumptions. For instance, if we were to experience deflation over the next 30 years, our lines would move up, all else being equal. Or, inflation could continue to be high which would lower these lines.)

50/50 Mixture (Green Line)
With Chart 3 the software took our first “blue” scenario—the stock portfolio—and overlaid a scenario that some might find more “optimal” for those consumers approaching or already in retirement. These consumers obviously do not want the uncertainty of the steep 100 percent stock curve but, at the same time, they may want the potential for more income rather than the flat GLWB curve. Thus, the green curve is a 50/50 mixture of the stock portfolio and our annuity. As you can see, what we have done is this: At the very high confidence levels we have significantly brought up our inflation adjusted distribution amounts. At the same time, should the stock market skyrocket for the next 30 years, the right side of our green line is well above what it would have been if we otherwise just had all $1 million of our dollars in the GLWB.
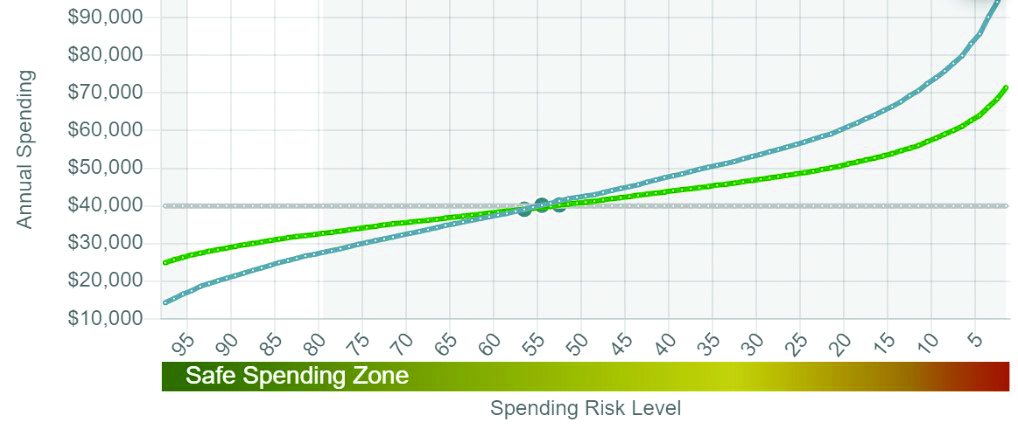
Chart 3

With this strategy we are combining the upside potential of the market with the reliable and guaranteed GLWB income. Naturally, the “50/50 portfolio” is not a new concept. What is a new-ish concept however is to replace the bond portion with indexed annuities/GLWBs.

In the future I will also model out using accumulation focused indexed annuities to create somewhat of a synthetic GLWB strategy. However, that becomes a little more challenging because past performance that we see in indexed annuity illustrations tends to look overly rosy which can lead to flawed analysis

Final Thoughts
You certainly noticed that I anchored our expectations on four percent, or $40,000. This is because I wanted to demonstrate to you how difficult it is to reach this level of income—at least on a conservative basis. Hence the reason that the four percent rule has gone the way of the dinosaur.

In recent years a few studies have stated that there is around a 50 percent chance of failure for a 50/50 portfolio while using the four percent rule of thumb. By the way, check out our first graph. Although that portfolio is all stocks, it is consistent with that analysis as it shows the portfolio failing 46 percent of the time. Which brings me to my final point:

The 50/50 portfolio above is actually quite attractive. Many of us know that the new rule of thumb is around 2.5 percent on 60/40 portfolios. I emphasize 60/40 because old rules used the 50/50 portfolio. However, as interest rates have dropped, the retirement income experts increased the stock exposure to 60 percent and decreased the bond exposure to 40 percent in their analysis. This increased stock exposure tends to show higher percentages of income but yet much lower than the four percent rule that was created in 1994. In the end, the magical withdrawal rule of thumb for inflation adjusted income is around 2.5 percent. We have arrived at this with our portfolio above except the portfolio above may be superior to the 60/40 portfolio. That is, by replacing bonds with our annuity, we do not get decimated when interest rates increase.

Lastly, although I don’t condone putting all of the client’s money into an annuity, look at the second graph in this article. If you really wanted to smoke the 2.5 percent rule of thumb, there it is. The $36,200 inflation adjusted income is a whopping 44 percent higher than $25,000 (2.5 percent). I just hope today’s inflation rate of 7.5 percent is “transitory.”

JOURNEYGUIDE Income Software: www.journeyguideplanning.com.

Roth IRAs: The Basics And Not-So-Basics

With the tax increases that will almost inevitably happen, the entire world is talking about Roth IRA‘s. So, I thought it would be good to give some basic and not-so-basic information on Roth IRA‘s, Roth conversions, order of withdrawals, etc.

First off, I say all the time that we in financial services “normalize our excellence.“ Now this may sound arrogant, but it is not meant to be. Basically, all that I mean by this is that what we know by the back of our hand many consumers do not know. For example, many consumers do not know what the difference is between a traditional IRA and a Roth IRA. This is hard for many agents to comprehend but it is the truth.

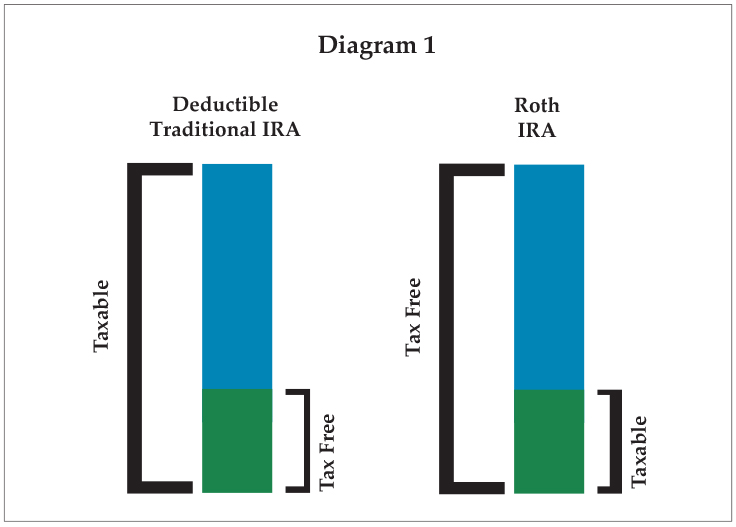
So, let’s start out basic and discuss how I explain the differences. I usually draw out Diagram 1 for clients as I explain the traditional IRA versus Roth IRA concept.

Explaining Roths Versus Traditional IRAs
What I say is, on the right-hand side you are paying taxes on the “seed,” and on the left-hand side you are paying taxes on the “harvest.” In other words, with one you are putting in after-tax dollars in order to be tax-free at retirement. With the other, you get the deduction, but those chickens come home to roost in retirement. I also usually tell the client, “Now, the seed versus the harvest is a nice catchy line I know, but without getting into the math on which one is better, the decision really comes down to your expectations of tax rates at retirement versus today. As much debate as there is around which one to go with, it is really as simple as this: If you believe tax rates will be higher in retirement than today, go with the Roth. And vice versa.” I usually also let the client know that there are some additional benefits to the Roth IRA in that withdrawals do not add to your “provisional income“ which determines if your Social Security is taxable.

Now, there is more to the story when it comes to Roth IRAs. What happens if you don’t wait five years? Or, what happens if you are not 59 1/2 when you take out the withdrawals? Or, what if you are 59 1/2 when you take out withdrawals but have not had the Roth IRA for at least five years? Etc. etc. This is where I will discuss the intricacies of how money withdrawn from Roth IRAs is treated in various situations.

First and foremost, in general, if you have had any Roth IRA established—not just the one you are withdrawing from—for at least five years and are age 59 1/2 or older, you can take out what you put in plus the growth without paying any taxes at all. And without having that dollar amount added to your “provisional income” for social security purposes.

But life isn’t always that easy. So, let’s get into the nitty gritty.

Order of Withdrawals
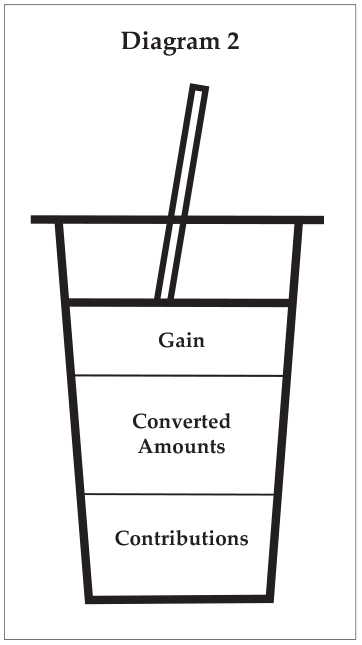
Diagram 2 represents the order of withdrawals from a Roth IRA. It is a lot like drinking with a straw. Depending on the density of the fluids, many times what you pour into the cup first stays on the bottom, then the next mixture is layered on top of it and then the next mixture is on the very top. Ever pour a stiff drink where you put the alcohol in first and you forget to stir it? The first thing up the straw is 100% alcohol! That is my analogy for a “first in first out“ treatment. This is the treatment that Roth IRAs enjoy. When you take withdrawals out of the Roth IRA, your contributions come out first, then any amounts you had previously converted to the Roth from a Traditional IRA, then the gain.

Withdrawing Contributions
The tax treatment of contributions is what makes “FIFO” so appealing. If “Joe” is 35 years old today and put in $6,000 and had something come up next year where he needed $4,000, could he take it without any penalty? Absolutely. As the years go by and his “contributions” pile up in the Roth, he has that dollar amount that he can access at any time without a 10 percent penalty or tax. The lack of tax should be common sense because what he put in was after-tax.

Withdrawing Converted Amounts
Now let’s take our 35-year-old “Joe” again and make this a little more complicated. Let’s say that Joe put in his $6,000 contribution today, and one year from now he moved in $10,000 that he converted from a Traditional IRA. Now let’s say that a year later he wanted to access $8,000. How is that treated? (Note: Keep in mind he already paid taxes through the conversion. Therefore, this process is to determine whether he gets a 10 percent penalty or not. He cannot be taxed twice!)

His first $6,000 that was his contribution is free and clear of any taxes or penalties (again, even though he is now only 37 years old!). However, the other $2,000 that he accesses is from the conversion he did the year prior. What is the tax/penalty treatment on that money? He is not taxed on the $2,000 withdrawal because—again—he just paid taxes on the conversion the year prior. However, he is penalized 10 percent because he did not satisfy the Roth IRA five-year holding period requirement. (Note: Some folks believe that if he set up a separate Roth IRA many years ago that the clock started ticking on this conversion back then and therefore he would not get a 10 percent penalty on the conversion, at least if the first Roth was set up more than five years ago. That is false when it comes to conversions. Otherwise, you would be able to convert pre-tax money to a Roth then immediately withdraw that conversion amount and thus avoid the 10 percent penalty. The IRS is ahead of us on this one. There are separate five-year holding period requirements for conversions.)

With the converted amount, can you fail the five-year holding period requirement and not have to pay the 10 percent penalty? Yes, there are nine “Special Purposes” the IRS allows you to have to avoid the 10 percent penalty:

  1. You are older than 59 ½.
  2. Death.
  3. Disability.
  4. First home purchase (Max $10,000).
  5. Medical expenses.
  6. Medical insurance premiums while unemployed.
  7. 72Ts or annuitization.
  8. College expenses.
  9. Birth/adoption.

For example, if Joe was fifty-nine when he converted to the Roth, he can take his conversion amount out six months later (59 ½) without receiving a 10 percent penalty. To keep it simple, in any of these scenarios in this article, if the client takes money (even gain) for any of the nine reasons, there will not be a 10 percent penalty. It is just a matter of if you are taxed or not.

Naturally, if Joe satisfied the five-year holding period rule and also experienced one of the nine special purposes, there is no tax and no penalty.

Withdrawing Gain Amounts
Now let’s talk about the treatment of the gains. Whether it is gain from the contributions or gain from the conversion amount, it is at the top of our glass and the last thing to be sucked out by our straw. So now let’s assume that Joe did this.

  • At age 35: Contributed $6,000.
  • At age 36: Put in $10,000 that was converted from a traditional IRA.
  • At age 39: He wanted to access $20,000 to buy a car (Note: The Roth grew to $25,000 at this point).

In this example, Joe is taking out all three areas of our fluid in our glass. The treatment of the first two areas (contributions, conversion amount), you should know by now. No taxes on either of the two amounts but a 10 percent penalty on the conversion amount—because he failed the five-year rule. Plus, he did not meet any of the nine special purposes.

For the withdrawal of gain, he receives a 10 percent penalty and is taxed on the gain. This is because he failed the five-year test and he did not satisfy any of the nine special purposes.

Withdrawing Gain Amounts: Alternative Scenario
Now let’s alter the scenario a little bit and assume that he had taken the withdrawal for any of the reasons you see in our list of nine special purposes instead of just to buy a car. In this case, the gain would be taxed (because he did not satisfy the five-year requirement) but there would not be a 10 percent penalty. Remember, no 10 percent penalty applies if he takes the money for any of the nine reasons.

Withdrawing Gain Amounts: Another Alternative Scenario
Now let’s say that Joe, many years down the road, does indeed meet the five-year holding requirement. He has held the Roth for at least five years after his original contribution and also five years after his conversion. Does he avoid the 10 percent penalty and taxation on the gain? It depends!

If the reason is for any of the first four (59 ½, death, disability, first home) of our special purposes, he pays no tax and no penalty. For example, he is over age 59 ½. This is how most Roth IRAs are intended.

If the withdrawal of gain is because of the last five (medical expenses, medical premiums, 72Ts/annuitization, college, birth/adoption)—and thus he is not 59 ½—then he pays taxes on the gain but no 10 percent penalty is due.

If the withdrawal had nothing to do with any of the nine special purposes, he pays taxes on the gain and a 10 percent penalty even though he satisfied the five-year holding period.

Medicaid In Plain English

Last year I had just finished a seminar to thirty pre-retirees on retirement strategies as I was approached by one of the attendees and her husband. For purposes of this article, I will call her Sarah and him John. Sarah and John were both 63 years of age and she started the conversation with “I really need your advice on something.“ It was clear she was profoundly serious about what was on her mind. Sarah immediately proceeded in the conversation with telling me that they had 250 acres of farmland that had been in her family for generations. They also had a couple of small IRAs. The total assets amounted to around $1.5 million in total assets. As you know, this is not a real common conversation to have at the front of the seminar room immediately after the seminar, but she laid it all out for me. She almost had a sense of urgency. Sarah then transitioned into how her mother had just passed away after being in the nursing home for three years. I thought I knew exactly where this conversation was going whereas she was going to ask about the various types of long term care insurance that exist. Although that was a part of our later conversations, that was not where she took the conversation next. She said, “So here is what I need guidance on. How do we protect our retirement assets and most importantly the farmland that has been in our family for generations should either of us go into the nursing home?” What she was getting at was not just long term care insurance but also Medicaid. Naturally, we took this conversation off-line to a series of appointments the following weeks.

My previous point demonstrates a couple of points:

  • Number one is that there is nothing as emotionally charged in the financial lives of our consumers as long term care. Every time somebody explains the financial and emotional experience they had with a family member’s long term care process it is heartbreaking. And, as we know, it is a 70 percent probability for anyone over age 65. Thus, the need for LTCI.
  • The second issue is Medicaid! How Medicaid works is something that every financial professional should be somewhat familiar with. The preconceived notion with Medicaid Planning may be that it only applies to “poor people“ on their way to the nursing homes. That is not the case, as we saw with the example of Sarah and John.

Now of course my conversation with Sarah and John included LTCI, as Medicaid is not a great alternative to having had a full-blown plan that includes LTCI. However, this couple was in crisis mode as they both were uninsurable—she had already been treated for cognitive decline and he had serious heart issues. I bring this up because some folks will view Medicaid strategies as the antithesis to a true long term care plan. It is not. It is a last resort strategy.

With that said, allow me to explain some basic concepts when it comes to Medicaid so, at the very minimum, it allows you to be “dangerous“ with the concept or at the most, pique your interest so that you research enough to become very adept at it as I have over the years. Please note that my commentary is merely meant to be a “plain English” description that gives you a basic understanding of the concepts. This is not all encompassing. Qualifying for Medicaid is one of the most complicated strategies that a financial professional can employ and therefore this column seeks to distill it down. Let’s crawl before we run.

What is Medicaid?
My unofficial definition of Medicaid for purposes of this article is: A federal/state joint health insurance program for individuals that have assets (countable assets) and income below certain levels. This is different from Medicare in that Medicare does not have maximum asset and income thresholds to qualify. Furthermore, Medicare does not cover long term care beyond one hundred days. Medicaid does. Although there are many requirements and parameters that the federal government creates for Medicaid, there is some flexibility—and thus differences—among the individual states. The states create rules within the framework of the federal government.

What is the Process?
Once you enter the realm of Medicaid strategies, you are in “crisis planning mode.” Once a consumer is in a situation where Medicaid is the last resort, the process might look like the below.

This is the process of preserving assets in situations where those hard-earned assets would otherwise need to be liquidated in order to fund long term care expenses. For example, Sarah having to sell the farmland in order to pay for her husband’s long term care would be a catastrophe! Medicaid strategies revolve around helping Sarah and John become eligible for Medicaid without having to spend a significant amount of those assets before they are eligible.

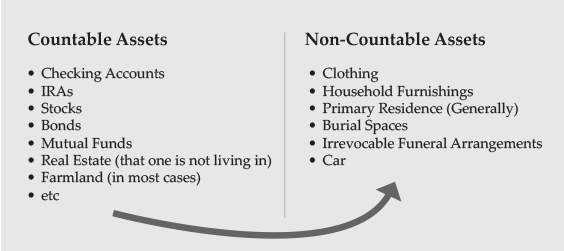
Sticking with the theme of extreme simplicity, the strategy is largely about moving the assets in the left column below to the right column, or completely off the grid (Irrevocable Trusts).

Clearly, we need to back up for a second and explain the relevance of the chart below and what this means.

Let’s take Sarah as the example here. Let’s say that in 20 years her husband John goes to the nursing home. Naturally, we do not want them to liquidate the IRAs and/or the farmland in order to pay $100,000 per year (approximate national median cost of private room in today’s dollars) for the nursing home. So, what will she do? She might seek the assistance of Medicaid and fill out the Medicaid application. On that Medicaid application they would ask for all of their assets as well as income sources, including social security.

Medicaid breaks the assets into two different sections. One section is “countable assets“ and the other section is “non-countable assets.“ When I am explaining this to clients, I draw the exact T-Chart that you see. In one column are the countable assets and the other column are the non-countable. The non-countable assets column is the good column. These are the assets where Medicaid has deemed them to be an asset that you should not have to liquidate to pay for your care. Unfortunately, this list is usually small relative to the other column. It is usually items like clothing, household furnishings, the residence, etc. These are assets that you should not have to “spend down” in order to be eligible for Medicaid. I should not have to sell the shirt off my back for Medicaid to kick in. Bad visual I know! Medicaid does not punish you for these assets when it comes to Medicaid eligibility.

Now, the Countable Assets—left column—are the ones they focus on. Countable assets would be checking accounts, IRAs, stocks, bonds, real estate that one is not living in, farmland (in most cases), etc. If John has “countable assets” in today’s dollars over $2,000 (Iowa), he is not eligible for Medicaid. They have to “spend down” their assets in order to become eligible. Keep in mind that the spouse that is not in the nursing home is allowed $137,400 in assets. This is to prevent “spousal impoverishment.” So, what does that mean? It means without proper planning they would have to spend down a large chunk of their $1.5 million in “non-countable assets.” To be exact, they would have to spend down $1,360,600 in assets. That would leave John with his $2,000 and her with her $137,400. This is without discussing Medicaid’s income limitations on John ($2,523 per month), which we will discuss in detail another time. In Sarah and John’s example, it would mean selling farmland and liquidating the IRA.

What strategies can be explored to avoid “Spend Down”?
There are several steps they can take (or should have already taken), but here are a few that one should look at:

  • They could have gifted some of their assets to others as the years have gone by. Now, what if Sarah and John gift all of their otherwise “countable assets” to somebody else the day before they apply for Medicaid? Would this make them eligible for Medicaid? Nope. The government has recognized this strategy and therefore has a five-year “lookback” in most states. For veterans, the lookback can be three years. Therefore, in this example, there would be a period of time where Sarah and John would have to pay their own way. This is called a “penalty period.”
  • Irrevocable Trusts: This is a great tool for Medicaid planning as it removes the assets from Sarah and John’s ownership. However, the lookback applies here as well. The farmland can be moved to an Irrevocable trust: Note: There are tradeoffs to moving property to an irrevocable trust, which is considered a separate entity from them. Make sure you work with an attorney to understand them. IRA money cannot be moved to an irrevocable trust. You must liquidate the IRA first.
  • A Medicaid Compliant Immediate Annuity: This annuity would be for the retirement assets they have put aside. The notion here is, when you take an otherwise “countable asset” and turn it into an income stream (usually to the spouse outside of the nursing home), it becomes exempt from being a “countable asset.” Therefore, the five-year lookback does not apply here. Of the three options I lay out here, this is the “last minute” option as it is not subject to the lookback. Note: Not all immediate annuities are “Medicaid Compliant.” Very few of them are. To be a “Medicaid Compliant Annuity,” there are a handful of requirements that must be met with the annuity. Therefore, the list of these annuities is very small but very effective.

In closing, it is important to note a couple of things:

Medicaid does seek to “recover” what John and Sarah will take from the Medicaid system once they both pass away! Many consumers are not aware of this. Although there are strategies (Irrevocable Trusts) that work as a shield against recovery, it is almost always best that consumers never get on Medicaid in the first place and instead have LTCI to cover the cost. Without tapping into Medicaid, the estate does not have the government coming after them for “recovery.” The long term care products available today are fabulous and have innovated significantly. Plus, when you have the means to pay for long term care yourself, you have choices… One such choice would be to be cared for in your own home versus a nursing home!

Lastly, in this article we merely talked about the assets and the general idea around Medicaid Planning in a greatly simplified way. We did not even get into the maximum income for John to not have to pay the nursing home himself. We also did not speak about single retirees, Miller Trusts, Minimum Monthly Needs Allowance, Funeral Trusts, homes contiguous with farmland, Medicaid Divorces, Veterans, etc. So, if you have any questions or would like my feedback and guidance feel free to reach out.

Sequence Of Returns Risk And Sequence Of Inflation Risk

This article is a bit of a preface to an article I have coming out next month that explores various systematic withdrawal strategies versus GLWBs. Without letting the cat out of the bag, I wanted to write this first because this will be an article that I can reference back to on a topic that is front and center in the conversation of systematic withdrawal strategies—Sequence of Returns Risk. If one does not understand sequence of returns risk, then my next article will likely be lost on them. Now, even if you are one that knows what sequence of returns risk is (as many agents do), then this article will still be useful to you as I show examples of how I articulate it to consumers.

But first, Mount Everest!
It is the crown jewel of mountain climbing achievements. It’s almost six miles high. I have read statistics that say that if you were to go directly from sea level to the top of Mount Everest without acclimating yourself gradually, you would be dead in a matter of minutes because of how thin the air is. The summit is the ultimate achievement for mountain climbers. However, a sizable portion of people that died climbing Mount Everest died after they hit the summit. Clearly, when you make it to the summit that does not mean the battle is over.

I have quite a few personal clients and I also conduct joint client calls with the agents of CG Financial Group. So, I talk to scores of pre-retirees per week and what I have found is this: Sometimes their goal is to hit the rhetorical “summit” of retirement. That is, to retire with X dollars and then it is smooth sailing from there. However, as most of us know, in the pre-retirement years you are not subject to things like sequence of returns risk and long term care risk. In the post retirement years—after hitting the summit—you are exposed to these new risks which makes the downhill trek from the summit much more treacherous. Just because a “financial advisor“ did an excellent job getting one up the hill, doesn’t mean they are fit for helping one with the trek back down. The calculus can be much tougher as you are making the trek back down the hill. Of course, what I am referring to with the “trek back down the hill“ is the post-retirement/decumulation years.

How I explain Sequence of Returns Risk
Let’s quickly discuss how simple the trek up Mount Everest is versus the trek back down the hill. From the beginning of 2000 to the beginning of 2020 the S&P 500 averaged 4.02 percent from a compound average growth rate (CAGR) standpoint. Furthermore, from a standpoint of just “simple averages“ the S&P 500 averaged 5.6 percent over that period. What this means is, without any withdrawals being taken out, if you put in $100,000 at the beginning you would have $219,862 at the end. And whether you got the returns in true sequential order from 2000 to 2020 or received those returns in reverse order from 2020 to 2000, the result would’ve been the same, $219,862. If you had a magic crystal ball at the beginning of the 20-year period and it told you that you would average 4.02 percent, you would have ended with $219,862, period!

Oftentimes after stating the above I will then ask consumers if they would have felt comfortable taking inflation-adjusted income of $4000—or four percent—each year out of their portfolio for the rest of their lives, given the return numbers I just laid out. A large majority of them state they would be comfortable doing that and comfortable that they would not run out of money over a 30-year retirement. After all, if the “simple average“ was 5.6 percent over that period, then taking out only four percent (initially) seems doable, right? Wrong! Simple averages lie especially when you have sequence of returns risk.

In short, in the pre-retirement years that crystal ball may work very well—even though it obviously doesn’t exist. Some folks believe they have the crystal ball. Remember Gordan Gekko? Furthermore, sometimes the “crystal ball” is quoting the past like “since 1926 the S&P 500 has averaged 10 percent per year.”

That “average return” of 10 percent is indeed true on the S&P 500. But in the post-retirement years, even if you do wholeheartedly believe that will continue, you might as well throw that crystal ball away unless it can also tell you in what order those returns are going to come. This is because of the impact of withdrawal‘s getting you into a death spiral if you were to have a poor “sequence of returns.”

A quick example of “Poor Sequence of Returns”
From the $100,000 portfolio at retirement, let’s assume that we will withdraw $4,000 initially and then add/subtract the growth of the S&P 500 for the next year, and then take another withdrawal at the beginning of the following year. The $4,000 will be increased by three percent (Hypothetical Inflation) every year from the beginning of 2000 to the beginning of 2020. With this true sequence from 2000 to 2020, our client would have run out of money in the 18th year even after getting a “Simple Average Return” of 5.6 percent. Unfortunately, many consumers experienced this “sequence” firsthand.

Conversely, if you reversed those returns and experienced the exact same returns, just in reverse order, how would you have turned out? Going backwards from 2020 to 2000 would have done very well for the consumers with an ending balance still being $107,741. So, the question is, did the crystal ball also tell you which scenario you would actually experience? Will it be 2000—2020 or 2020—2000? The crystal ball is useless here…

To summarize, in post-retirement, even if our financial advisor/crystal ball is 100 percent correct when they tell you that you are going to get X-percent per year on “average,” you might as well throw that crystal ball away unless it can also tell you what the “sequence of returns” will be.

A Quick Note on Inflation
Like how insurance policies can come with “riders,” I view the sequence of returns risk as having a little rider attached to it in a negative way. It has to do with the elephant in the room—the recent inflation that we have been experiencing. “Sequence of inflation” is the risk that piggybacks on sequence of returns risk. Many consumers are retiring today or retired last year and are finding that their first year in retirement is much more expensive than what they assumed! In other words, many of the retirement income models assume a three percent inflation rate that elevates the withdrawal amount as time goes by, as we have discussed thus far. But now consumers are having to take a withdrawal that is four percent higher than what they had originally prognosticated. That’s right, inflation from December 2020 to December of 2021 has been seven percent! To be clear, this does not mean that the retiree’s portfolio “drawdown” is increased by four percent. It means the inflation adjustment on the income is increased this year to seven percent. What kind of an impact does this have in our “sequence of returns” scenario?

If I assume that the withdrawal that started out at $4,000 increases by seven percent the following year (year two) then six percent, then five percent, then four percent, then three percent (for the remainder), following are the results. (Reminder, this is in contrast to the three percent flat inflation that we have been assuming throughout this article.)

Good Sequence of Returns (2020-2000)
The ending portfolio (S&P 500) balance is $98,109 versus the $107,741 number we would get if we only used three percent level inflation.

Bad Sequence of Returns (2000-2020)
The year in which you would run out of money with the “tapered seven percent inflation” is in year sixteen—versus year 18.

Although shaving two years off a portfolio because of sequence of inflation risk may not seem drastic, I would argue that if a retiree were actually living out this scenario (which many will), two years is precious lost time! This is yet another risk that financial professionals should collaborate with their clients to address.

Social Security Planning: Don’t Let Your Clients Leave Money On The Table

Since the file and suspend strategy met its demise with The Bipartisan Budget Act of 2015 and the “restricted application“ opportunity has dwindled to almost nothing—again, thanks to The BBA of 2015—many consumers and agents tend to underestimate the Social Security planning strategies that still remain. This underestimation is understood because on the surface Social Security filing seems to have come down to just a timing issue. However, do not mistake the “timing issue“ with ease and simplicity when it comes to helping your clients optimize their Social Security retirement benefits. There is indeed a massive need in helping your clients maximize their Social Security retirement benefits. After all, by consumers making the wrong decisions, it can cost them hundreds of thousands of dollars over their lifetimes.

To demonstrate an example, I will use myself. My dad died at age 62 and his dad died in his late 60s. Cancer runs rampant in the Gipple family. Because of this I probably should not even buy unripened bananas anymore. So, when I ask audiences of consumers when I should file for Social Security retirement benefits, they exclaim, “Age 62!” As many of us know, age 62 is the earliest you can file for SS retirement benefits unless you are a widow or widower. The audience is on the right track because if I were to die at age 63, for example, I would’ve gotten the most money from the Social Security administration by filing at age 62, versus my full retirement age at 67. And certainly by me trying to get the most “delayed retirement credits“ and waiting until age 70 to file, that would seem extremely misguided. However, filing at age 70 is exactly what I am going to do!

Why would I file at age 70 if I believe that I am on the short end of the life expectancy tables? Because, again, there is always more to Social Security than meets the eye. Because I have been the primary breadwinner in the family, my Social Security benefit will be much larger than my wife’s. What that means is, when I pass away—which will certainly be before my wife—she effectively steps into my shoes and inherits the Social Security benefit that I have been receiving. That is her “survivor benefit.“ So, my filing decision is not just about my lifetime, it is also about my spouse’s. That is just one tiny example of how the “timing issue“ is much more complicated than meets the eye.

Another example of the oversimplification of Social Security in the minds of consumers and agents is the fact that many folks believe that the filing ages are “actuarially equivalent“ at life expectancy and it doesn’t really matter when they file.

Before I make a point on this let me step back and explain the options available to the consumer. He/she could generally file for Social Security retirement benefits anytime between age 62 and age 70. Technically, they could file beyond age 70 but the “delayed retirement credits“ only go to age 70. If they file for Social Security at age 62, they get less of a monthly benefit for longer. They get less of a monthly benefit with this strategy because of early filing penalties. However, they get those payments for longer over their lifetime. Another option is they could file for benefits at age 70 and get a higher monthly benefit for a shorter period. The higher monthly benefits are because of the eight percent per year “delayed retirement credits” that the Social Security Administration gives them for delaying their filing. The shorter period is because of the fact that they are closer to their death when they file. And, of course, the client has the option of taking their benefits at any time between age 62 and 70, including their designated “full retirement age.“

Many people believe that all of the age possibilities in which they can file were created to be “actuarially equivalent“ at their life expectancy. It is true that that was the original intent with the way that the early filing penalties and delayed retirement credits were created. However, remember that much of the brackets that determine the benefits were created back in 1983! Have life expectancies changed since then? Absolutely. Furthermore, many of us are either healthier or less healthy than the overall “life expectancy“ that goes into these calculations.

My main point to all of this is, the appropriate time to file for Social Security benefits is specific to each and every one of us. Consumers need your help in finding the optimal time to file and by helping with Social Security planning, you can help your clients capture possibly hundreds of thousands of dollars over their lifetimes that they otherwise would have left on the table.

I have used a couple of very simplified examples above just to demonstrate a point that the Social Security “optimization” opportunities should not be overlooked because of recent legislation. This point is further highlighted once we get into the more complicated items like Social Security taxation, spousal benefits, ex-spousal benefits, widow/widower benefits, staggered filing strategies between both spouses, etc.

Follow The Science: The Power Of Financial Plans

“Follow the Science!” Yes, we have heard this a lot over the last 18 months from both sides of the aisle. Because I do not wish to experience an involuntary early retirement from my Broker World columnist duties, I am not going to discuss politics here. But I do believe in the power of science and probably 100 percent of the Broker World audience does as well.

In discussing science versus art, science is a mechanism for providing “proof” to the person that observes the science. Conversely, art is more subjective to the person that observes the artwork. For example, take a beautiful piece of art, a Van Gogh painting. I, as somebody who grew up in a blue-collar Iowa family, am going to have less appreciation for a Van Gogh than the rich guy in the Grey Poupon commercials would have. Again, art leaves room for interpretation. With science, that is not so much the case. If science says that the sun will come out tomorrow, I will believe it.

The reason I love science when it comes to our business is because science does not leave much room for interpretation assuming the source and data are reliable. In my work, I really love science because science supports the wonderful products that we are offering our clients. The value of the insurance industry’s hedging capabilities, the tax advantages, the mortality credits, the longevity credits, etc., cannot be debated in a “scientific” argument. Through “pooling” insurance companies, and only insurance companies, can do certain things that no other companies can do. So, since science is on our side, we should leverage it.

So how do we demonstrate this science/proof to our clients outside of showing them clever quotes from industry “scientists” that indicate that our products are scientifically viable? You can do it in many ways and one way is through the use of financial planning software.

To back up for a second, I am not minimizing art because much of what we do in our business is artwork. The largest form of art that we deploy every day is in how we communicate in a simplified manner what the science says. The art of storytelling, humor, and simplification is extremely valuable. This art that you deploy takes the sharp edges off the scientific information we need to communicate to our clients. But, you sometimes need to set forth a scientific argument.

In essence, if you can arm yourself with the science/proof that these products work while also using art to explain the science/proof in a simplistic fashion, you will win.

As I help agents in helping their clients with retirement planning, here is what I often observe: That—because these agents are seasoned experts—many times they just know intuitively that these products will help the client when it comes to hedging the various retirement risks. After all, if a client does not want to lose money in the stock market, then it is usually obviously clear that the client should look at a fixed or indexed annuity! Some things do not require rigorous analysis. Additionally, these pro agents are usually great “artists” when it comes to explaining and simplifying the product strategies and, therefore, they have been very successful in selling. However, many times I will observe agents that lack a “scientific process” when it comes to cases that need to be backed by data and science. To demonstrate this point, I often will ask agents, “Let’s say you have a 55-year-old client that wants to retire 10 years from now and this person has just given you all of her portfolio details and then says, ‘So how much can I take in annual income once I retire?’ What is your answer?” Many times, it’s a blank stare back at me because the agent may not have the answer or even a tool/system to scientifically arrive at an estimate. This is where financial planning software comes in!

If you are in the field of retirement planning with consumers, you would likely agree with me that many consumers have the following questions:

  • How much income should I plan to take in retirement based on what I am spending today?
  • Based on what I currently have in savings and what I am saving, how much can I take in retirement?
  • Am I on track or should I be saving more?
  • Will I be able to have the retirement I would like if I retire at X age?
  • When should I file for Social Security to get the maximum amount over my life?
  • What about long term care derailing my retirement? Can you demonstrate how that would impact me?
  • What about inflation?

Good financial planning software will provide answers to all the above questions. Note that this column is not about any one software system as there are several in the marketplace that do what I explain.

Furthermore, good financial planning software will also incorporate Monte Carlo Analysis. Monte Carlo Analysis is statistical modeling using 5,000–10,000 different data points that will help you arrive at an estimate of what the client’s portfolio will grow to and what the client will be estimated to take at retirement, along with corresponding “confidence levels.” For example, the system may estimate that a particular client with a current portfolio of $X in mutual funds can take $30,000 per year out in retirement dollars with there being a 90 percent confidence level that she will not run out of money in retirement. That same Monte Carlo Analysis may also say that taking $40,000 per year ($10k more) in retirement will drop the “confidence” down to 50 percent. Disclaimer: If you are not securities registered, remember to heed regulations in what you can and cannot “recommend.”

Not only will this software model out the client’s current portfolio and what she is projected to have at retirement, it will also allow you to introduce changes to the portfolio and the positive impact those changes will make in the future values. For instance, financial planning software will generally allow you to demonstrate an increase in after-tax retirement income if the client introduces annuities or cash value life insurance to their portfolio! Furthermore, the software will allow you to project the size of the consumer’s estate at various ages and then introduce a great estate planning tool—life insurance!

Now, for some of the more skeptical folks reading this article, you may be saying, “But Charlie, everything you mention above has to do with ‘estimates’ that could be way off.” You are absolutely correct, but that is a part of my point. By introducing the products that we offer that get rid of the “estimates” and introduce guarantees, we can scientifically demonstrate the value we provide to our consumers.

Allow me to demonstrate in a greatly simplified context what I meant in that last paragraph. The following is just a tiny microcosm of what using financial planning software can demonstrate:

Take a consumer that is 65 years-old and wants to retire today. She has $1 million in a 60 percent equity and 40 percent bond portfolio, and her budget requires that she take $40,000 per year in retirement income from this portfolio. Using the Monte Carlo Analysis, the software will show somewhere around a 50 percent “confidence level” that her portfolio will last her 30 year retirement. This is usually displayed as a pretty bar chart or line graph. However, need I say that 50 percent confidence is not enough? If airline pilots were comfortable with a 50 percent “confidence level” my feet would never leave the ground!

Conversely, what happens to this scenario in the financial planning software and the resulting printout when you introduce an annuity that will guarantee her much more than a four percent payout rate? The “confidence level” goes up and the pretty bar chart or line graph goes up relative to the “status quo.” And when the client sees the “proposed scenario” next to the “status quo scenario” it becomes clear to her the value of your recommendation.

Again, the above example was greatly simplified as we did not even get into taxes, social security, estate planning, second-to-die policies, etc.! It was merely a microcosm of my overall point that financial plans allow you to demonstrate the power of the products we offer and allow you (and me) to buck the stereotype of just trying to “sell a product.”

Follow the science and preach the science because the science is on the side of annuities and life insurance!

An “Opportunity For Improvement” In Independent Distribution

I have written before about my son, Matthew, who is the most creative kid I have ever seen. So, I will start this column with a quick story about Matthew. A couple of years ago he and his older brother were sent home from school to do a fundraising project where they would have to go to our friends and the neighbors to get funds. If they raised a bunch of money, they each got prizes. The more that they raised, the better prizes they got. The prizes got progressively larger. To oversimplify, if they each raised $50 worth of items, they each got a book or something. However, if one of them raised $100 in funds, he got a bicycle. As I, Seth, and Matthew were looking at the sheet with the various prizes and thresholds, I noticed Matthew was thinking about it hard. He then proposed a plan. He proposed to Seth that they both sell individually, but they both should put all of the sales on Matthew’s fundraising ledger. Smart kid. However, I shut down that idea. I said, “So what if every family in your school did that Matthew? The school wouldn’t be able to afford all the bicycles and you would be left with a balloon or something.” More on this in a bit.

After being in the business for over 20-years I have been fortunate to travel the world and develop friendships that are multiples of what I ever had prior to being in the business. I have friends that are agents, friends that are competing marketing organizations, and friends that are in the carrier world. This business has been great to me and there is no better business on Earth than the independent distribution of financial services.

I emphasize the above “Independent Distribution” because in this day and age when consumers can search online for the “cheapest” or “best“ products, the chances are that we in independent distribution have those products or equivalent products available for our clients. As I like to say, we are never “out producted.” Conversely, if we were stuck to one product offering, if that product offering was not in the top three or five, we would have a difficult time. In independent distribution, we all—agents, BGAs, and IMOs—have choice and options! So, I love this industry, I love the independent channel, and I will probably continue to work in this industry until I leave this world. I don’t think I could have more fun in retirement than what I’m having now!

With that said, if you know me you know that I shoot straight if I believe something in my heart, even if it will not earn me friends. If you gave me a choice, I would rather be trusted than liked. Although both would be nice!

So, in the vein of shooting straight, I want to point out what I believe is one of the issues our channel is faced with that I have always known but was further highlighted to me when I created my own marketing organization three years ago.

First off, the linchpin of my observation. When I was in the carrier world, I was a couple layers removed from the agents, even though I had been training and educating those agents for years. Doesn’t that seem like a contradiction? It is not a contradiction because training and educating agents is completely different than sitting down with them and talking about the ailments in their businesses and addressing their concerns. Three years ago I put myself on the ground floor where I could help these fine folks by doing exactly that—listening to the issues they were experiencing with their businesses and helping solve them. What was the surprise that I found? Probably one of the very few surprises I have experienced since opening my independent marketing organization? That there is a true and genuine thirst for training, mentorship, and education inside many of the financial professionals in the independent space. This is a wonderful thing to me because who doesn’t like having people that genuinely want to get better at their trade? However, I observed a flip side to this “thirst.” Why do these agents have such a thirst? What I found was, this thirst is there with many agents because they have not found anybody to quench it. This is an area of opportunity for us as a channel!

By the way, the agents that are receiving this training, mentorship, etc., will generally never consider leaving their IMO or BGA. They love them! Because these IMOs/BGAs took the pain to create the processes and systems to do it right, they will have agents for life. The agents love them because they get to have their cake and eat it too: Great compensation levels and also great training.

So, is that the end of my column? That I think we need more training and education? No. If finding great training, education and mentorship is a concern in our channel—as is probably the case in many industries—then what do I think one of the causes of that problem is? I think it very much has to do with Matthew… The inclination for distributors/IMO‘s/BGAs to want to recruit agencies in order to make their production larger, without any synergistic components to the relationship. Getting larger is great but the last part, “without any synergistic components to the relationship,” is the area I want to highlight.

Example. I often get calls from larger IMOs who try to recruit my company “under” their hierarchy. They tell me that the relationship will be a “mutually beneficial relationship.“ And when I know that my systems, technology, education, is likely as good or better than theirs, I am of course curious about what the benefit to me would be. Their response? That 1+1 = 3 from a compensation standpoint with the carriers and that extra “1” they will split with me. In other words, the value proposition to both of us would purely be to get more money from the carriers. Again, Matthew’s idea was not a new idea apparently.

The above is not the way that independent distribution was meant to be. It was intended that independent distribution was to share one similarity with the captive channel. That there has to be an intermediary that trains, educates, and provides services and technology to the “downline” agents or agencies. And to incentivize this, the carriers of course would compensate the IMOs and BGAs through distributor compensation that—as I alluded to—is progressive with production scale.

Does great training and education take place in the independent channel? Absolutely it does! And for much of the industry, the structure works very well and some IMOs provide terrific value to their downlines. In fact, for many of our contracts, I am associated with a larger IMO that is invaluable to me. For these IMOs that are providing training, education, mentorship, systems, underwriting resources, technology, marketing, etc., they should be getting the larger share of the carriers dollars versus what the carriers are forced to provide to those that get larger with the main goal of 1+1=3 from a compensation standpoint. Again, there can never be too much training, mentorship and education—so by the carriers rewarding that type of behavior the industry would only get better. And this is the reasoning behind what the carriers created in their compensation schedules, to reward the distributors that grow their production via training, education, etc.

However, because we are all independent (versus captive), it is extremely hard for carriers to police the original intent. At XYZ Captive Insurance Company, if a general agency was not doing their job in training and educating, they are reprimanded or terminated. This is not so easy in the independent channel and makes for exceedingly difficult calculus for the carriers. For example, if an IMO/BGA were to practice the “stacking” like what Matthew proposed, a carrier cannot get too carried away with enforcement. This is because that IMO/BGA will always have other carriers available to them if one carrier enforces the rules. So, many times the carriers’ hands are tied.

Because there is only so much pricing in products, the compensation schedules are basically a zero-sum game. Similar to how I told Matthew that eventually he would only get a balloon. So, for years, the carriers have been wrestling with the issue of how do they allocate more of the bonus schedule to those that are truly providing value to their downline without destroying the large amount of distribution that they have? There is no easy answer to this other than for all those involved—carriers, IMOs, BGAs, agents—to have a relentless focus on training, education, etc. When this happens, the money will take care of itself for all involved.

Lastly, this issue is not just about the flow of money and it’s not even about carriers, IMOs, BGAs, or agents. This issue is also about the value that our channel provides to consumers. When I witness agents that are truly thirsty for more knowledge, whether they receive that knowledge or not will ultimately impact the consumer that works with that agent. And clearly, the more educated and trained the agent is, the better we as an industry and channel will do for the end consumer.

The Need For General Contractors

Recently my entire neighborhood here in Iowa was hammered by a storm that came with baseball sized hail. My roof was damaged, gutters destroyed, paint on my house was chipped, the deck was pelted, and my garage door looked like it had been used as a pitching backstop. Although the insurance company was great with stating that they would cover everything, it quickly became clear to us that the logistics were going to be very stressful.

Many of the contractors we spoke to only did one thing or the other. One contractor only did roofs, no garage doors. Another contractor only did siding painting but didn’t want anything to do with replacing decks. One contractor was willing to deal directly with the insurance company, the other was not.

All these contractors doing their own thing but yet working independently of one another made the choreography of tasks extremely stressful for us to plan out. For example, the painting of our siding and the replacement of our deck should be done in the right chronological order. In other words, if you were going to paint the house, it is easier to paint the house with the deck removed. And in our case, if the deck needs to be replaced, then why not remove it, paint the house, then build the new deck. The painter and the deck builder being two separate people made the planning of this a bit cumbersome. This is why choosing the right contractor is incredibly important, meaning that you should be vetting them beforehand to see what they can do, when they can do it, and if they’ll do it in order. No matter where you are, whether you need a deck painting service in Texas or a Deck Oiling sydney service, you have got to get all your ducks in a row before saying yes to any work.

As you can imagine, talking with several contractors about the choreography of everything became stressful, and that doesn’t even include the stack of multiple quotes that we would have to collect and send to the insurance company.

Well, we finally found a general contractor that said he would do it all. He had subcontractors that he worked with that specialized in each of the areas we needed addressed. Furthermore, he was at the top of the hierarchy and would handle all the choreography, paperwork submission to insurance companies, etc. Needless to say, we went with him.

Although a painful process, the need to get all of this done was obvious to us because of the “realization of necessity.” We could clearly see that our house was almost destroyed, and we knew we had to get the roof fixed-ideally before it rained again. With tangible items like cars, houses, etc., it is very easy to have a “realization of necessity” when it is destroyed. We can see it! Unfortunately, with non-tangible items like finance, that “realization” rarely happens for many consumers. And it is the realization that drives people to go through the process, even though that process might be painful for the consumer.

That last paragraph is very important because finance is indeed painful to many consumers, just like dealing with contractors and insurance companies was painful for me. It’s not breaking news when I say that people are “pain averse”-which is why many people don’t want to think about their finances. What I would like to discuss in this article is taking the “pain” out of the process by you working as a “General Contractor” for your clients. And by doing so, you can relieve some of the pain that typically comes along with discussing finances. You can also help the client with the “choreography” that many times is required with their finances.

Here are the steps that I would suggest taking to become the general contractor for your clients.

  1. Simplify with stories: Simplification and storytelling take the stress out of finances, as alluded to previously. Learn to be a great storyteller and simplifier.

2. Understand financial planning and have the right software: Recently I have been training agents on how to have this conversation while using financial planning software that uses “Monte Carlo Analysis.” Many have said it was some of the most valuable training they have received. Financial planning software generally allows you to work with the client’s entire portfolio because it allows you to answer questions like the below:

  • When can they retire?
  • How much can they be “projected” to take from their portfolio at retirement?
  • What would a long term care event do to their retirement portfolio-at age 80 for example?
  • How does inflation impact their portfolio, especially if “healthcare inflation” is five percent per year?
  • What is projected to be the size of the estate when they pass away at age 85, 90, 95, etc.?
  • Does the client need any trust work done?
  • What would happen to the size of their estate if you added a second-to-die policy payout upon the client’s and spouse’s death?
  • What happens to their portfolio’s “chance of success” when you add an annuity with guaranteed lifetime income?
  • What are the confidence levels if the client were to withdraw various levels of income during retirement?

3. Create Your List of “Subcontractors”: You may be thinking, “What if I am not a trust attorney? How can I implement trusts?” or “What if I am not a registered rep and cannot recommend selling or buying securities in their plan?”

You are right by asking those questions, this is where I believe you should take the time to interview these folks in your local area:

  • Estate Attorneys: You can just do a Google search for “estate or trust attorneys near me.” As you interview these attorneys, get a feel about their philosophies. A good marketing organization would help you with a script of what to ask these estate attorneys. At CG Financial Group we have “cheat-sheets” on how to navigate these conversations. There are several things to ask, such as: Do they do wills, living trusts, and power of attorneys? And for the higher net worth clients you might have, does the attorney do irrevocable life insurance trusts? Also ask if they are licensed to sell insurance! If they are, that can create a conflict. If you have a good impression of the estate attorney, maybe ask if he/she knows of any good CPAs as well.
  • CPAs: This is so you have a resource for your clients to file their taxes. Very similar to the estate attorneys, ask about how they do their jobs. Do they recommend tax mitigation strategies like traditional IRAs, Roth IRA‘s, or life insurance strategies? One thing I have observed with many estate attorneys and CPAs is that they are more about what the client’s current situation is than they are about planning for the future. In our profession, we don’t have the luxury of ignoring the future! Does their philosophy align with yours? Of course, make sure there is no conflict-such as the CPA also being licensed to sell insurance.
  • Mortgage Brokers/Bankers: As I speak with a lot of clients, it amazes me how much in unnecessary interest they are paying when a quick conversation with a trusted mortgage broker or banker could save them thousands of dollars per year in interest. Consumers are in debt and if you can help them in this area, you will be their hero. Know a good mortgage broker/banker. By the way, reducing their mortgage payments can be input into the financial plan and thus show a better retirement portfolio!
  • Financial advisors: Of course, if you are already a financial advisor dealing with securities, you would not want to direct your clients to a financial advisor. But for those of you that are insurance only licensed, it would make sense to interview various financial advisors that deal with the securities. There are many financial advisors that do not work with annuities and do not like to deal with underwriting on life insurance, and therefore they stay away from these products. There are opportunities for you-the insurance agent-to have great conversations with the financial advisors.
  • Financial planning software that I mentioned previously often will show the client that by adding an annuity to their portfolio that they can be more aggressive with the rest of their portfolio. The end result is a “probability of portfolio success” that is much higher than before the annuity was introduced. However, if you are an insurance only agent, you cannot make recommendations on buying or selling securities. This is where a “subcontractor” can come in. I promise you, if you speak with a financial advisor about this logic, he/she would be all ears in affiliating with you.

I really want to emphasize that last paragraph. Helping to put a portion of the client’s money into a “conservative product” like an indexed annuity with a guaranteed lifetime withdrawal benefit should impact the rest of the client’s portfolio. Meaning, the financial advisor should be able to be more aggressive with the rest of the client’s portfolio. Many times, the insurance agent and the financial advisor work independently from one another and that is equivalent to my deck guy and painting guy working independently of one another. Or, heaven forbid, working against one another which is common in our industry.

Your clients need a “General Contractor.” Be that guy/gal.

Annuities: Retirement Is 43 Percent Off?

Many of the agents that work with CG Financial Group are well aware of the “Four Percent Rule” and the history around it. You probably are as well. I also make sure that agents are very familiar with the 2.8 percent rule. Why do I think understanding these rules are important for folks that sell annuities? Because these “rules of thumb” were not created by annuity practitioners, yet they do a great job of selling annuities if they are used correctly. I do it all the time.

To review, in 1994 William Bengen created what turned out to be quite a profound retirement rule of thumb that many practitioners have followed over the decades. That rule is, whatever your retirement balance is, if you multiply that by four percent, that is the amount you should take no more out than in your first year of retirement. Then—in the following years—you can take the same amount adjusted for inflation. What that means is, somebody who has $1 million as a retirement balance should not take out any more than $40,000 in the first year of retirement. The inverse math is to say that whatever the client needs in annual retirement income, they can multiply that by 25 to arrive at the dollar amount required at retirement to support that level of withdrawals. Whether you multiply the annual need times 25, or multiply the retirement balance times four percent, that is the four percent rule.

To keep it simple for consumers what I say is, “Whatever you need in retirement income, multiply that times 25 and that is the retirement balance you should have, which is usually a lot of money.” But I also make sure to state this next part. That the four percent rule is outdated!

What is the new rule? The new rule is that if you have $1 million at retirement, you should multiply that by 2.8 percent! That’s right, Morningstar says that because interest rates are so low today that 2.8 percent is a more reasonable assumption. When you take that same inverse math, I tell consumers that today they need to multiply their annual retirement need by approximately 35! That means that our retiree that needs $40,000 per year in income should have a balance at retirement of approximately $1.4 million.

Again, these studies are not made-up studies by insurance agents just to sell more annuities, which is one of the reasons I like them. To the contrary, these studies are from credible sources like William Bengen, Morningstar, Wade Pfau, and a large list of others.

Now to the punchline: There is a part of the financial products world that allows you to purchase your retirement at a “discount.” What I am referring to is annuities. For instance, today it is not uncommon to have a payout factor on an indexed annuity with a GLWB rider to the tune of five percent for a 65-year-old. Payout factors vary by age which will make my math below change. What a payout factor of five percent means is, whatever the income amount is that somebody needs in retirement, multiply that by only 20 times—versus 25 or 35 times. That will be the required amount to have your X dollars in annual retirement income guaranteed. So, for our individual needing $40,000, he/she only needs $800,000, versus $1.4 million. That represents a 20 percent discount from the four percent rule ($1 million) and a 43 percent discount from the 2.8 percent rule ($1.4 million). Now that’s Champagne value on a Busch Light budget!

Disclaimer with the last paragraph: Technically those old rules of thumb include inflation adjustments where many GLWBs do not. I have previously written a response to that which you can request from me.

One last very cool point: once a retiree guarantees themselves that baseline income level they need in retirement with annuities, whatever they saved by putting less money into that annuity relative to the stock/bond portfolio using the 2.8 percent rule, they can now be more aggressive with. In the example above, that dollar amount was $600k that they “saved”. Hence, putting only $800K in an annuity is $600k less (and 43 percent less) than the $1.4 million used in our “2.8 percent rule”.

Using software that uses 5,000 different Monte Carlo data points in the market, I am then able to see what happens to a consumer’s portfolio if we did two things:

  1. Introduced annuities into the portfolio to support their desired $40k per year (in the previous example).
  2. Became a little more aggressive with the remainder that is outside the annuity value.

Once the annuity is introduced, the chances of “retirement success” rises—in some cases to almost 100 percent. But even more interesting is, for the remaining portfolio balance that is outside of the annuity, this software allows me to toggle over to a more aggressive portfolio than the baseline setup. This allows us to see how that $600k invested more aggressively impacts the projected portfolio value and the chance of success. Many times, the chance of success increases even further.

The last part is extremely interesting because it is a different way of thinking about a conservative client’s portfolio. This is the idea of being very conservative with a chunk of the client’s portfolio and aggressive with another chunk of their portfolio. This is in contrast to just being conservative with the entire portfolio.

Some might think it is dangerous to have a chunk of their portfolio that is more aggressive than what was originally intended. I would argue that if you have the client’s baseline income need that is guaranteed through the use of the annuity, then the more aggressive approach with the remainder of the money can bear fruit.

Of course, the proper licensure is required to give recommendations around the securities. However, even if you are not licensed to discuss the securities portfolio with your clients, you can discuss your philosophy above with “investment advisors” that you can network with as a referral source. I have seen many agents over the years that work in partnership with an investment advisor or two and they each have their own spoke in the wheel. The agent is the insurance expert, and the Investment Advisor is the securities expert. That is a quick “Networking Idea” for you.

Why Your Annuity Trumpet Should Get Louder As Interest Rates Decrease

I know the title of this column seems contrary to what you would think but hear me out as I discuss the “relativity game” that annuities play and play very well. You may be thinking that this is yet another conversation about how annuities usually pay more than other “interest bearing” products like CDs, but this is not. Most of us know that the average five-year CD rate in the US is around 30 basis points today.* Conversely, you can get a five-year guaranteed annuity for close to three percent. Need I say more?

Instead, I would like to go a little deeper with this column and have a little more of an “economic” conversation about prevailing rates and the guaranteed income that annuities provide.

At the time of this writing, the 10-year Treasury Bond’s yield is around 1.20 percent and has dropped from 1.6 percent over just a few months. The 30-year Treasury is around 1.9 percent, down from around 2.45 percent a few months ago. When I think of this rapid drop, I tend to think of the relative value of annuity payouts over that same period of time. In other words, the implicit or perceived value of a hypothetical indexed annuity with a GLWB rider should have gone up over the last couple of months. That is assuming that the carrier did not decrease the payout factor on that annuity of course.

Why do I think the perceived value of annuities should have increased? Consider this: The reason that the price of bonds increase as they are traded in the secondary market when interest rates drop is because their set level of coupon payments (semi-annual interest payments) become more valuable. Obviously, investors prefer a higher paying coupon rate over a lower paying coupon and therefore the demand for those higher paying bonds drives the prices of those bonds up. So, when you think of how most of the annuities that we had two months ago are still around and still paying the same level of income as they did two months ago, that same annuity should be perceived to be more valuable because of decreasing prevailing interest rates.

Said another way, if you were going to buy a 30-year Treasury bond a few months ago that gave you X income, to purchase that same bond to get that same X-level of income today, you would need to pay around 12 percent more, based off my bond pricing formula. Hence, because of dropping interest rates, the 30-Year Treasury Bonds have increased in value by about 12 percent.

Conversely, if two months ago you had the ability to buy an annuity that would give you $5,000 per year for $100,000 in premium, you can likely still get that same annuity with the same $100,000 of premium. What a deal!

In my strange head that thinks of this stuff in a very academic and economic manner, I view that $5,000 income stream as being “on sale” to the tune of around 12 percent because of what has recently happened with prevailing interest rates.

By the way, if my commentary above seems like a strange and far-fetched way of looking at the value of annuities, it is not all that far-fetched. As a matter of fact, what I just laid out above is exactly the concept that underpins the “Market Value Adjustments” on annuities. If you were to have an annuity that has a Market Value Adjustment—as most do—then today the insurance company will give you more money back (or less of a surrender charge) than what they would have a few months ago, all else being equal. Furthermore, it is no coincidence that the MVA formula you see in the annuity policies is reminiscent of the formula that determines a bond’s prices when yields increase or decrease. Note: You can request a video from me where I explain exactly what an MVA is by emailing me.

My point to all of this is not that I think we should discuss bond pricing with our clients. Rather, my point is that there is a silver lining to decreasing interest rates. I believe that there should be an inverse relationship between what prevailing interest rates do and the volume of our annuity trumpets that we blow the direction of our prospects/clients.

In the end it is a relativity game and if you positioned annuities appropriately at the point of sale, annuities will rarely result in a dissatisfied consumer. This is because relative to other prevailing metrics (whether fixed rates or levels of income), annuities usually win.

Reference:
*https://www.fdic.gov/regulations/resources/rates.